| Param | Original file | Final file |
|---|---|---|
| Filename | modeM0/AS1A05_025T17_9000002868_19381cztM0_level2.evt | modeM0/AS1A05_025T17_9000002868_19381cztM0_level2_quad_clean.evt |
| Size (bytes) | 746,622,720 | 115,355,520 |
| Size | 712.0 MB | 110.0 MB |
| Events in quadrant A | 2,971,751 | 895,667 |
| Events in quadrant B | 3,091,138 | 904,572 |
| Events in quadrant C | 2,921,925 | 850,349 |
| Events in quadrant D | 13,239,578 | 441,650 |
| Mode M0 | |||
|---|---|---|---|
| Quadrant | BADHDUFLAG | Total packets | Discarded packets |
| A | 0 | 12332 | 1 |
| B | 0 | 12702 | 1 |
| C | 0 | 12219 | 1 |
| D | 0 | 43164 | 3 |
| Mode SS | |||
|---|---|---|---|
| Quadrant | BADHDUFLAG | Total packets | Discarded packets |
| A | 0 | 118 | 0 |
| B | 0 | 118 | 0 |
| C | 0 | 118 | 0 |
| D | 0 | 118 | 0 |
| Mode M9 | |||
|---|---|---|---|
| Quadrant | BADHDUFLAG | Total packets | Discarded packets |
| A | 0 | 13 | 0 |
| B | 0 | 13 | 0 |
| C | 0 | 13 | 0 |
| D | 0 | 13 | 0 |
| Quadrant | Total seconds | Saturated seconds | Saturation percentage |
|---|---|---|---|
| A | 5705 | 97 | 1.700263% |
| B | 5706 | 105 | 1.840168% |
| C | 5706 | 115 | 2.015422% |
| D | 5705 | 5196 | 91.078002% |
Noise dominated data is calculated using 1-second bins in cleaned event files. If a bin has >2000 counts, and if more than 50% of those come from <1% of pixels, then it is considered to be noise-dominated and hence unusable.
| Quadrant | # 1 sec bins | Bins with >0 counts | Bins with >2000 counts | High rate bins dominated by noise | Noise dominated (total time) | Noise dominated (detector-on time) | Marked lightcurve |
|---|---|---|---|---|---|---|---|
| A | 7040 | 5705 | 3 | 3 | 0.04% | 0.05% | 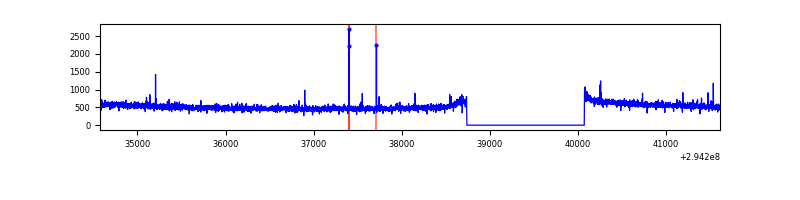 |
| B | 7041 | 5706 | 4 | 4 | 0.06% | 0.07% | 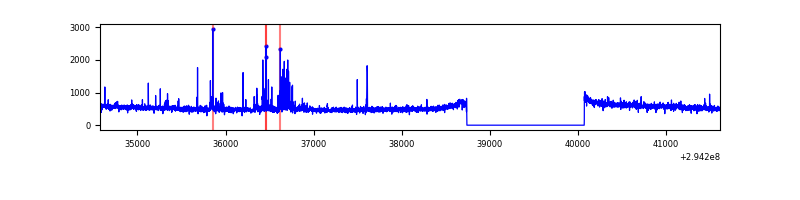 |
| C | 7041 | 5706 | 0 | 0 | 0.00% | 0.00% | 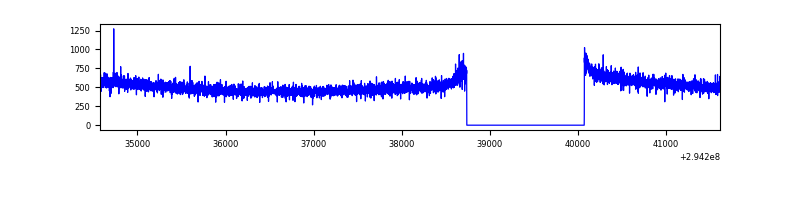 |
| D | 7039 | 5704 | 4837 | 4837 | 68.72% | 84.80% | 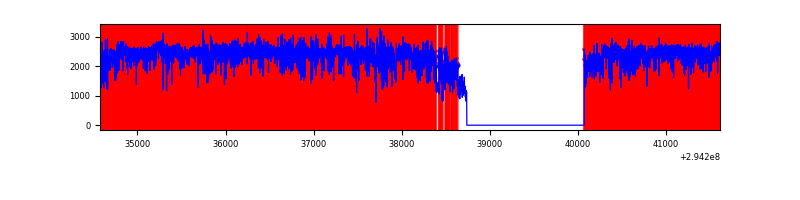 |
Top three noisy pixels from each quadrant. If the there are fewer than three noisy pixels in the level2.evt file, extra rows are filled as -1
| Pixel properties | Quadrant properties | ||||||
|---|---|---|---|---|---|---|---|
| Quadrant | DetID | PixID | Counts | Sigma | Mean | Median | Sigma |
| A | 5 | 16 | 12529 | 77.62 | 765 | 753 | 151.7 |
| A | 15 | 174 | 8419 | 50.53 | 765 | 753 | 151.7 |
| A | 12 | 96 | 6782 | 39.74 | 765 | 753 | 151.7 |
| B | 0 | 197 | 42724 | 302.26 | 757 | 742 | 138.9 |
| B | 0 | 190 | 22525 | 156.83 | 757 | 742 | 138.9 |
| B | 4 | 216 | 20791 | 144.35 | 757 | 742 | 138.9 |
| C | 14 | 238 | 116208 | 706.78 | 717 | 721 | 163.4 |
| C | 3 | 233 | 6303 | 34.16 | 717 | 721 | 163.4 |
| C | 13 | 61 | 5235 | 27.62 | 717 | 721 | 163.4 |
| D | 10 | 66 | 9499926 | 91096.82 | 437 | 426 | 104.3 |
| D | 7 | 238 | 1914530 | 18355.58 | 437 | 426 | 104.3 |
| D | 1 | 52 | 61009 | 580.97 | 437 | 426 | 104.3 |
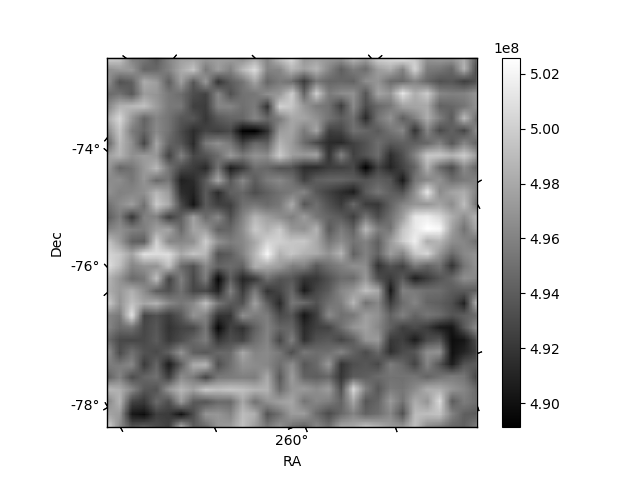
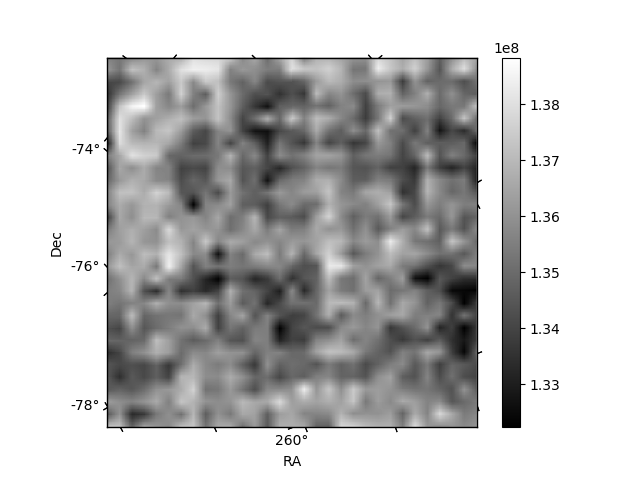
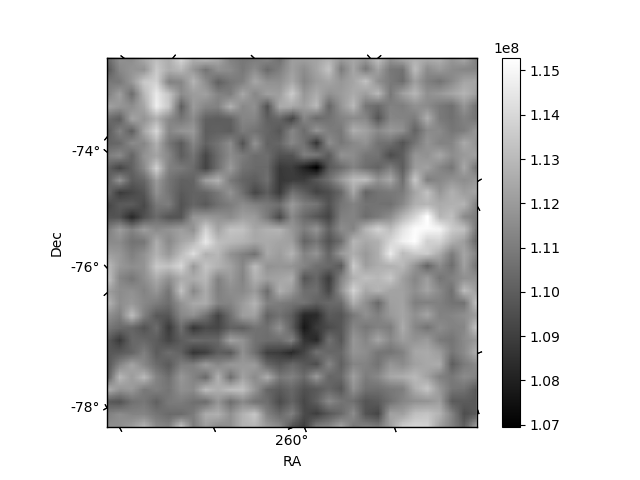
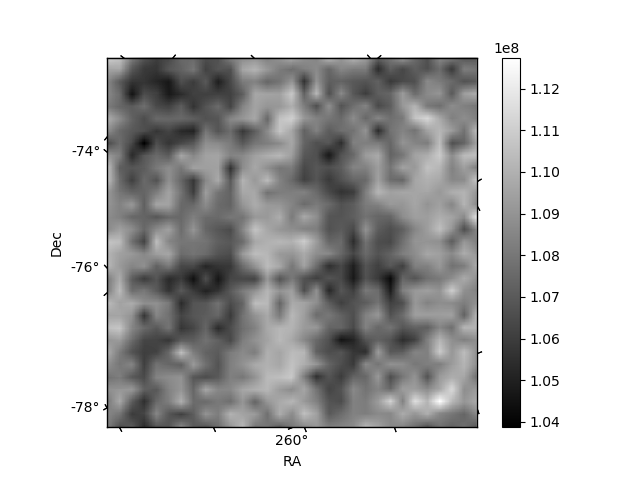
Histogram calculated using DETX and DETY for each event in the final _common_clean file
| Quadrant A |  |
 |
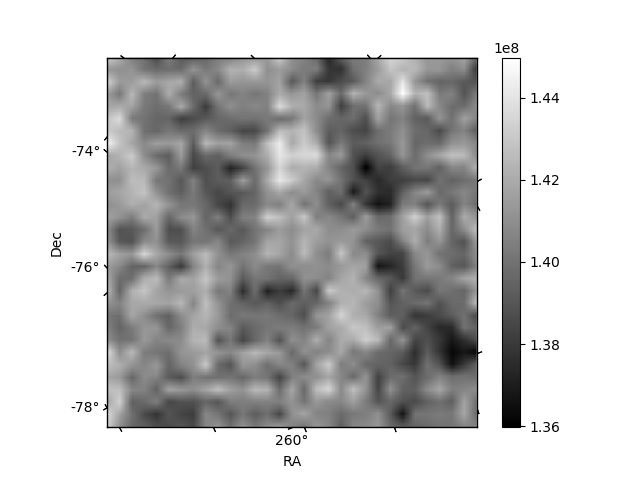
Quadrant B |
|---|---|---|---|
| Quadrant D |  |
 |
Quadrant C |
| Plot type | Count rate plots | Images |
|---|---|---|
| Comparison with Poisson distribution Blue bars denote a histogram of data divided into 1 sec bins. Red curve is a Poisson curve with rate = median count rate of data. |
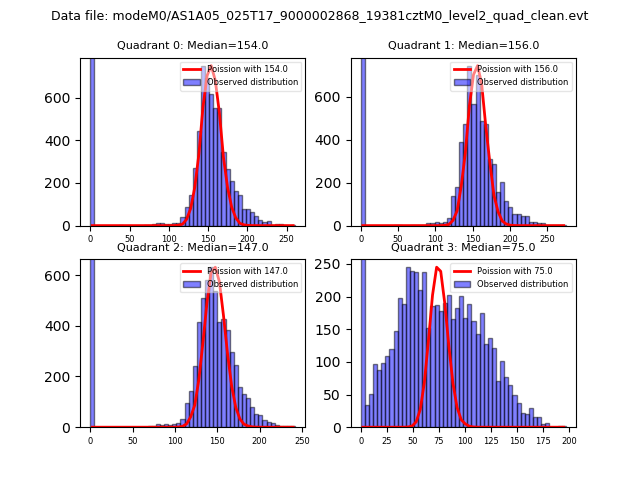 |
 |
| Quadrant-wise count rates Data is divided into 100 sec bins |
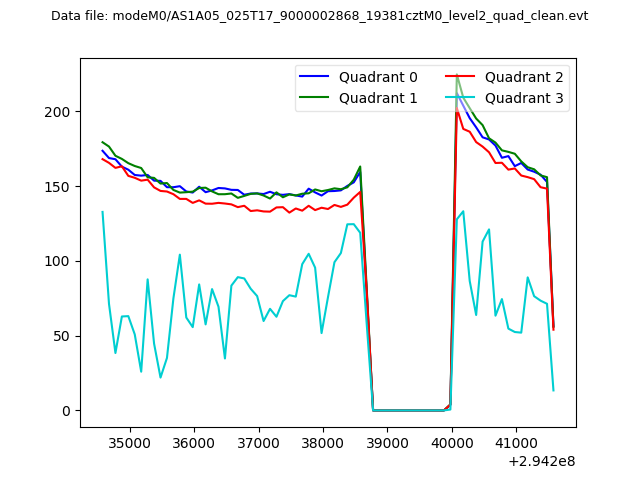 |
|
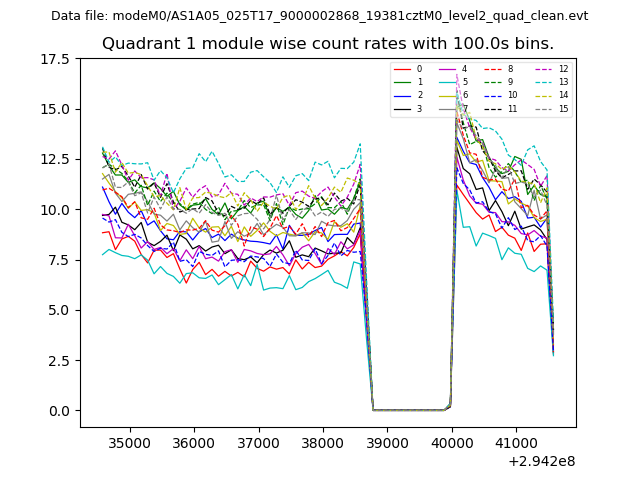
| Module-wise count rates for Quadrant A Data is divided into 100 sec bins |
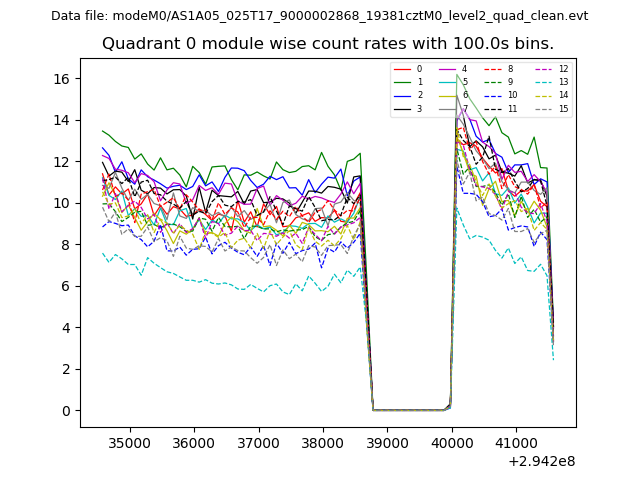 |
 |
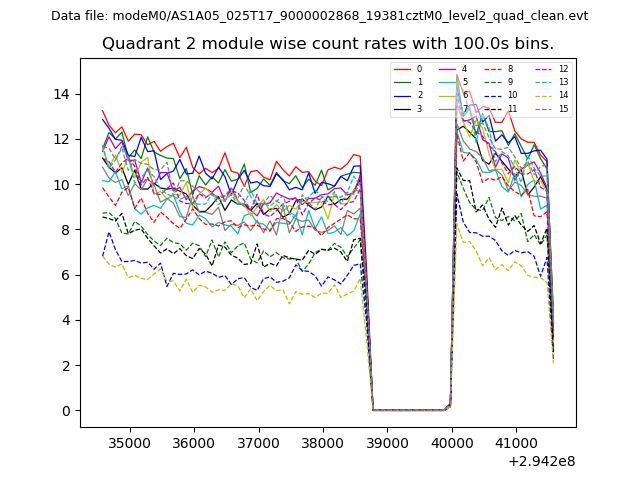
| Module-wise count rates for Quadrant B Data is divided into 100 sec bins |
 |
 |
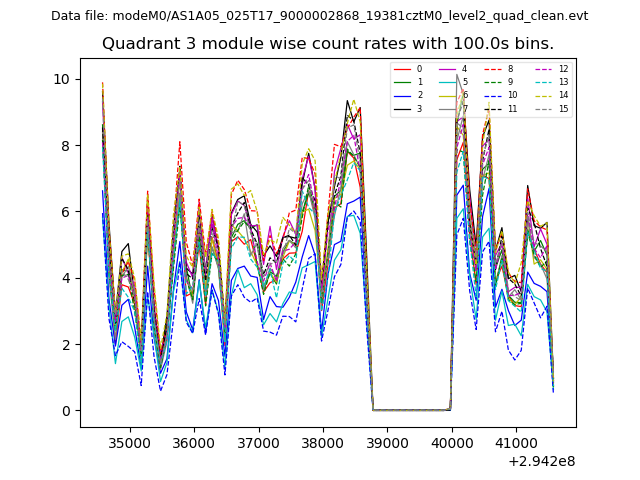
| Module-wise count rates for Quadrant C Data is divided into 100 sec bins |
 |
 |
| Module-wise count rates for Quadrant D Data is divided into 100 sec bins |
 |
 |
| Parameter | Plot |
|---|---|
| CZT HV Monitor | 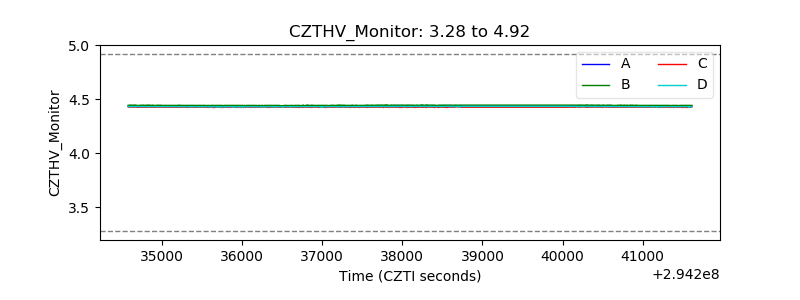 |
| D_VDD | 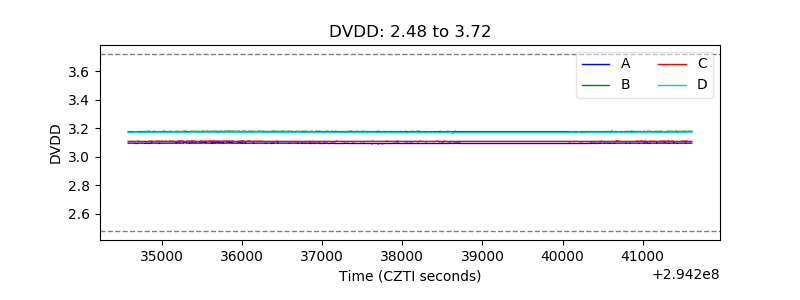 |
| Temperature 1 | 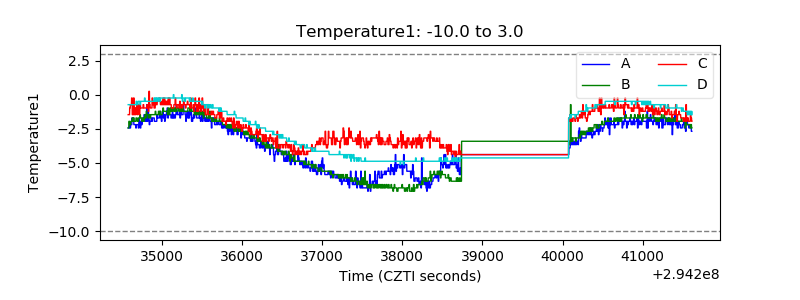 |
| Veto HV Monitor | 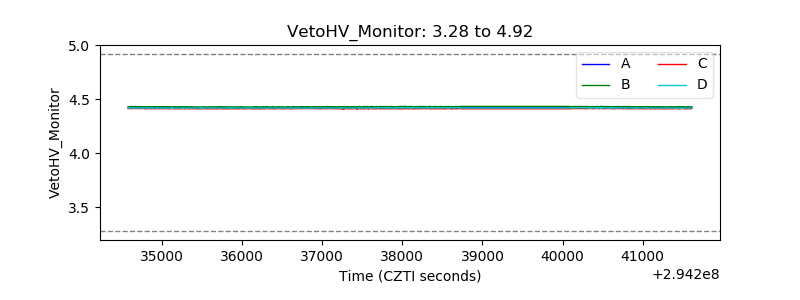 |
| Veto LLD | 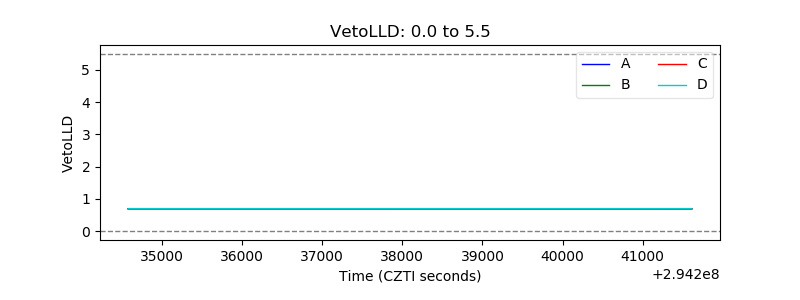 |
| Alpha Counter | 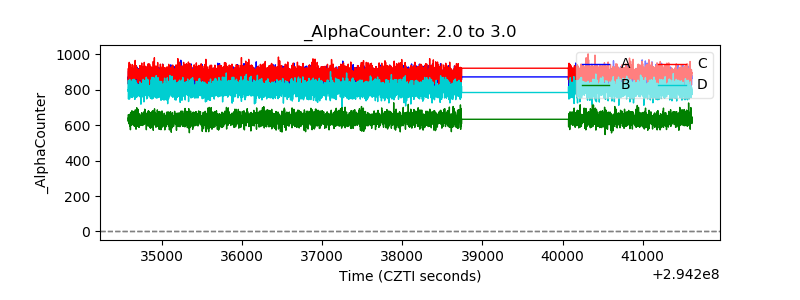 |
| _CPM_Rate | 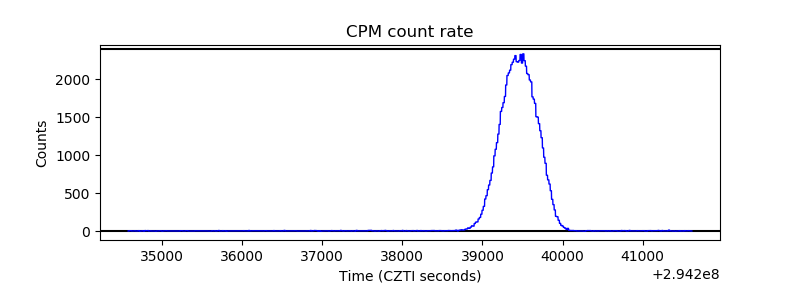 |
| CZT Counter | 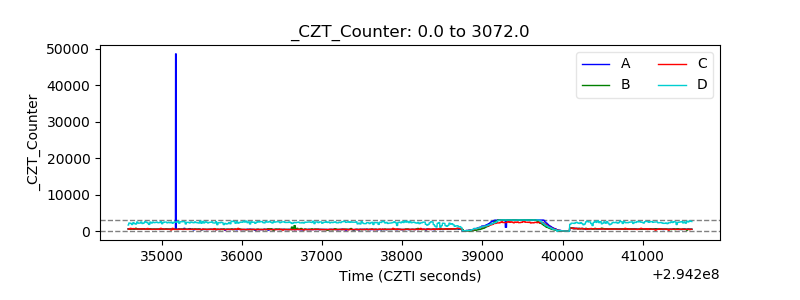 |
| +2.5 Volts monitor |  |
| +5 Volts monitor |  |
| _ROLL_ROT | 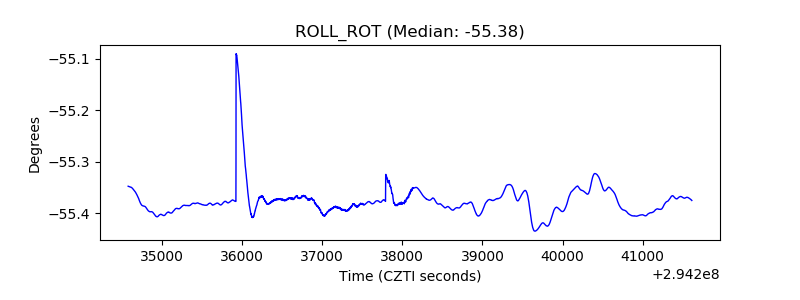 |
| _Roll_DEC | 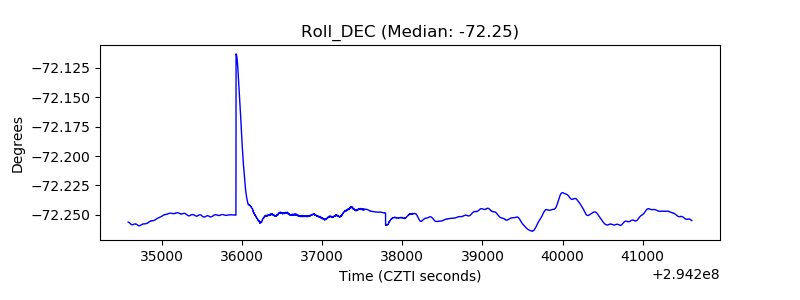 |
| _Roll_RA | 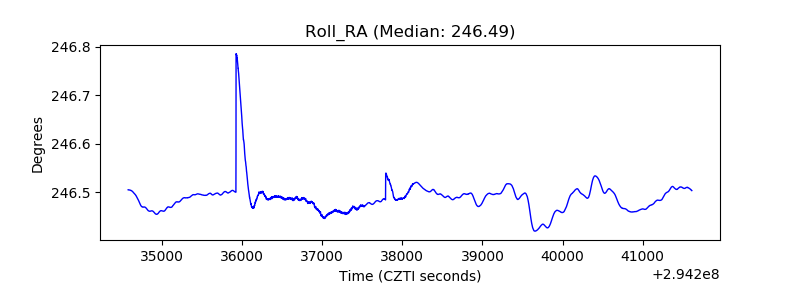 |
| Veto Counter | 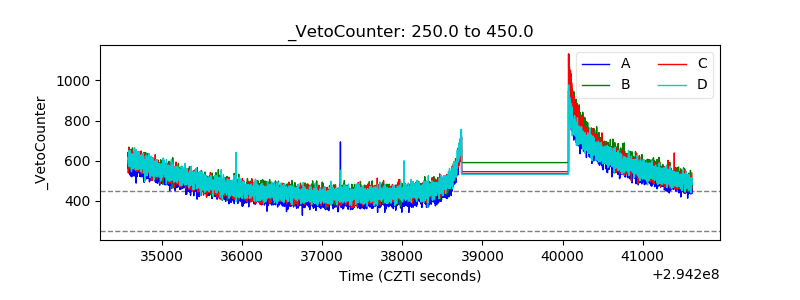 |