| Param | Original file | Final file |
|---|---|---|
| Filename | modeM0/AS1A05_025T17_9000002868_19382cztM0_level2.evt | modeM0/AS1A05_025T17_9000002868_19382cztM0_level2_quad_clean.evt |
| Size (bytes) | 760,746,240 | 124,182,720 |
| Size | 725.5 MB | 118.4 MB |
| Events in quadrant A | 3,234,706 | 940,916 |
| Events in quadrant B | 3,212,861 | 949,598 |
| Events in quadrant C | 3,088,810 | 889,237 |
| Events in quadrant D | 13,089,446 | 553,084 |
| Mode M0 | |||
|---|---|---|---|
| Quadrant | BADHDUFLAG | Total packets | Discarded packets |
| A | 0 | 13426 | 1 |
| B | 0 | 13324 | 1 |
| C | 0 | 12965 | 1 |
| D | 0 | 43047 | 1 |
| Mode SS | |||
|---|---|---|---|
| Quadrant | BADHDUFLAG | Total packets | Discarded packets |
| A | 0 | 124 | 0 |
| B | 0 | 124 | 0 |
| C | 0 | 124 | 0 |
| D | 0 | 124 | 0 |
| Mode M9 | |||
|---|---|---|---|
| Quadrant | BADHDUFLAG | Total packets | Discarded packets |
| A | 0 | 13 | 0 |
| B | 0 | 13 | 0 |
| C | 0 | 13 | 0 |
| D | 0 | 13 | 0 |
| Quadrant | Total seconds | Saturated seconds | Saturation percentage |
|---|---|---|---|
| A | 6102 | 137 | 2.245166% |
| B | 6103 | 137 | 2.244798% |
| C | 6103 | 157 | 2.572505% |
| D | 6103 | 4542 | 74.422415% |
Noise dominated data is calculated using 1-second bins in cleaned event files. If a bin has >2000 counts, and if more than 50% of those come from <1% of pixels, then it is considered to be noise-dominated and hence unusable.
| Quadrant | # 1 sec bins | Bins with >0 counts | Bins with >2000 counts | High rate bins dominated by noise | Noise dominated (total time) | Noise dominated (detector-on time) | Marked lightcurve |
|---|---|---|---|---|---|---|---|
| A | 7392 | 6102 | 16 | 16 | 0.22% | 0.26% | 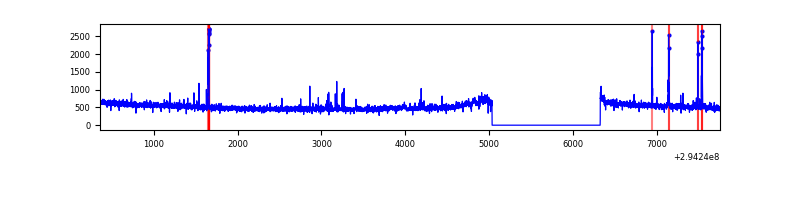 |
| B | 7393 | 6103 | 7 | 7 | 0.09% | 0.11% | 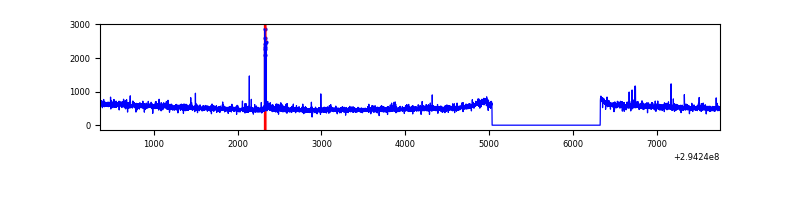 |
| C | 7393 | 6103 | 0 | 0 | 0.00% | 0.00% | 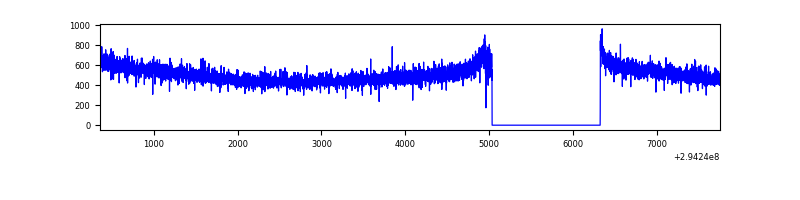 |
| D | 7393 | 6103 | 4151 | 4151 | 56.15% | 68.02% | 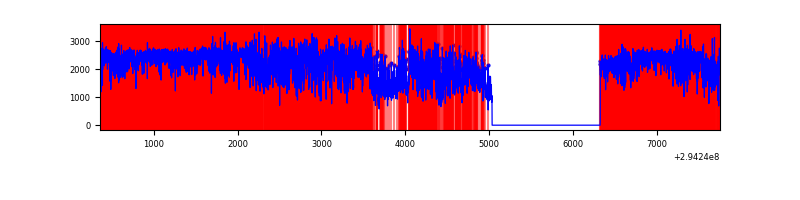 |
Top three noisy pixels from each quadrant. If the there are fewer than three noisy pixels in the level2.evt file, extra rows are filled as -1
| Pixel properties | Quadrant properties | ||||||
|---|---|---|---|---|---|---|---|
| Quadrant | DetID | PixID | Counts | Sigma | Mean | Median | Sigma |
| A | 5 | 16 | 96254 | 598.08 | 808 | 793 | 159.6 |
| A | 15 | 174 | 23839 | 144.39 | 808 | 793 | 159.6 |
| A | 0 | 226 | 7069 | 39.32 | 808 | 793 | 159.6 |
| B | 7 | 220 | 26124 | 173.31 | 802 | 785 | 146.2 |
| B | 12 | 111 | 16224 | 105.6 | 802 | 785 | 146.2 |
| B | 11 | 111 | 14003 | 90.41 | 802 | 785 | 146.2 |
| C | 14 | 238 | 122068 | 702.0 | 758 | 763 | 172.8 |
| C | 3 | 233 | 10062 | 53.81 | 758 | 763 | 172.8 |
| C | 13 | 61 | 5559 | 27.75 | 758 | 763 | 172.8 |
| D | 10 | 66 | 8143696 | 64104.03 | 534 | 518 | 127.0 |
| D | 7 | 238 | 2551454 | 20081.26 | 534 | 518 | 127.0 |
| D | 1 | 52 | 326779 | 2568.36 | 534 | 518 | 127.0 |
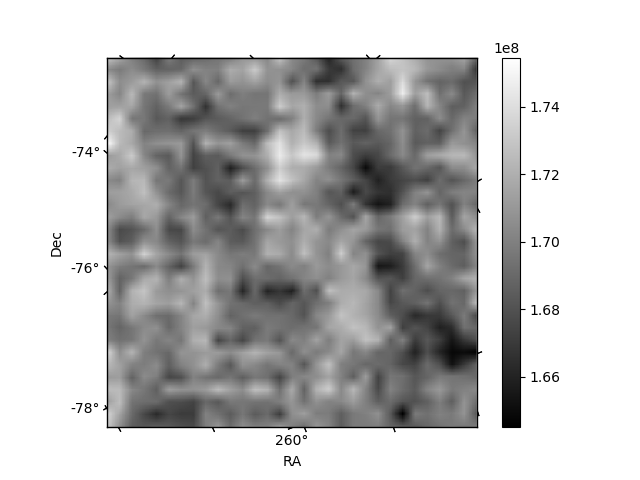
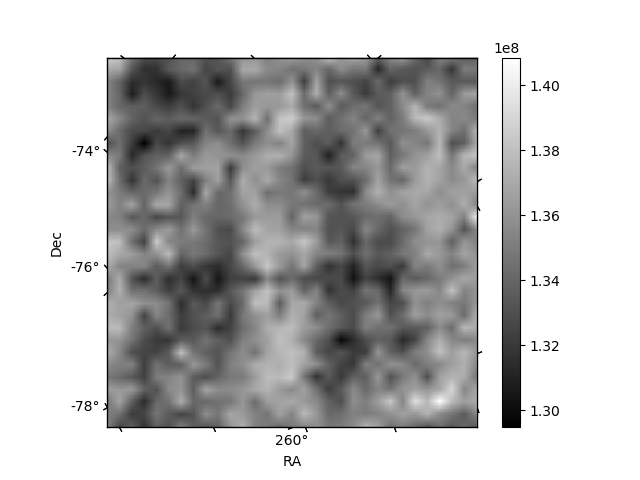
Histogram calculated using DETX and DETY for each event in the final _common_clean file
| Quadrant A | 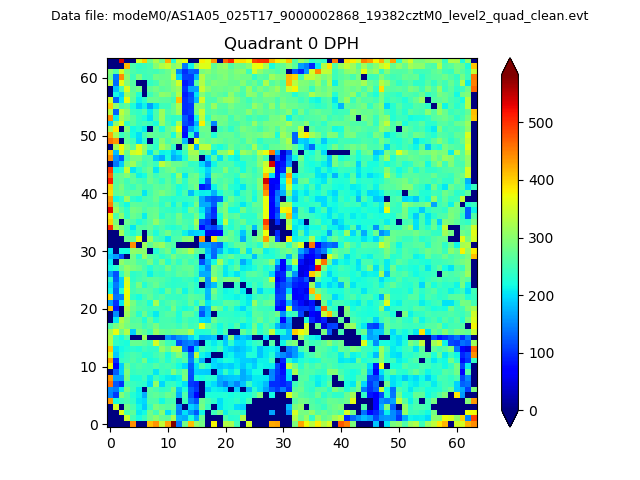 |
 |
Quadrant B |
|---|---|---|---|
| Quadrant D | 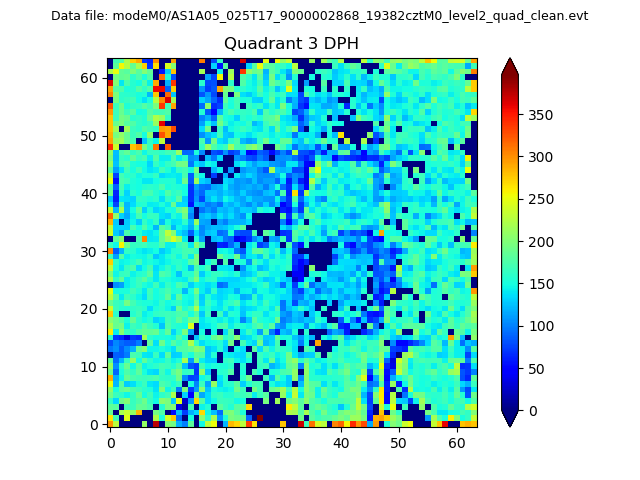 |
 |
Quadrant C |
| Plot type | Count rate plots | Images |
|---|---|---|
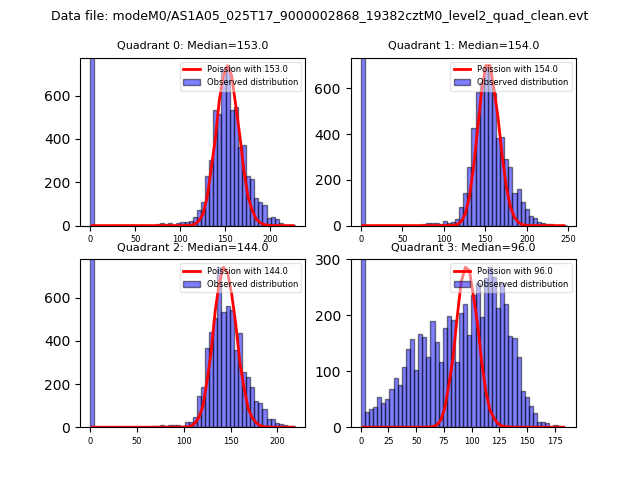
| Comparison with Poisson distribution Blue bars denote a histogram of data divided into 1 sec bins. Red curve is a Poisson curve with rate = median count rate of data. |
 |
 |
| Quadrant-wise count rates Data is divided into 100 sec bins |
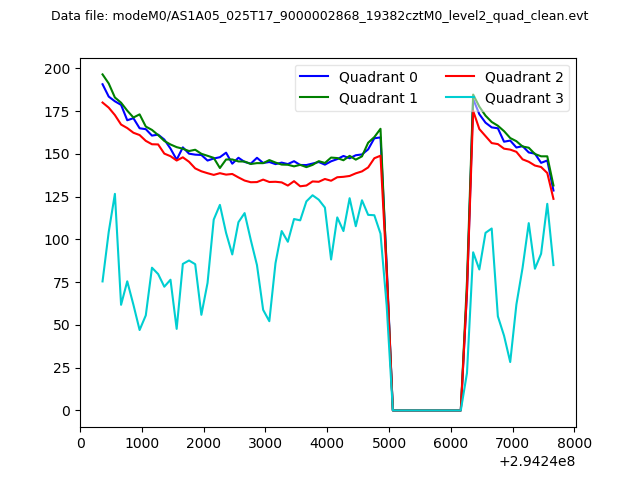 |
|
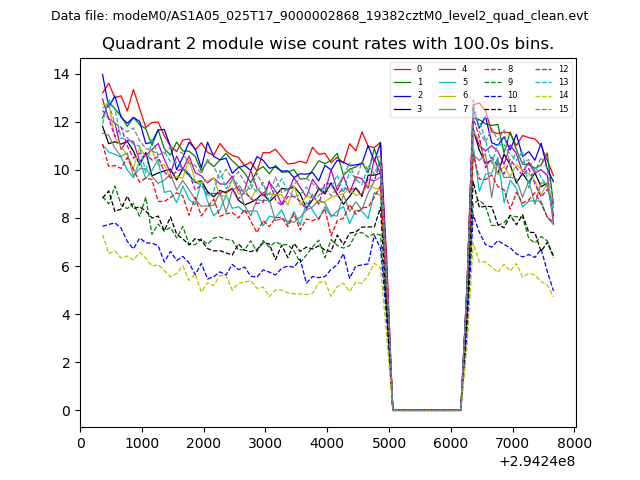
| Module-wise count rates for Quadrant A Data is divided into 100 sec bins |
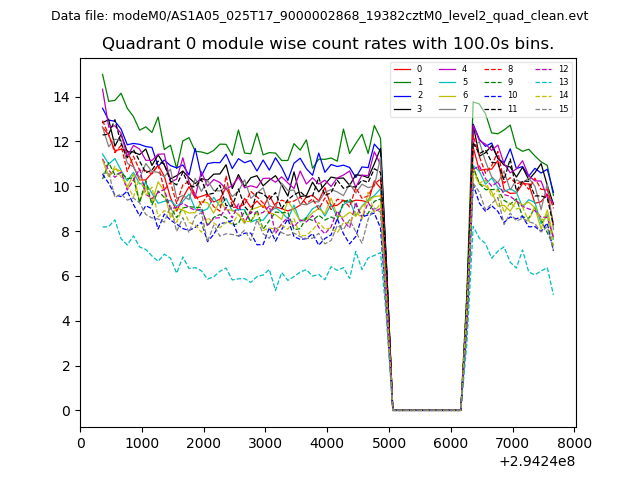 |
 |
| Module-wise count rates for Quadrant B Data is divided into 100 sec bins |
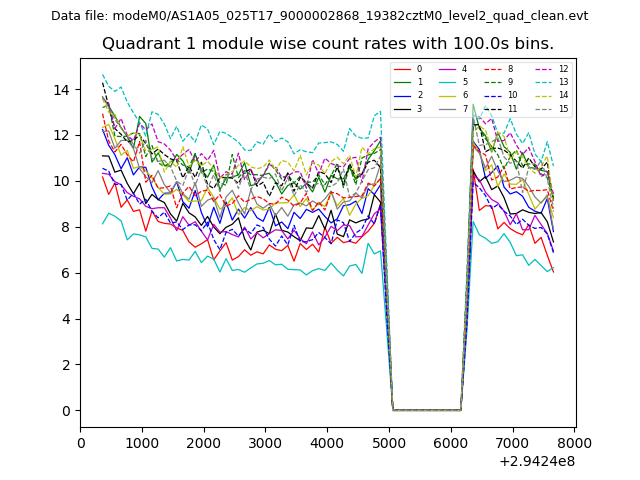 |
 |
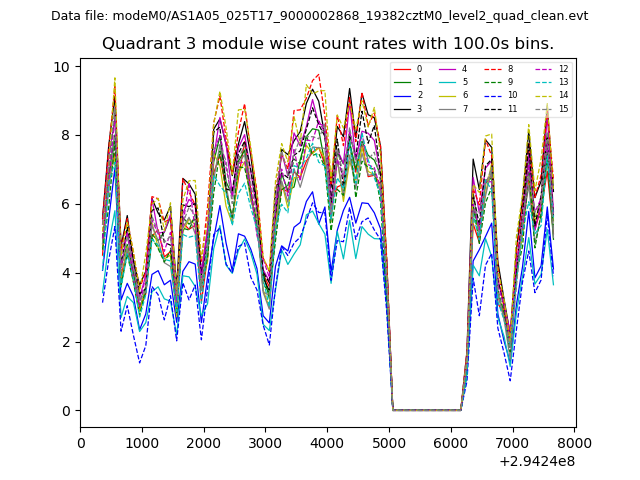
| Module-wise count rates for Quadrant C Data is divided into 100 sec bins |
 |
 |
| Module-wise count rates for Quadrant D Data is divided into 100 sec bins |
 |
 |
| Parameter | Plot |
|---|---|
| CZT HV Monitor | 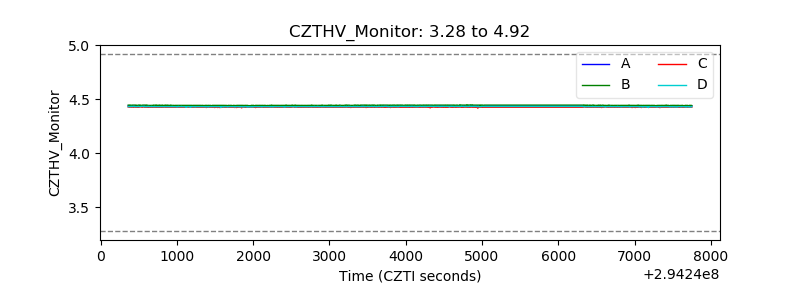 |
| D_VDD | 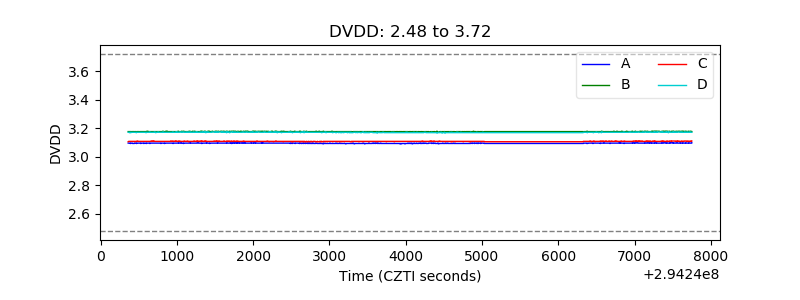 |
| Temperature 1 | 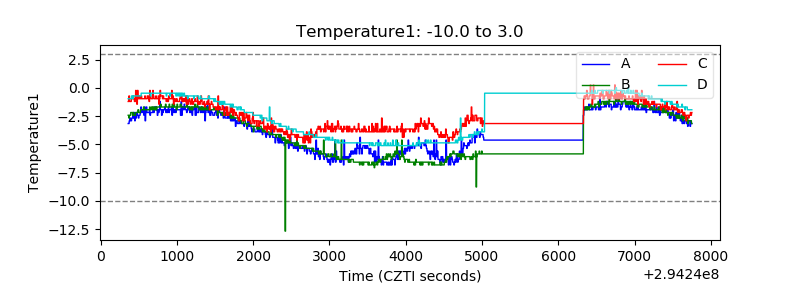 |
| Veto HV Monitor | 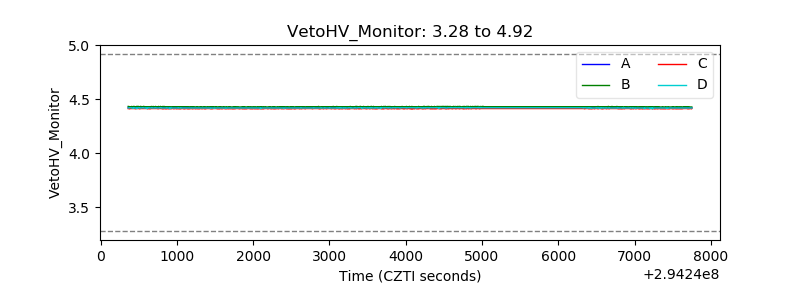 |
| Veto LLD | 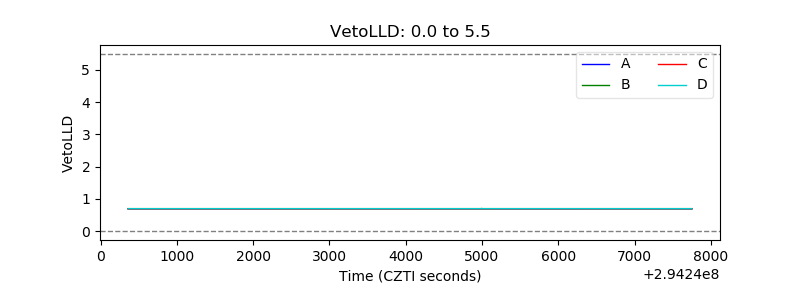 |
| Alpha Counter | 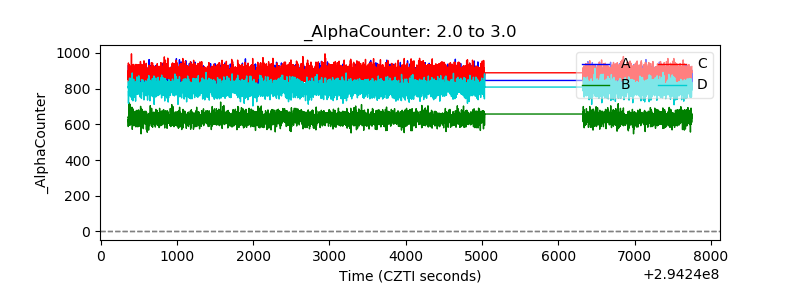 |
| _CPM_Rate | 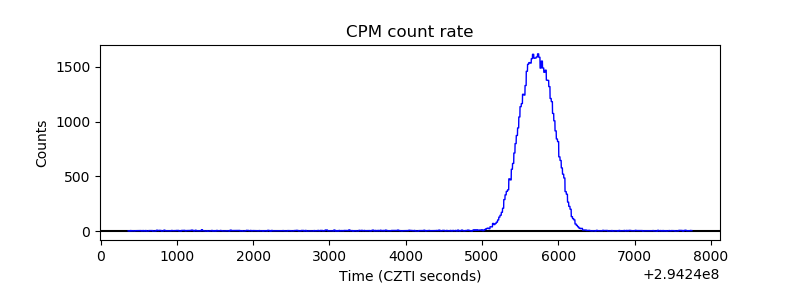 |
| CZT Counter | 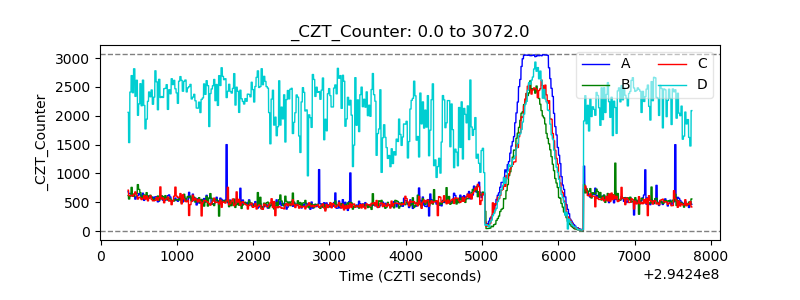 |
| +2.5 Volts monitor |  |
| +5 Volts monitor |  |
| _ROLL_ROT | 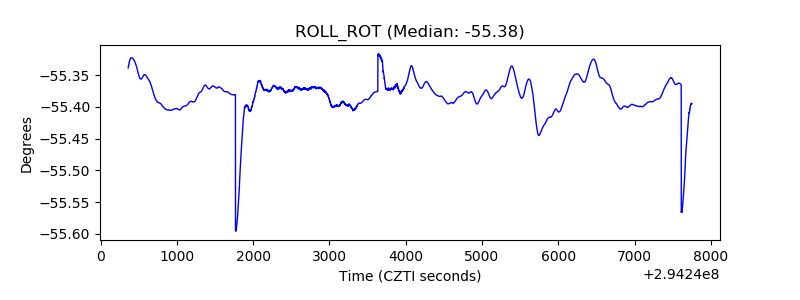 |
| _Roll_DEC | 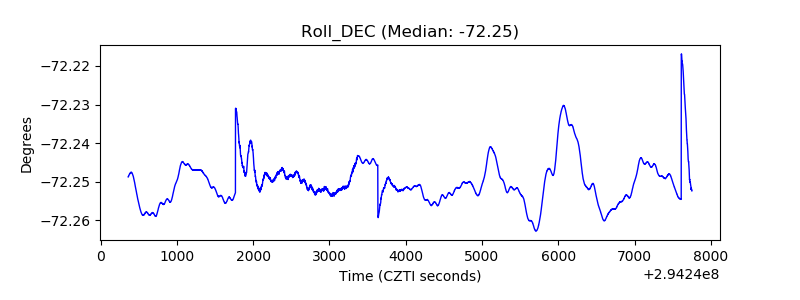 |
| _Roll_RA | 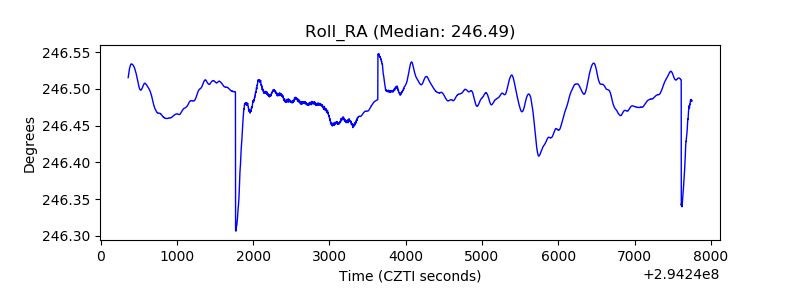 |
| Veto Counter | 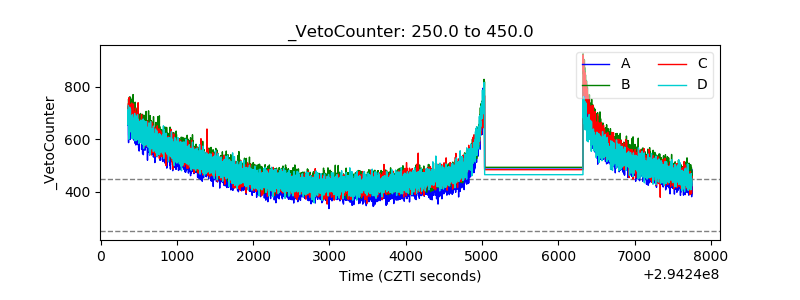 |