| Param | Original file | Final file |
|---|---|---|
| Filename | modeM0/AS1A05_025T17_9000002868_19383cztM0_level2.evt | modeM0/AS1A05_025T17_9000002868_19383cztM0_level2_quad_clean.evt |
| Size (bytes) | 260,536,320 | 45,221,760 |
| Size | 248.5 MB | 43.1 MB |
| Events in quadrant A | 1,127,759 | 330,375 |
| Events in quadrant B | 1,167,837 | 332,202 |
| Events in quadrant C | 1,048,128 | 313,883 |
| Events in quadrant D | 4,389,444 | 227,116 |
| Mode M0 | |||
|---|---|---|---|
| Quadrant | BADHDUFLAG | Total packets | Discarded packets |
| A | 0 | 4795 | 0 |
| B | 0 | 4855 | 0 |
| C | 0 | 4612 | 0 |
| D | 0 | 14637 | 0 |
| Mode SS | |||
|---|---|---|---|
| Quadrant | BADHDUFLAG | Total packets | Discarded packets |
| A | 0 | 46 | 0 |
| B | 0 | 46 | 0 |
| C | 0 | 46 | 0 |
| D | 0 | 46 | 0 |
| Quadrant | Total seconds | Saturated seconds | Saturation percentage |
|---|---|---|---|
| A | 2287 | 15 | 0.655881% |
| B | 2288 | 10 | 0.437063% |
| C | 2288 | 5 | 0.218531% |
| D | 2288 | 1191 | 52.054196% |
Noise dominated data is calculated using 1-second bins in cleaned event files. If a bin has >2000 counts, and if more than 50% of those come from <1% of pixels, then it is considered to be noise-dominated and hence unusable.
| Quadrant | # 1 sec bins | Bins with >0 counts | Bins with >2000 counts | High rate bins dominated by noise | Noise dominated (total time) | Noise dominated (detector-on time) | Marked lightcurve |
|---|---|---|---|---|---|---|---|
| A | 2287 | 2287 | 11 | 11 | 0.48% | 0.48% | 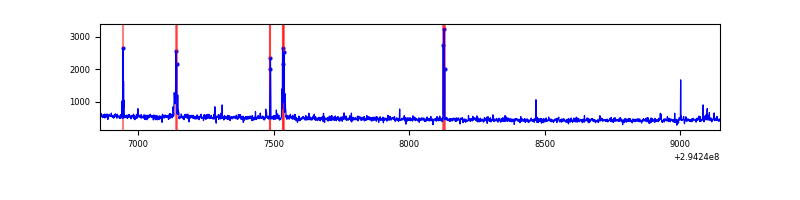 |
| B | 2288 | 2288 | 8 | 8 | 0.35% | 0.35% | 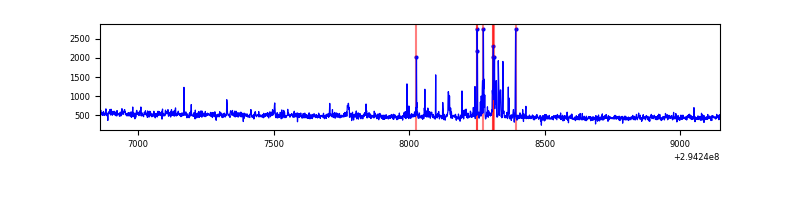 |
| C | 2288 | 2288 | 0 | 0 | 0.00% | 0.00% | 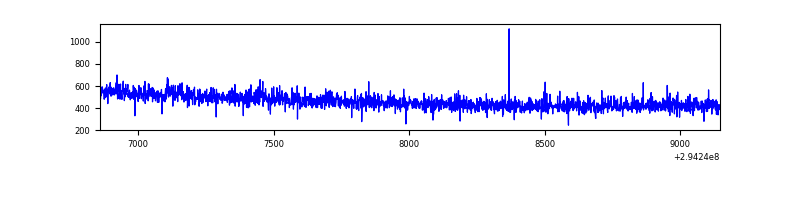 |
| D | 2288 | 2288 | 1223 | 1223 | 53.45% | 53.45% | 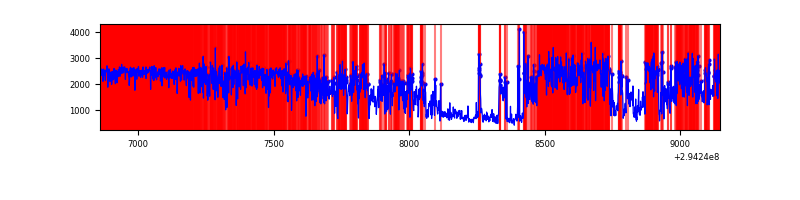 |
Top three noisy pixels from each quadrant. If the there are fewer than three noisy pixels in the level2.evt file, extra rows are filled as -1
| Pixel properties | Quadrant properties | ||||||
|---|---|---|---|---|---|---|---|
| Quadrant | DetID | PixID | Counts | Sigma | Mean | Median | Sigma |
| A | 5 | 16 | 58939 | 1035.46 | 277 | 273 | 56.7 |
| A | 13 | 254 | 2951 | 47.27 | 277 | 273 | 56.7 |
| A | 0 | 226 | 2581 | 40.74 | 277 | 273 | 56.7 |
| B | 7 | 220 | 32019 | 601.5 | 276 | 270 | 52.8 |
| B | 0 | 197 | 17012 | 317.18 | 276 | 270 | 52.8 |
| B | 4 | 216 | 16220 | 302.18 | 276 | 270 | 52.8 |
| C | 14 | 238 | 41872 | 690.44 | 256 | 258 | 60.3 |
| C | 3 | 233 | 3624 | 55.85 | 256 | 258 | 60.3 |
| C | 13 | 61 | 1847 | 26.36 | 256 | 258 | 60.3 |
| D | 10 | 66 | 1835237 | 36823.98 | 203 | 196 | 49.8 |
| D | 7 | 238 | 1591370 | 31930.27 | 203 | 196 | 49.8 |
| D | 1 | 52 | 161679 | 3240.5 | 203 | 196 | 49.8 |
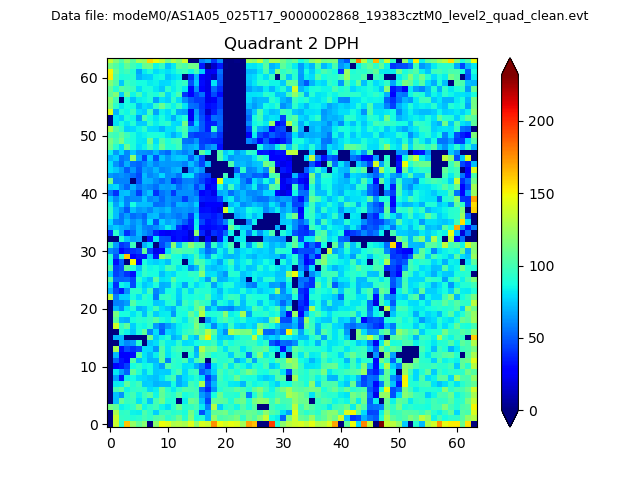
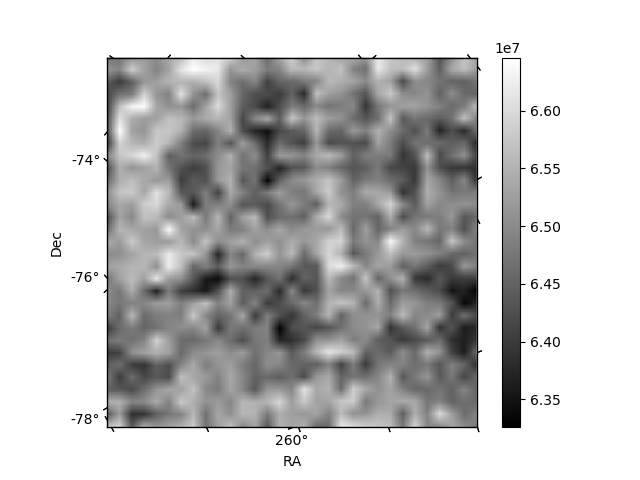
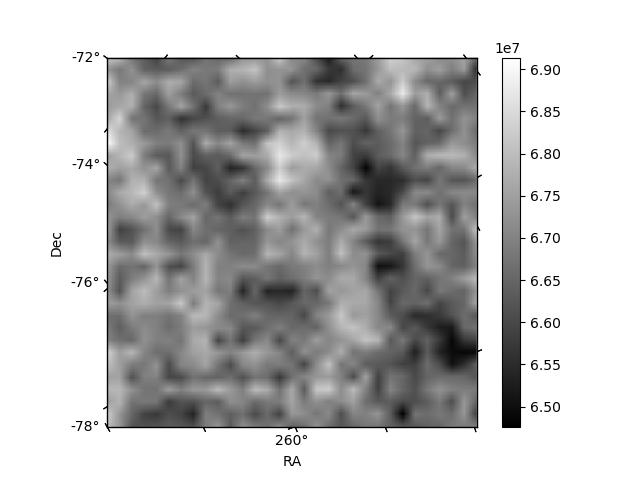
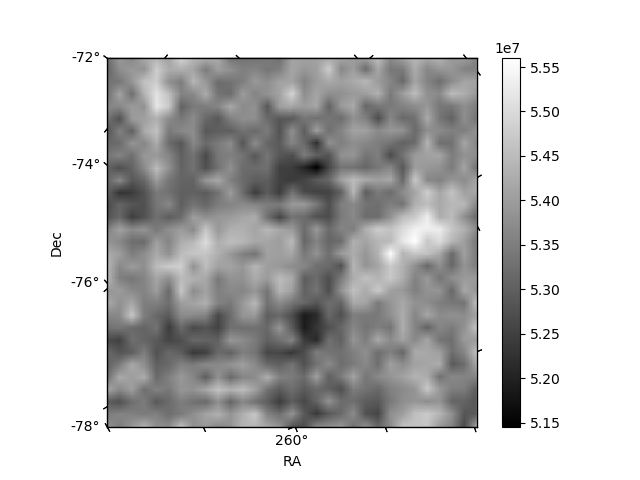
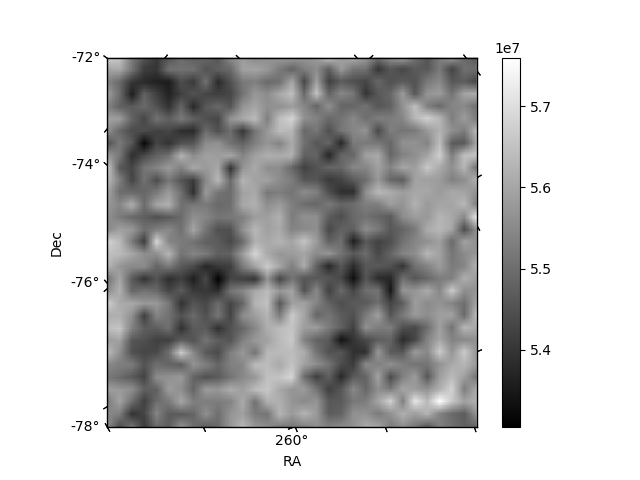
Histogram calculated using DETX and DETY for each event in the final _common_clean file
| Quadrant A | 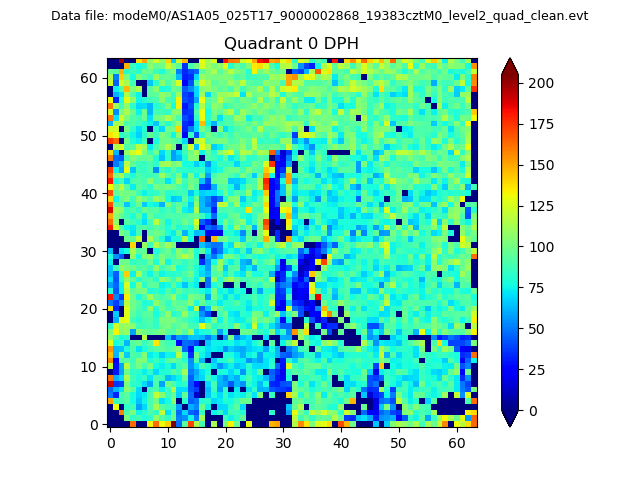 |
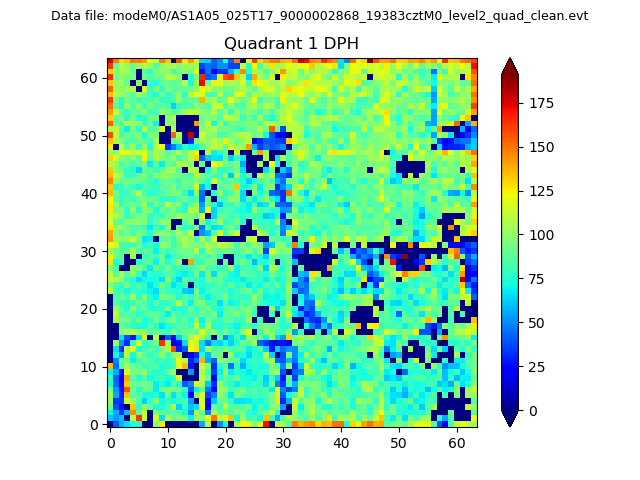 |
Quadrant B |
|---|---|---|---|
| Quadrant D | 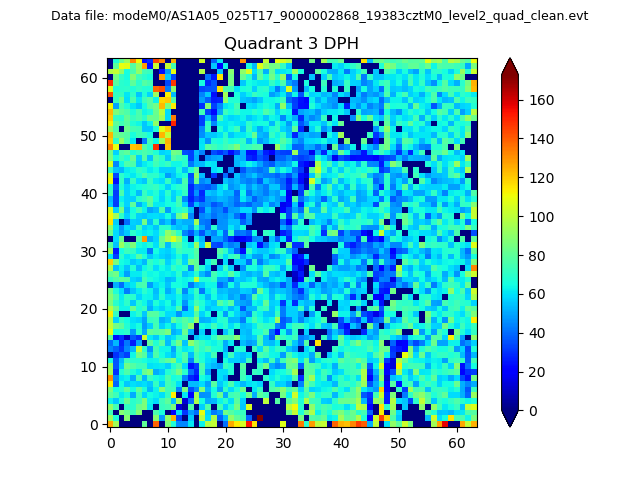 |
 |
Quadrant C |
| Plot type | Count rate plots | Images |
|---|---|---|
| Comparison with Poisson distribution Blue bars denote a histogram of data divided into 1 sec bins. Red curve is a Poisson curve with rate = median count rate of data. |
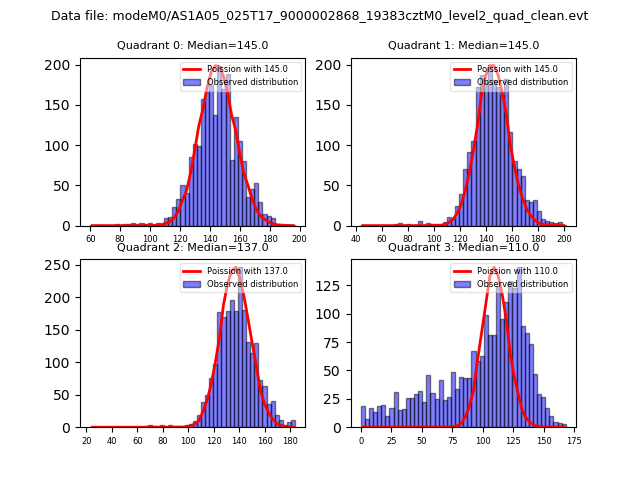 |
 |
| Quadrant-wise count rates Data is divided into 100 sec bins |
 |
|
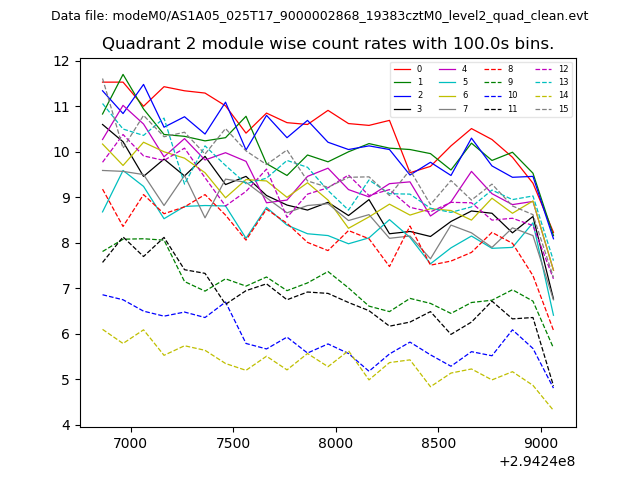
| Module-wise count rates for Quadrant A Data is divided into 100 sec bins |
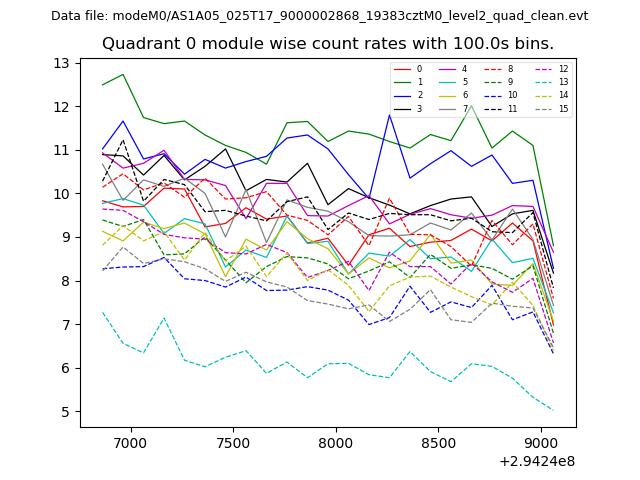 |
 |
| Module-wise count rates for Quadrant B Data is divided into 100 sec bins |
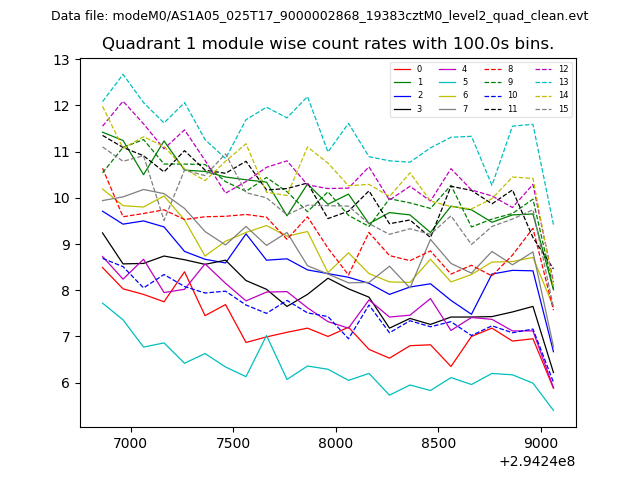 |
 |
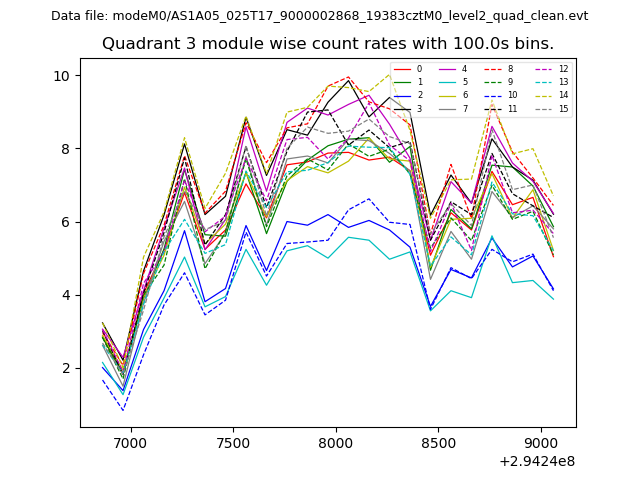
| Module-wise count rates for Quadrant C Data is divided into 100 sec bins |
 |
 |
| Module-wise count rates for Quadrant D Data is divided into 100 sec bins |
 |
 |
| Parameter | Plot |
|---|---|
| CZT HV Monitor | 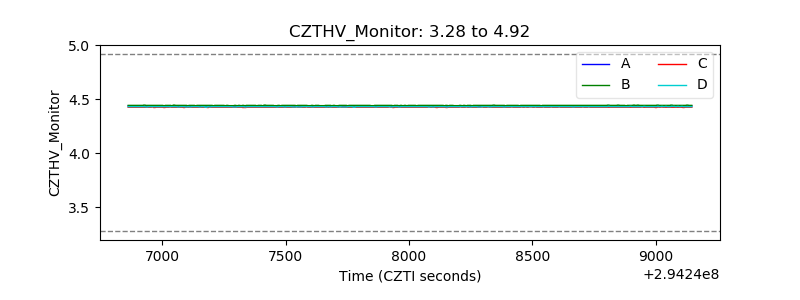 |
| D_VDD | 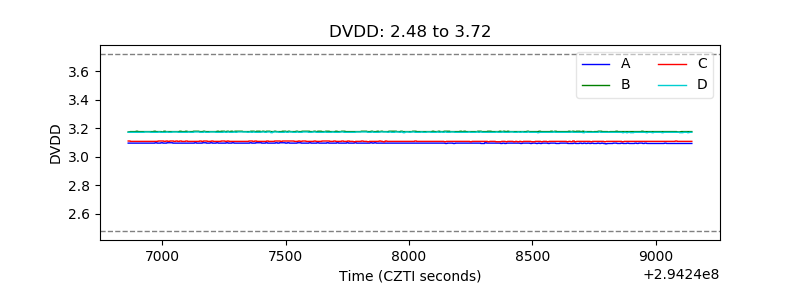 |
| Temperature 1 | 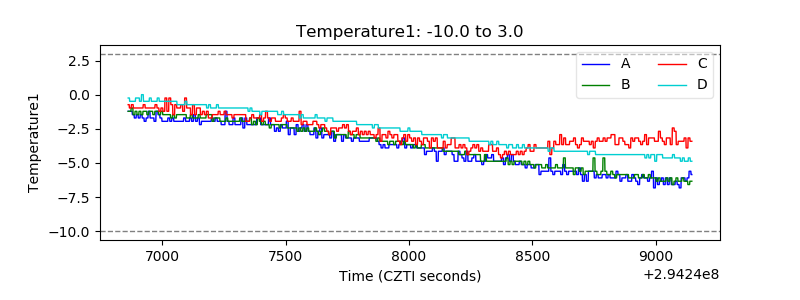 |
| Veto HV Monitor | 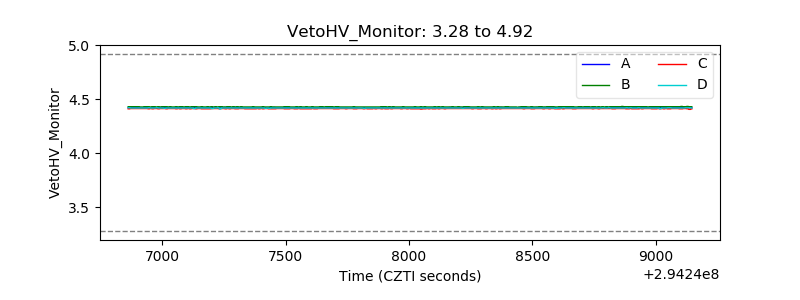 |
| Veto LLD | 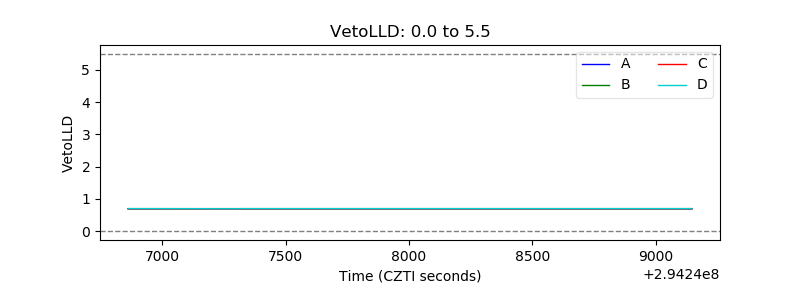 |
| Alpha Counter | 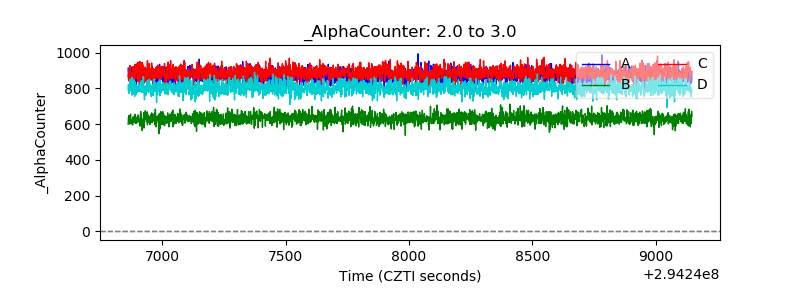 |
| _CPM_Rate | 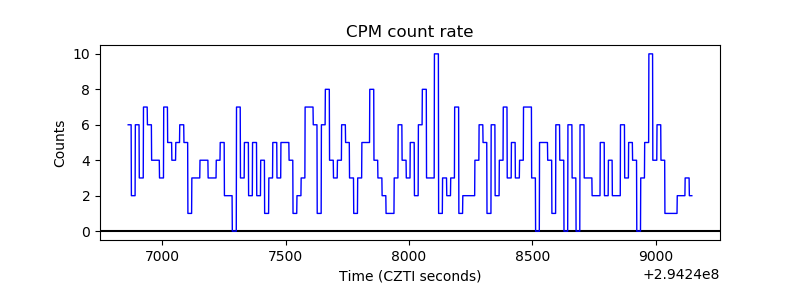 |
| CZT Counter | 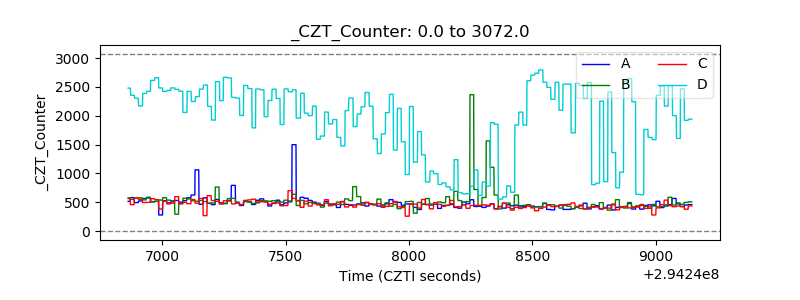 |
| +2.5 Volts monitor |  |
| +5 Volts monitor |  |
| _ROLL_ROT | 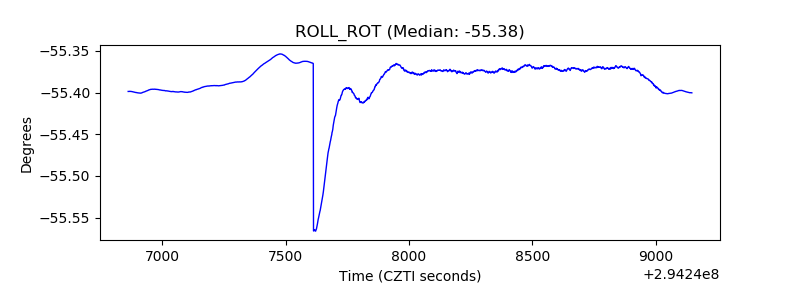 |
| _Roll_DEC | 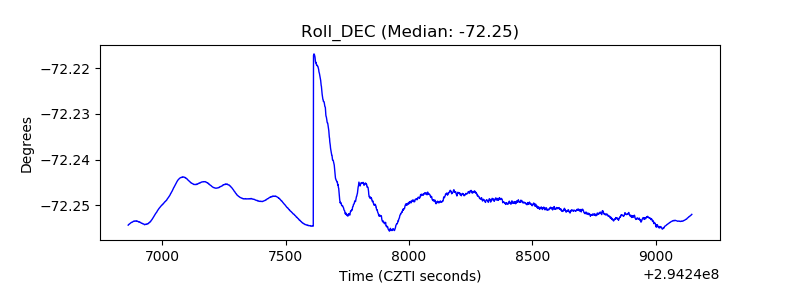 |
| _Roll_RA | 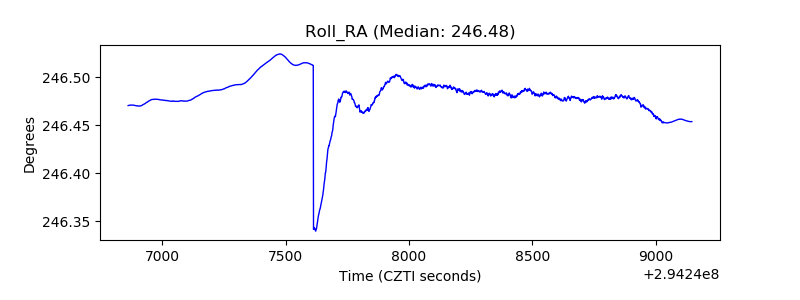 |
| Veto Counter | 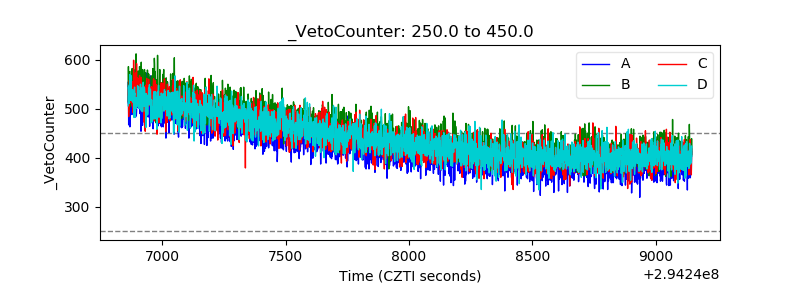 |