| Param | Original file | Final file |
|---|---|---|
| Filename | modeM0/AS1A05_104T05_9000002870cztM0_level2.fits | modeM0/AS1A05_104T05_9000002870cztM0_level2_quad_clean.evt |
| Size (bytes) | 132,261,120 | 134,821,440 |
| Size | 126.1 MB | 128.6 MB |
| Events in quadrant A | 855,838 | 885,072 |
| Events in quadrant B | 827,368 | 887,573 |
| Events in quadrant C | 837,610 | 857,861 |
| Events in quadrant D | 513,594 | 483,934 |
| Mode M9 | |||
|---|---|---|---|
| Quadrant | BADHDUFLAG | Total packets | Discarded packets |
| A | 0 | 24 | 0 |
| B | 0 | 24 | 0 |
| C | 0 | 24 | 0 |
| D | 0 | 24 | 0 |
| Mode SS | |||
|---|---|---|---|
| Quadrant | BADHDUFLAG | Total packets | Discarded packets |
| A | 0 | 286 | 0 |
| B | 0 | 286 | 0 |
| C | 0 | 286 | 0 |
| D | 0 | 286 | 0 |
| Mode M0 | |||
|---|---|---|---|
| Quadrant | BADHDUFLAG | Total packets | Discarded packets |
| A | 0 | 29454 | 0 |
| B | 0 | 29458 | 0 |
| C | 0 | 29258 | 0 |
| D | 0 | 93530 | 0 |
| Quadrant | Total seconds | Saturated seconds | Saturation percentage |
|---|---|---|---|
| A | 14010 | 170 | 1.213419% |
| B | 14010 | 221 | 1.577445% |
| C | 14010 | 301 | 2.148465% |
| D | 14010 | 8274 | 59.057816% |
Noise dominated data is calculated using 1-second bins in cleaned event files. If a bin has >2000 counts, and if more than 50% of those come from <1% of pixels, then it is considered to be noise-dominated and hence unusable.
| Quadrant | # 1 sec bins | Bins with >0 counts | Bins with >2000 counts | High rate bins dominated by noise | Noise dominated (total time) | Noise dominated (detector-on time) | Marked lightcurve |
|---|---|---|---|---|---|---|---|
| A | 16415 | 14009 | 0 | 0 | 0.00% | 0.00% |  |
| B | 16415 | 14008 | 0 | 0 | 0.00% | 0.00% |  |
| C | 16415 | 14008 | 0 | 0 | 0.00% | 0.00% | 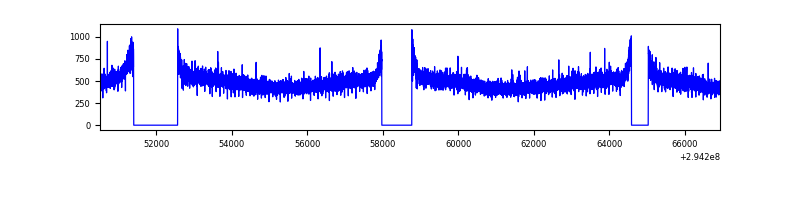 |
| D | 16415 | 13900 | 0 | 0 | 0.00% | 0.00% |  |
Top three noisy pixels from each quadrant. If the there are fewer than three noisy pixels in the level2.evt file, extra rows are filled as -1
| Pixel properties | Quadrant properties | ||||||
|---|---|---|---|---|---|---|---|
| Quadrant | DetID | PixID | Counts | Sigma | Mean | Median | Sigma |
| A | 0 | 29 | 878 | 11.69 | 223 | 210 | 57.1 |
| A | 0 | 30 | 701 | 8.59 | 223 | 210 | 57.1 |
| A | 9 | 19 | 676 | 8.15 | 223 | 210 | 57.1 |
| B | 2 | 9 | 699 | 10.66 | 218 | 208 | 46.1 |
| B | 2 | 8 | 590 | 8.29 | 218 | 208 | 46.1 |
| B | 3 | 17 | 557 | 7.58 | 218 | 208 | 46.1 |
| C | 1 | 81 | 653 | 7.62 | 220 | 206 | 58.7 |
| C | 12 | 241 | 610 | 6.89 | 220 | 206 | 58.7 |
| C | 2 | 191 | 602 | 6.75 | 220 | 206 | 58.7 |
| D | 1 | 31 | 384 | 6.17 | 146 | 132 | 40.8 |
| D | 10 | 190 | 374 | 5.93 | 146 | 132 | 40.8 |
| D | 3 | 159 | 369 | 5.8 | 146 | 132 | 40.8 |
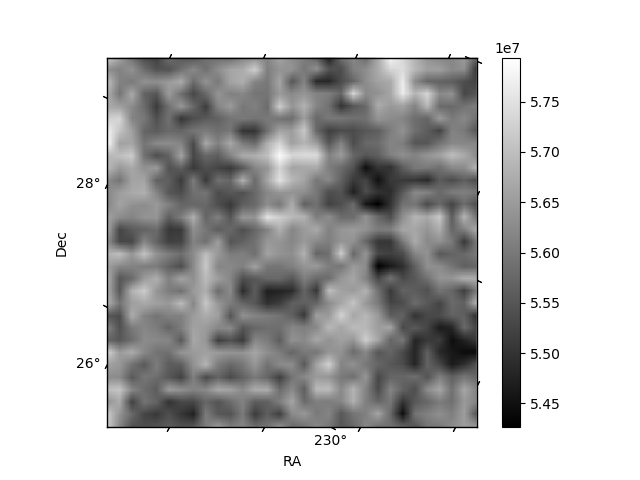
Histogram calculated using DETX and DETY for each event in the final _common_clean file
| Quadrant A | 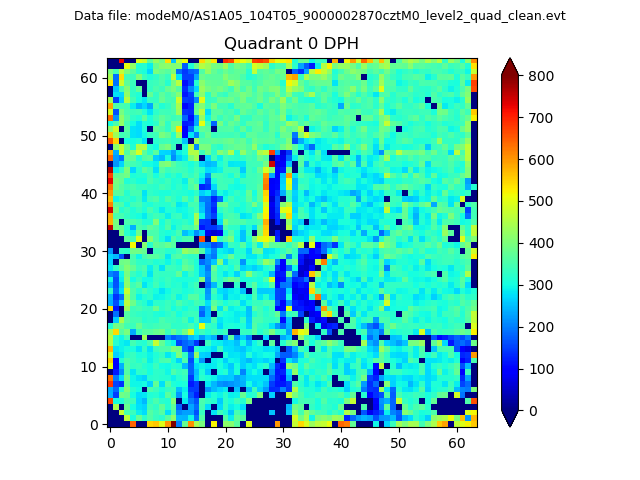 |
 |
Quadrant B |
|---|---|---|---|
| Quadrant D | 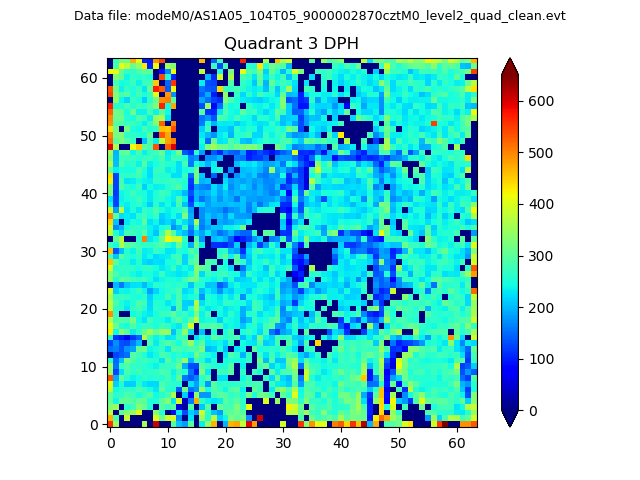 |
 |
Quadrant C |
| Plot type | Count rate plots | Images |
|---|---|---|
| Comparison with Poisson distribution Blue bars denote a histogram of data divided into 1 sec bins. Red curve is a Poisson curve with rate = median count rate of data. |
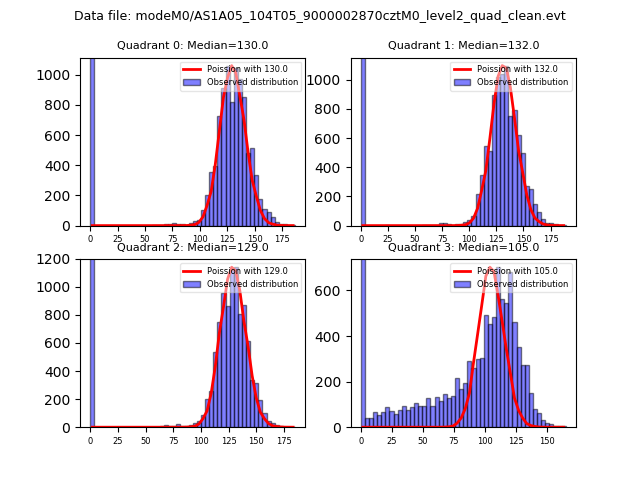 |
 |
| Quadrant-wise count rates Data is divided into 100 sec bins |
 |
|
| Module-wise count rates for Quadrant A Data is divided into 100 sec bins |
 |
 |
| Module-wise count rates for Quadrant B Data is divided into 100 sec bins |
 |
 |
| Module-wise count rates for Quadrant C Data is divided into 100 sec bins |
 |
 |
| Module-wise count rates for Quadrant D Data is divided into 100 sec bins |
 |
 |
| Parameter | Plot |
|---|---|
| CZT HV Monitor |  |
| D_VDD |  |
| Temperature 1 |  |
| Veto HV Monitor | 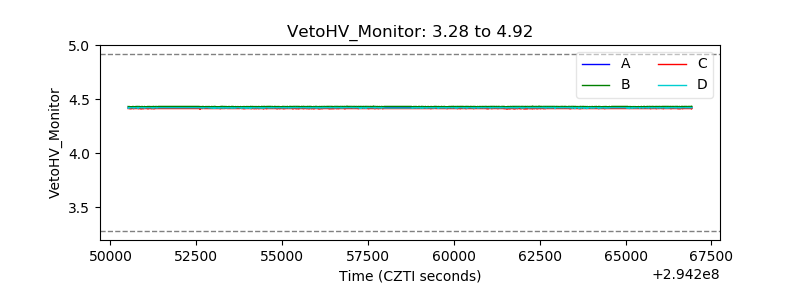 |
| Veto LLD | 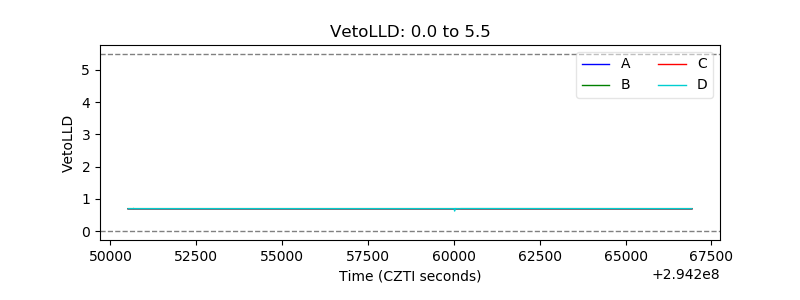 |
| Alpha Counter |  |
| _CPM_Rate |  |
| CZT Counter |  |
| +2.5 Volts monitor |  |
| +5 Volts monitor |  |
| _ROLL_ROT |  |
| _Roll_DEC |  |
| _Roll_RA | 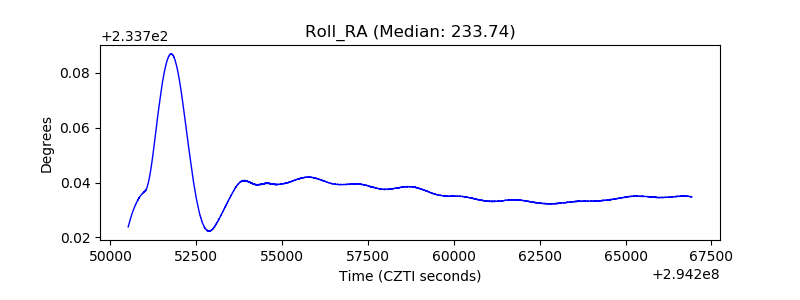 |
| Veto Counter |  |