| Param | Original file | Final file |
|---|---|---|
| Filename | modeM0/AS1A05_104T05_9000002870_19383cztM0_level2.evt | modeM0/AS1A05_104T05_9000002870_19383cztM0_level2_quad_clean.evt |
| Size (bytes) | 278,818,560 | 24,488,640 |
| Size | 265.9 MB | 23.4 MB |
| Events in quadrant A | 1,246,086 | 163,428 |
| Events in quadrant B | 1,263,877 | 166,323 |
| Events in quadrant C | 1,248,247 | 157,436 |
| Events in quadrant D | 4,532,725 | 92,611 |
| Mode M9 | |||
|---|---|---|---|
| Quadrant | BADHDUFLAG | Total packets | Discarded packets |
| A | 0 | 11 | 0 |
| B | 0 | 11 | 0 |
| C | 0 | 11 | 0 |
| D | 0 | 11 | 0 |
| Mode SS | |||
|---|---|---|---|
| Quadrant | BADHDUFLAG | Total packets | Discarded packets |
| A | 0 | 48 | 0 |
| B | 0 | 48 | 0 |
| C | 0 | 48 | 0 |
| D | 0 | 48 | 0 |
| Mode M0 | |||
|---|---|---|---|
| Quadrant | BADHDUFLAG | Total packets | Discarded packets |
| A | 0 | 4981 | 1 |
| B | 0 | 5054 | 1 |
| C | 0 | 4986 | 1 |
| D | 0 | 14997 | 1 |
| Quadrant | Total seconds | Saturated seconds | Saturation percentage |
|---|---|---|---|
| A | 2221 | 93 | 4.187303% |
| B | 2221 | 102 | 4.592526% |
| C | 2221 | 119 | 5.357947% |
| D | 2221 | 1638 | 73.750563% |
Noise dominated data is calculated using 1-second bins in cleaned event files. If a bin has >2000 counts, and if more than 50% of those come from <1% of pixels, then it is considered to be noise-dominated and hence unusable.
| Quadrant | # 1 sec bins | Bins with >0 counts | Bins with >2000 counts | High rate bins dominated by noise | Noise dominated (total time) | Noise dominated (detector-on time) | Marked lightcurve |
|---|---|---|---|---|---|---|---|
| A | 3386 | 2221 | 0 | 0 | 0.00% | 0.00% | 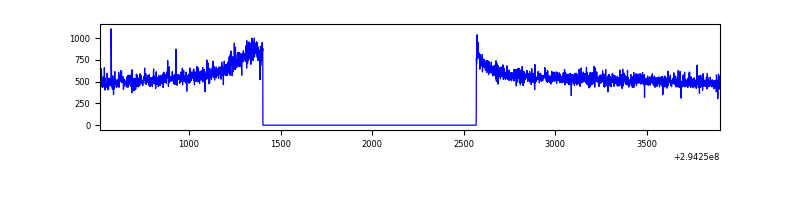 |
| B | 3386 | 2221 | 0 | 0 | 0.00% | 0.00% | 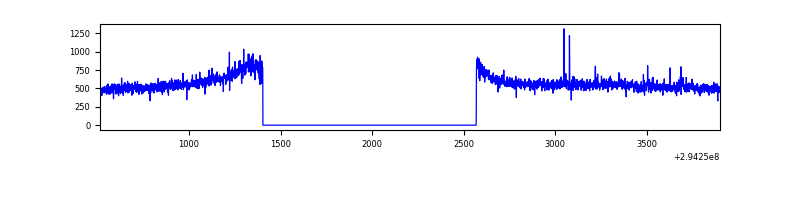 |
| C | 3386 | 2221 | 0 | 0 | 0.00% | 0.00% | 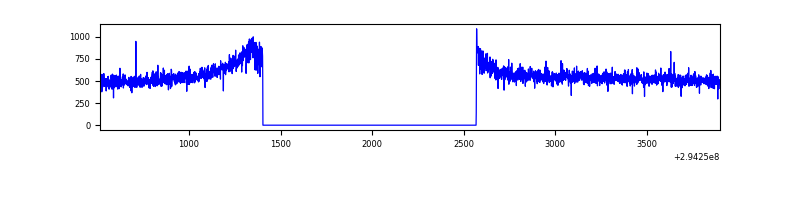 |
| D | 3385 | 2220 | 1284 | 1284 | 37.93% | 57.84% | 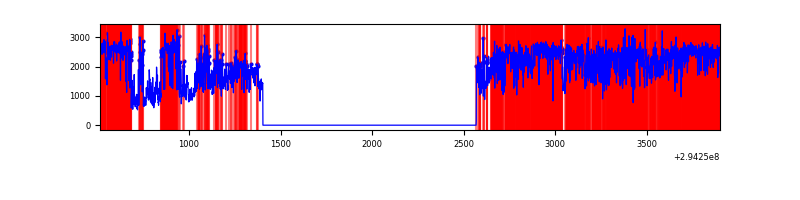 |
Top three noisy pixels from each quadrant. If the there are fewer than three noisy pixels in the level2.evt file, extra rows are filled as -1
| Pixel properties | Quadrant properties | ||||||
|---|---|---|---|---|---|---|---|
| Quadrant | DetID | PixID | Counts | Sigma | Mean | Median | Sigma |
| A | 12 | 96 | 3612 | 49.69 | 321 | 315 | 66.4 |
| A | 0 | 226 | 2806 | 37.54 | 321 | 315 | 66.4 |
| A | 3 | 137 | 2575 | 34.06 | 321 | 315 | 66.4 |
| B | 0 | 198 | 10267 | 156.36 | 318 | 309 | 63.7 |
| B | 12 | 111 | 7705 | 116.13 | 318 | 309 | 63.7 |
| B | 11 | 111 | 6751 | 101.15 | 318 | 309 | 63.7 |
| C | 14 | 238 | 47316 | 637.35 | 307 | 309 | 73.8 |
| C | 13 | 61 | 2132 | 24.72 | 307 | 309 | 73.8 |
| C | 3 | 233 | 1852 | 20.92 | 307 | 309 | 73.8 |
| D | 7 | 238 | 2561273 | 47304.98 | 218 | 210 | 54.1 |
| D | 10 | 66 | 1081719 | 19976.38 | 218 | 210 | 54.1 |
| D | 1 | 52 | 33114 | 607.76 | 218 | 210 | 54.1 |
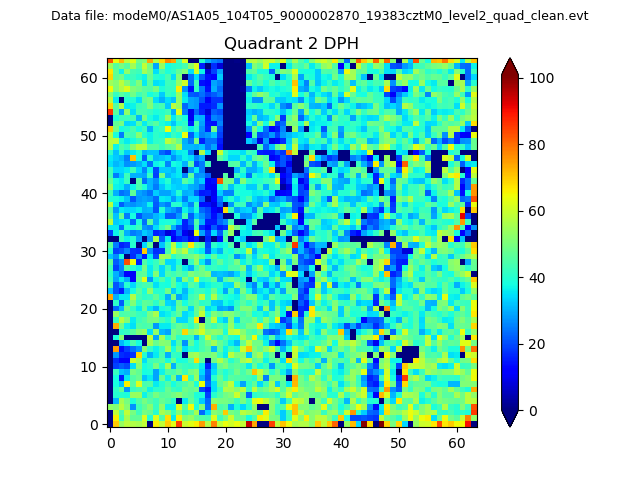
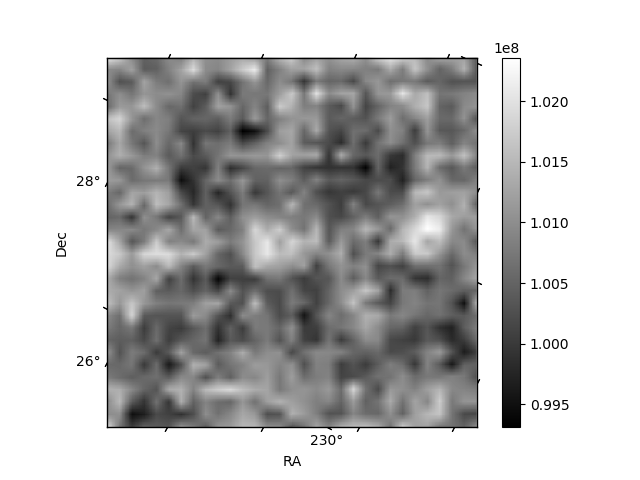
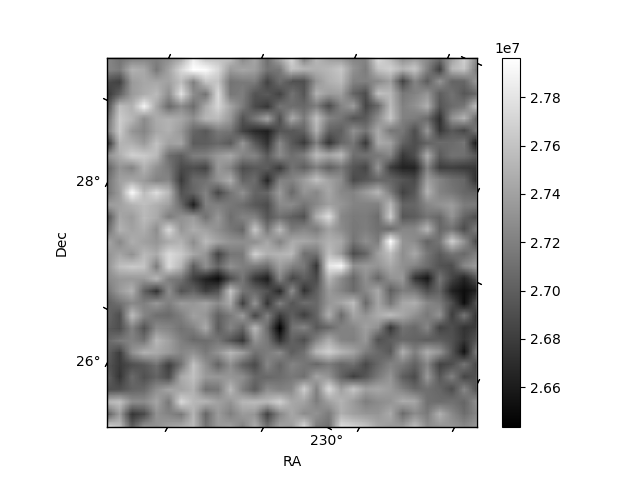
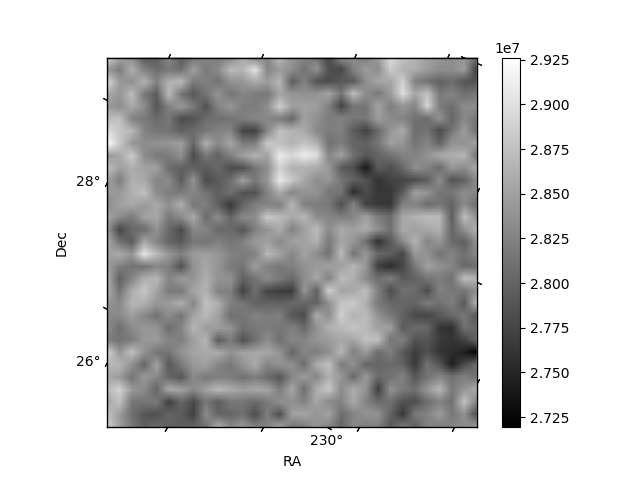
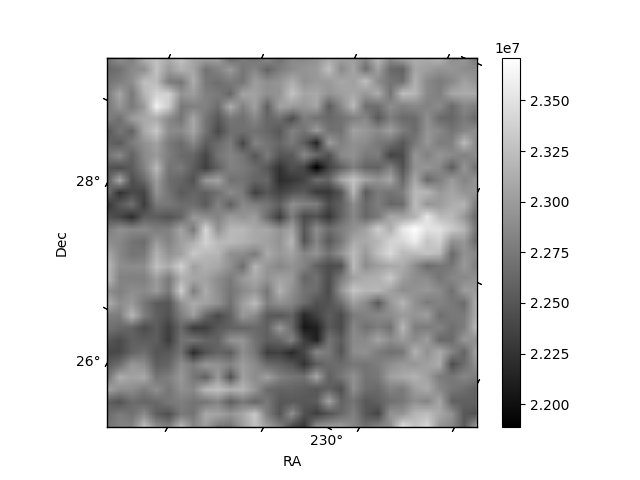
Histogram calculated using DETX and DETY for each event in the final _common_clean file
| Quadrant A | 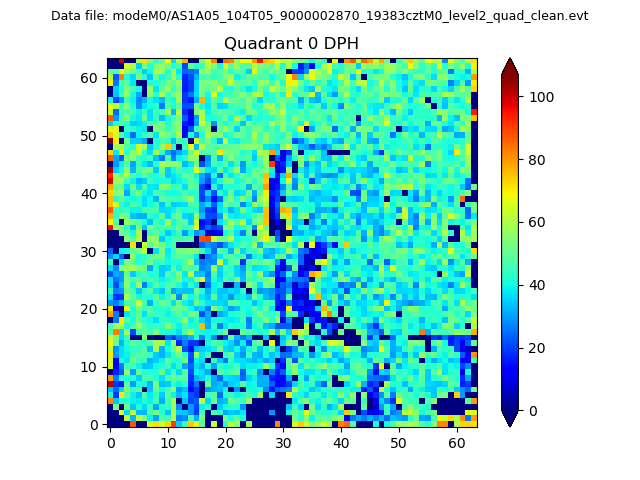 |
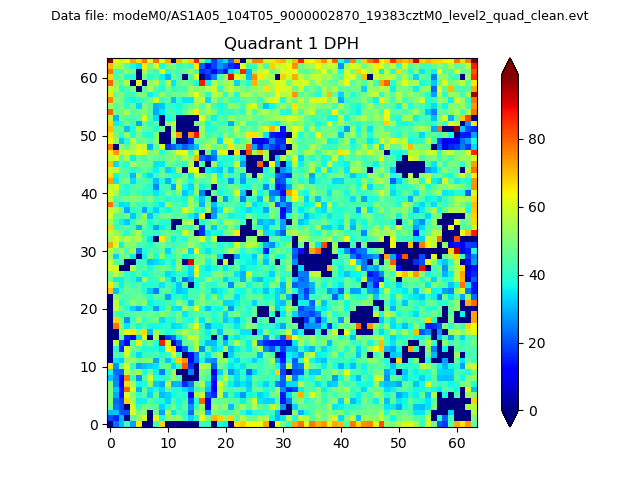 |
Quadrant B |
|---|---|---|---|
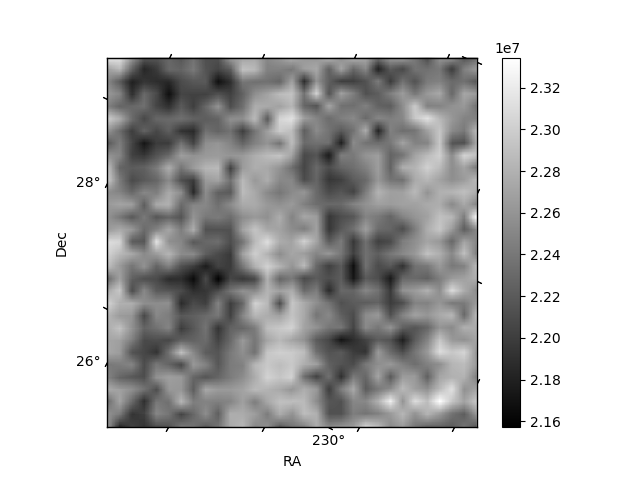
| Quadrant D | 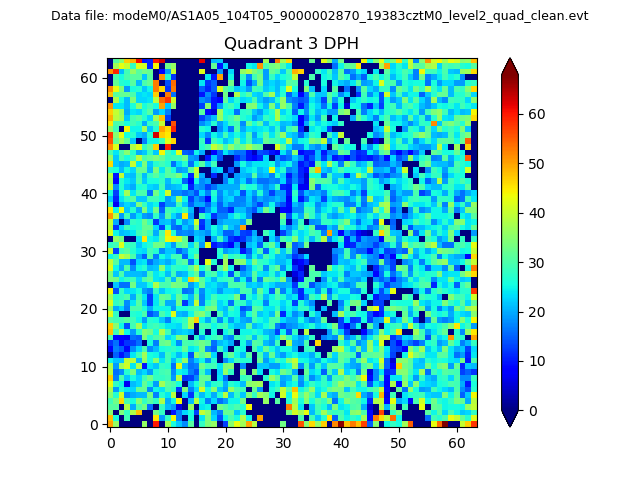 |
 |
Quadrant C |
| Plot type | Count rate plots | Images |
|---|---|---|
| Comparison with Poisson distribution Blue bars denote a histogram of data divided into 1 sec bins. Red curve is a Poisson curve with rate = median count rate of data. |
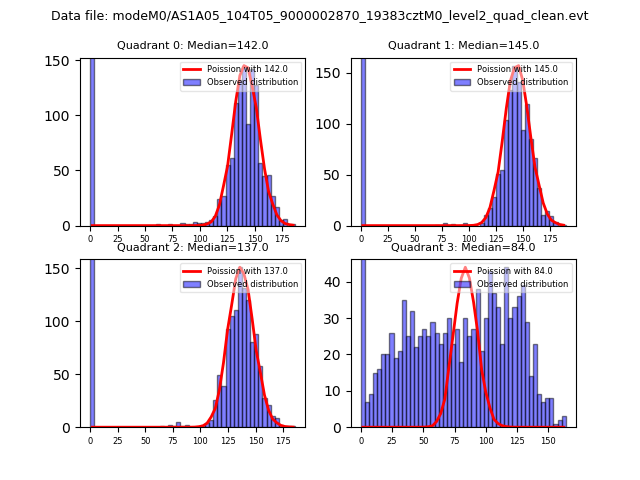 |
 |
| Quadrant-wise count rates Data is divided into 100 sec bins |
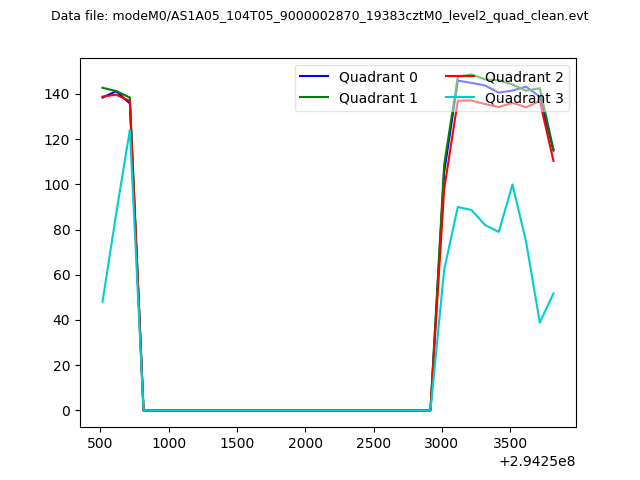 |
|
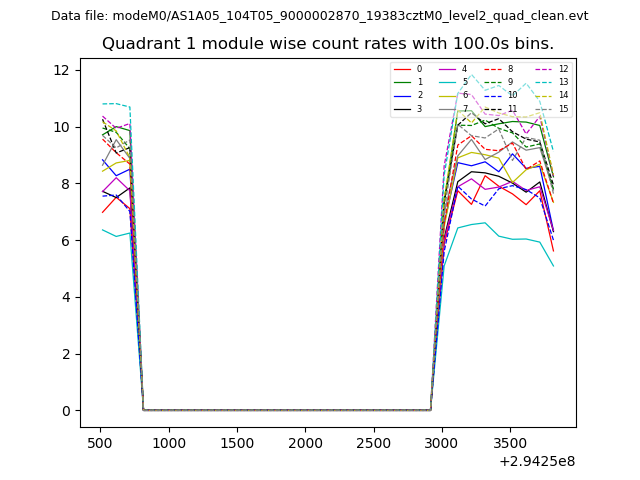
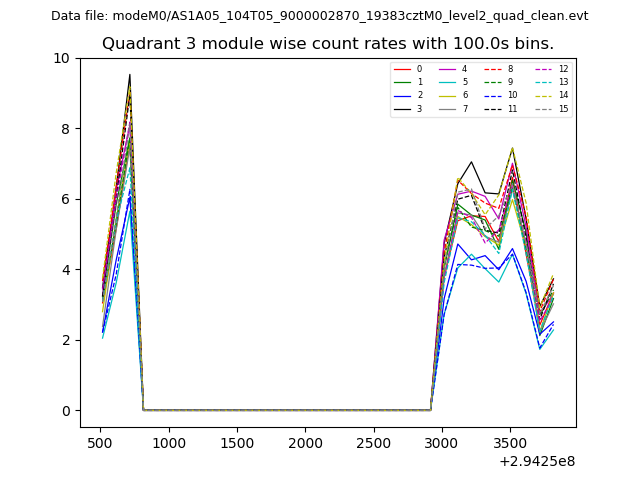
| Module-wise count rates for Quadrant A Data is divided into 100 sec bins |
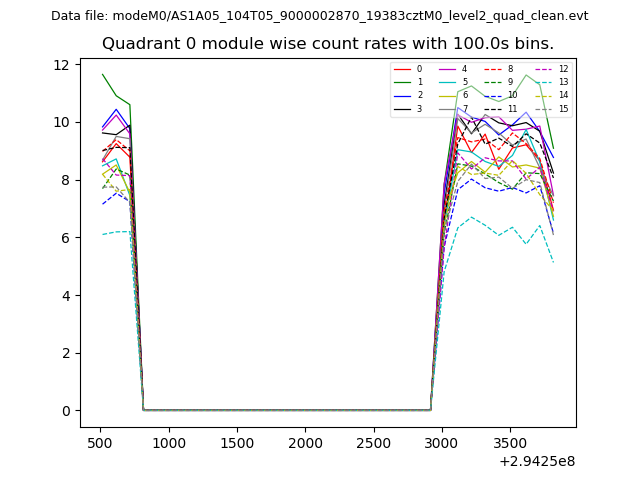 |
 |
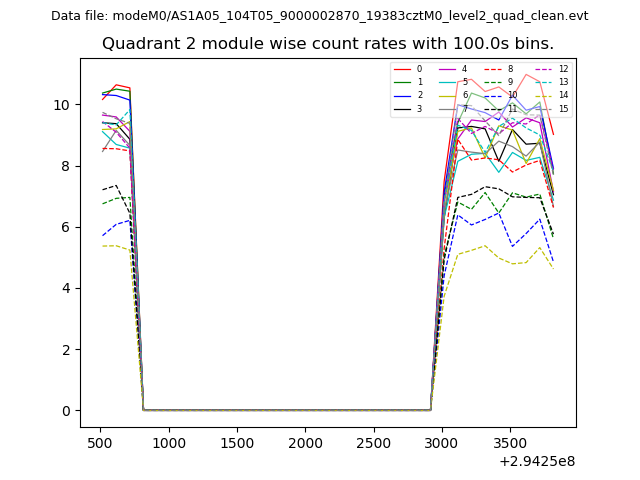
| Module-wise count rates for Quadrant B Data is divided into 100 sec bins |
 |
 |
| Module-wise count rates for Quadrant C Data is divided into 100 sec bins |
 |
 |
| Module-wise count rates for Quadrant D Data is divided into 100 sec bins |
 |
 |
| Parameter | Plot |
|---|---|
| CZT HV Monitor | 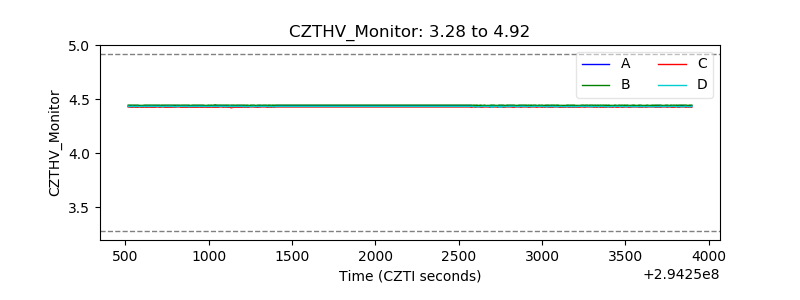 |
| D_VDD | 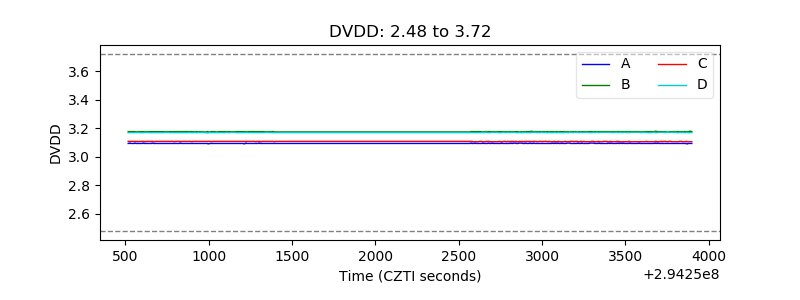 |
| Temperature 1 | 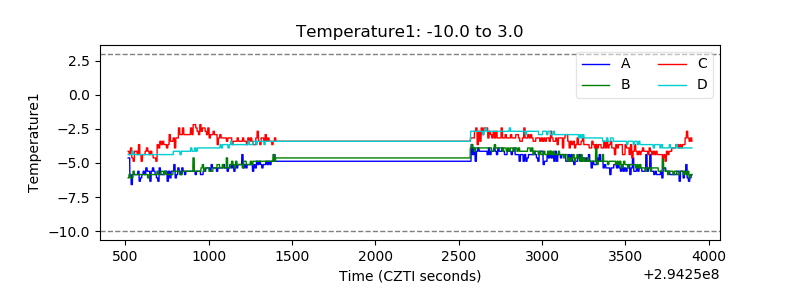 |
| Veto HV Monitor | 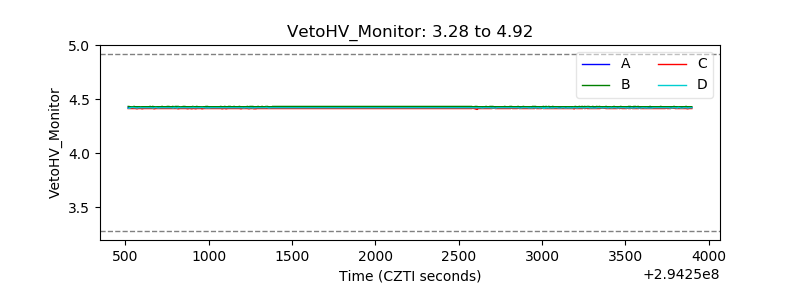 |
| Veto LLD | 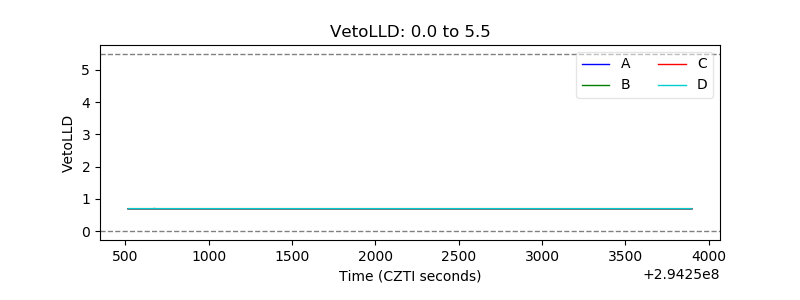 |
| Alpha Counter |  |
| _CPM_Rate | 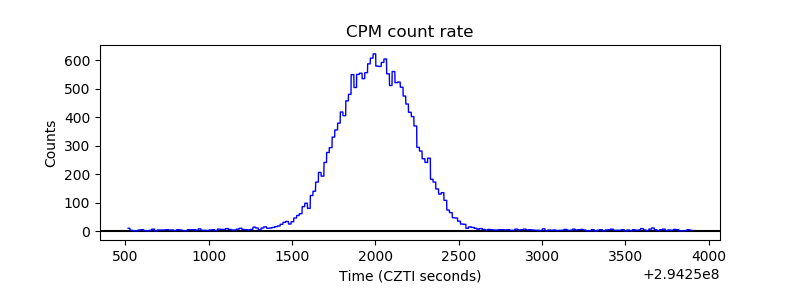 |
| CZT Counter | 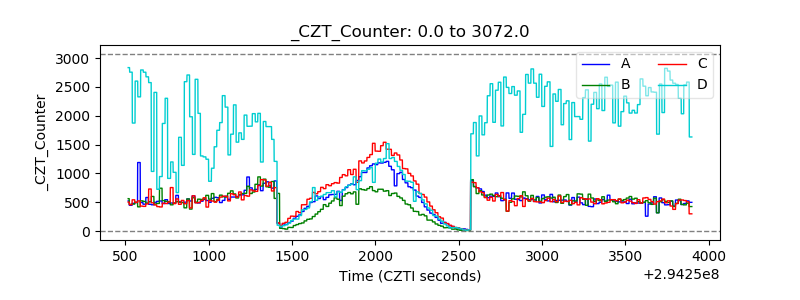 |
| +2.5 Volts monitor |  |
| +5 Volts monitor |  |
| _ROLL_ROT | 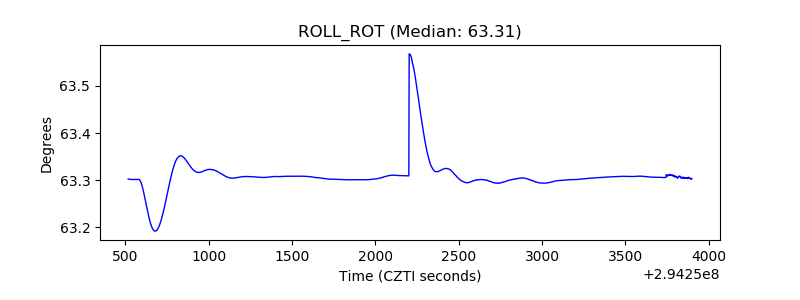 |
| _Roll_DEC | 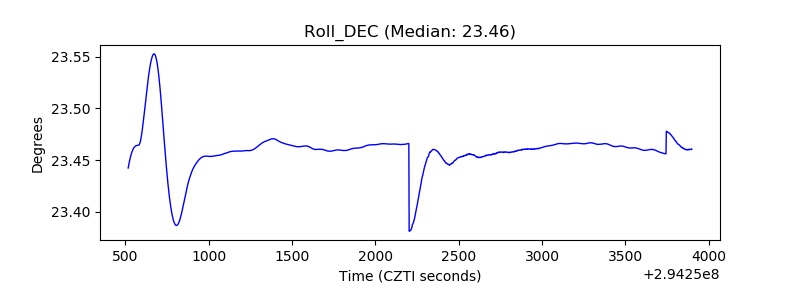 |
| _Roll_RA | 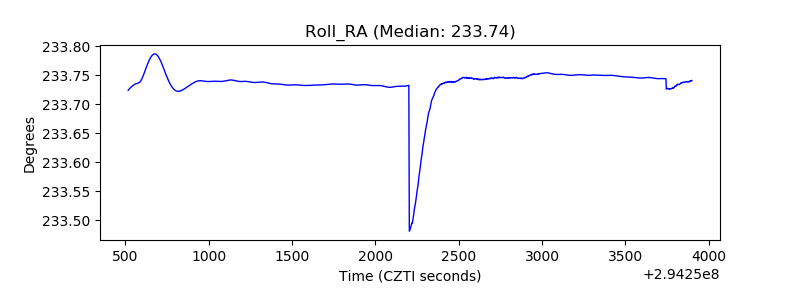 |
| Veto Counter | 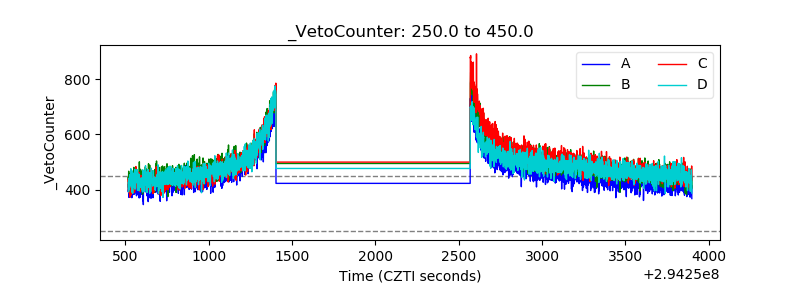 |