| Param | Original file | Final file |
|---|---|---|
| Filename | modeM0/AS1A05_104T05_9000002870_19384cztM0_level2.evt | modeM0/AS1A05_104T05_9000002870_19384cztM0_level2_quad_clean.evt |
| Size (bytes) | 844,191,360 | 94,855,680 |
| Size | 805.1 MB | 90.5 MB |
| Events in quadrant A | 3,592,297 | 646,623 |
| Events in quadrant B | 3,607,283 | 653,816 |
| Events in quadrant C | 3,572,700 | 630,877 |
| Events in quadrant D | 14,316,112 | 447,957 |
| Mode M9 | |||
|---|---|---|---|
| Quadrant | BADHDUFLAG | Total packets | Discarded packets |
| A | 0 | 19 | 0 |
| B | 0 | 19 | 0 |
| C | 0 | 19 | 0 |
| D | 0 | 19 | 0 |
| Mode SS | |||
|---|---|---|---|
| Quadrant | BADHDUFLAG | Total packets | Discarded packets |
| A | 0 | 148 | 0 |
| B | 0 | 148 | 0 |
| C | 0 | 148 | 0 |
| D | 0 | 148 | 0 |
| Mode M0 | |||
|---|---|---|---|
| Quadrant | BADHDUFLAG | Total packets | Discarded packets |
| A | 0 | 15116 | 2 |
| B | 0 | 15131 | 2 |
| C | 0 | 14962 | 2 |
| D | 0 | 47339 | 3 |
| Quadrant | Total seconds | Saturated seconds | Saturation percentage |
|---|---|---|---|
| A | 7056 | 150 | 2.125850% |
| B | 7056 | 181 | 2.565193% |
| C | 7056 | 221 | 3.132086% |
| D | 7055 | 4629 | 65.613040% |
Noise dominated data is calculated using 1-second bins in cleaned event files. If a bin has >2000 counts, and if more than 50% of those come from <1% of pixels, then it is considered to be noise-dominated and hence unusable.
| Quadrant | # 1 sec bins | Bins with >0 counts | Bins with >2000 counts | High rate bins dominated by noise | Noise dominated (total time) | Noise dominated (detector-on time) | Marked lightcurve |
|---|---|---|---|---|---|---|---|
| A | 9016 | 7057 | 0 | 0 | 0.00% | 0.00% | 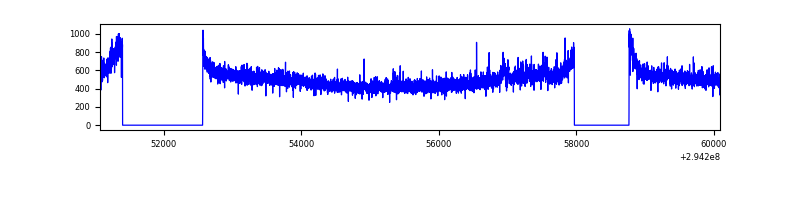 |
| B | 9016 | 7057 | 0 | 0 | 0.00% | 0.00% | 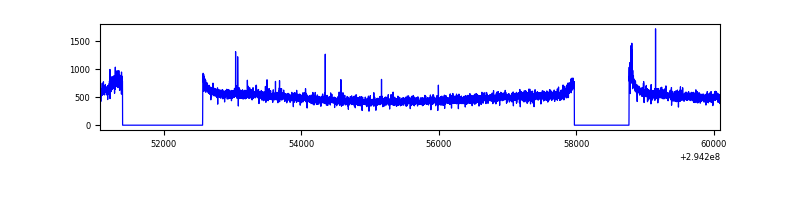 |
| C | 9016 | 7056 | 0 | 0 | 0.00% | 0.00% | 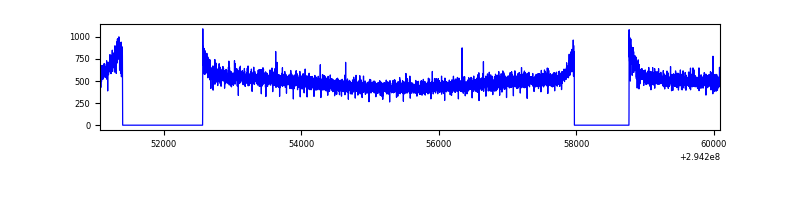 |
| D | 9015 | 7055 | 4042 | 4042 | 44.84% | 57.29% | 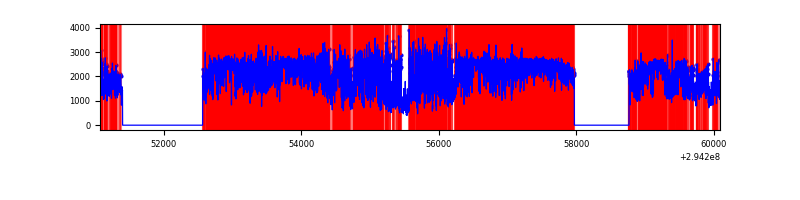 |
Top three noisy pixels from each quadrant. If the there are fewer than three noisy pixels in the level2.evt file, extra rows are filled as -1
| Pixel properties | Quadrant properties | ||||||
|---|---|---|---|---|---|---|---|
| Quadrant | DetID | PixID | Counts | Sigma | Mean | Median | Sigma |
| A | 15 | 174 | 32213 | 171.04 | 915 | 898 | 183.1 |
| A | 14 | 111 | 22256 | 116.65 | 915 | 898 | 183.1 |
| A | 12 | 96 | 9255 | 45.64 | 915 | 898 | 183.1 |
| B | 0 | 198 | 33913 | 189.3 | 909 | 886 | 174.5 |
| B | 12 | 111 | 21294 | 116.97 | 909 | 886 | 174.5 |
| B | 11 | 111 | 18818 | 102.78 | 909 | 886 | 174.5 |
| C | 14 | 238 | 136819 | 655.6 | 881 | 888 | 207.3 |
| C | 13 | 61 | 6087 | 25.08 | 881 | 888 | 207.3 |
| C | 3 | 233 | 3593 | 13.05 | 881 | 888 | 207.3 |
| D | 7 | 238 | 6354186 | 40862.66 | 642 | 623 | 155.5 |
| D | 10 | 66 | 4325344 | 27814.25 | 642 | 623 | 155.5 |
| D | 1 | 52 | 1136773 | 7307.1 | 642 | 623 | 155.5 |
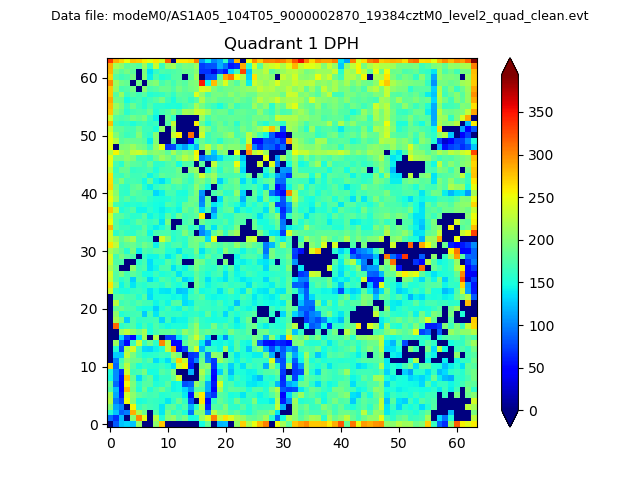
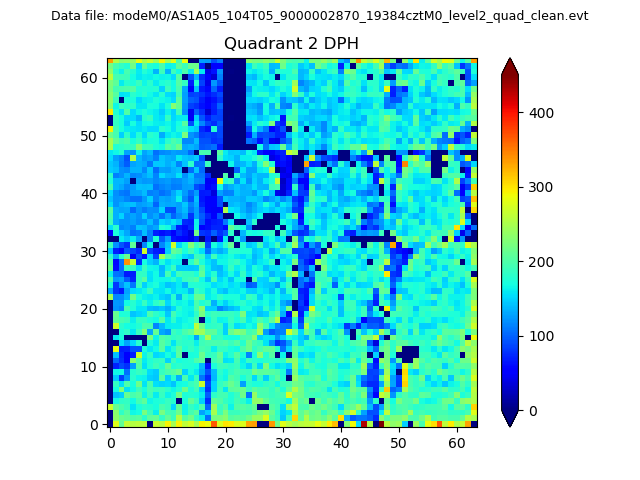
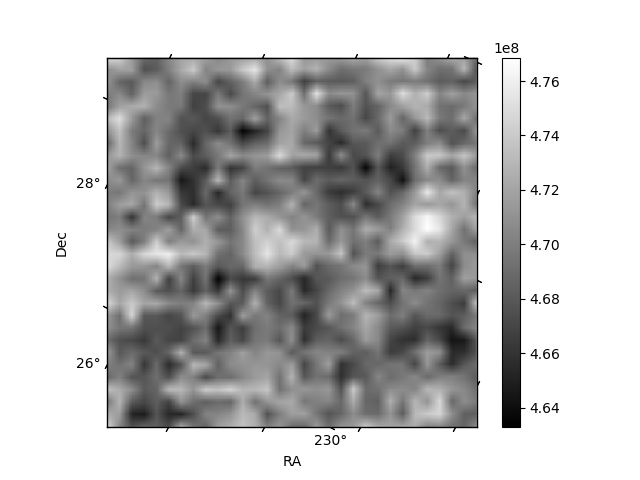
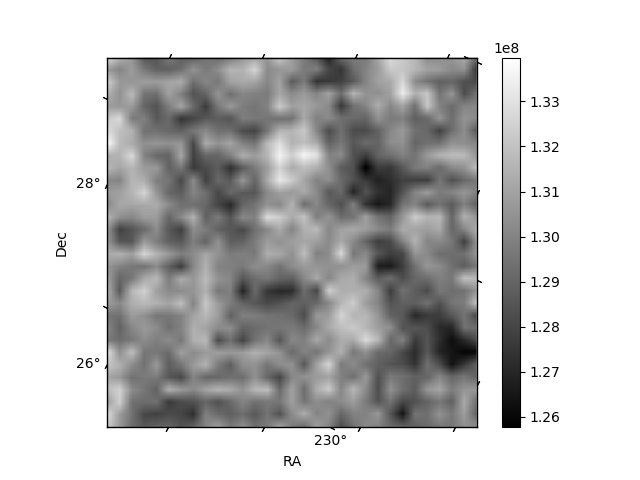
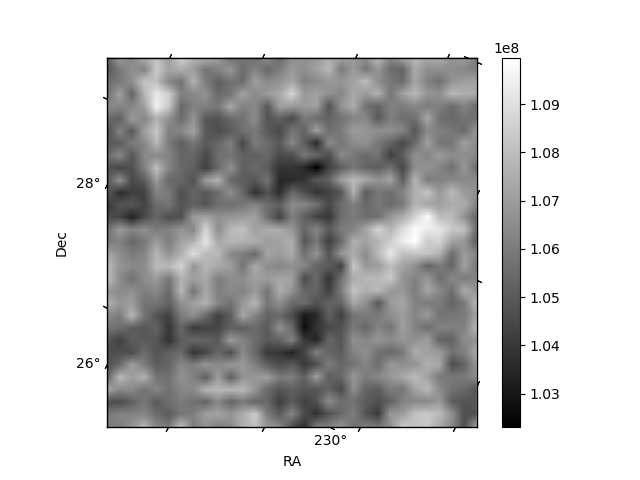
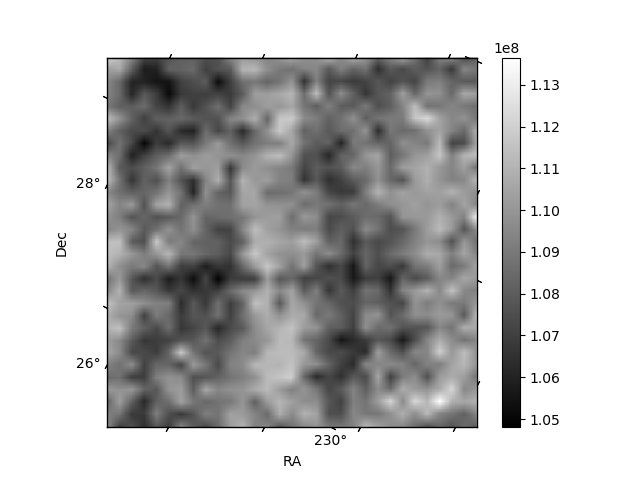
Histogram calculated using DETX and DETY for each event in the final _common_clean file
| Quadrant A |  |
 |
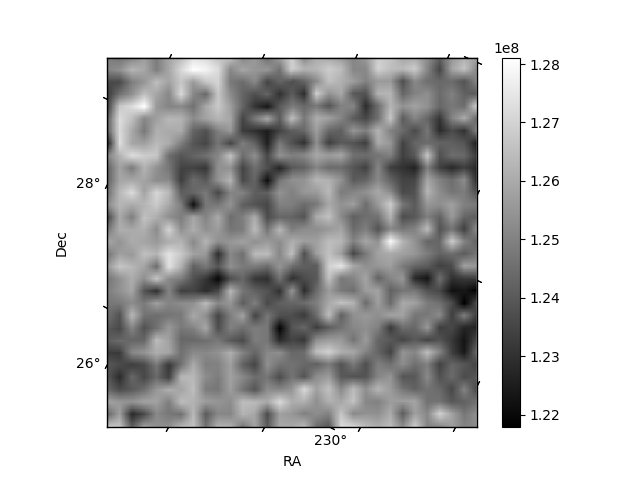
Quadrant B |
|---|---|---|---|
| Quadrant D | 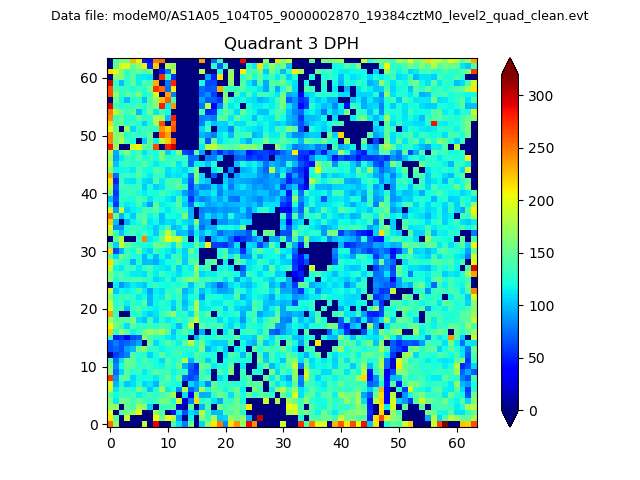 |
 |
Quadrant C |
| Plot type | Count rate plots | Images |
|---|---|---|
| Comparison with Poisson distribution Blue bars denote a histogram of data divided into 1 sec bins. Red curve is a Poisson curve with rate = median count rate of data. |
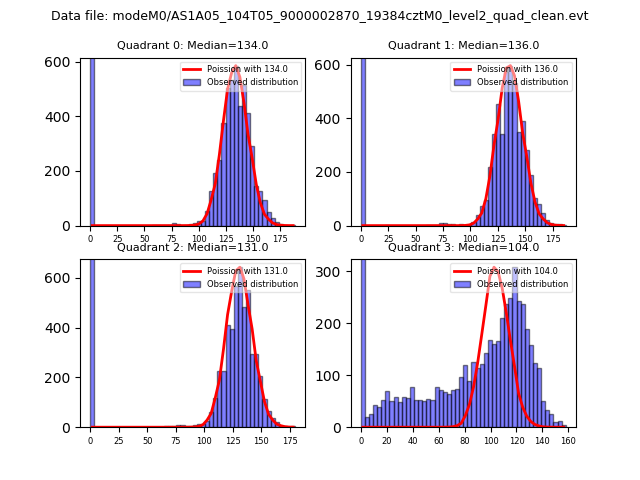 |
 |
| Quadrant-wise count rates Data is divided into 100 sec bins |
 |
|
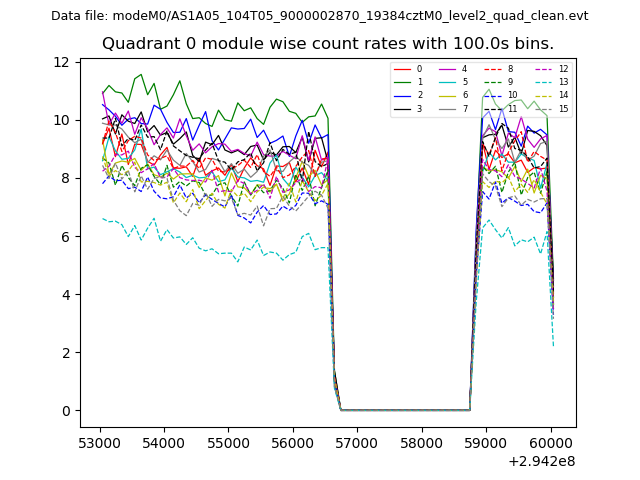
| Module-wise count rates for Quadrant A Data is divided into 100 sec bins |
 |
 |
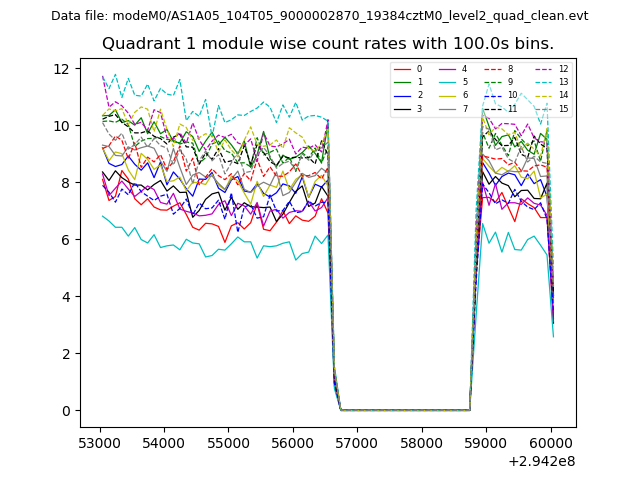
| Module-wise count rates for Quadrant B Data is divided into 100 sec bins |
 |
 |
| Module-wise count rates for Quadrant C Data is divided into 100 sec bins |
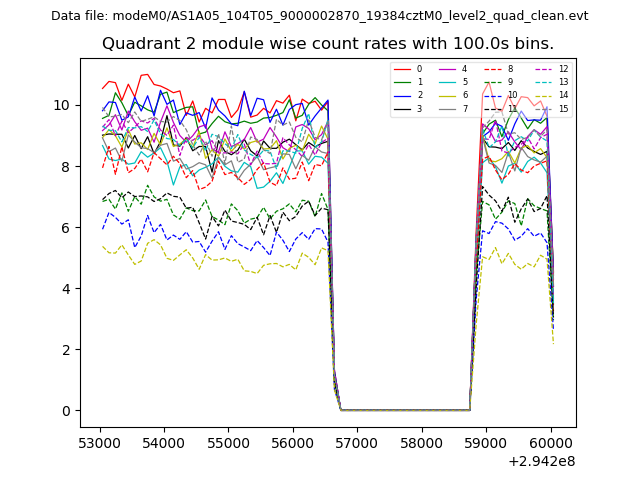 |
 |
| Module-wise count rates for Quadrant D Data is divided into 100 sec bins |
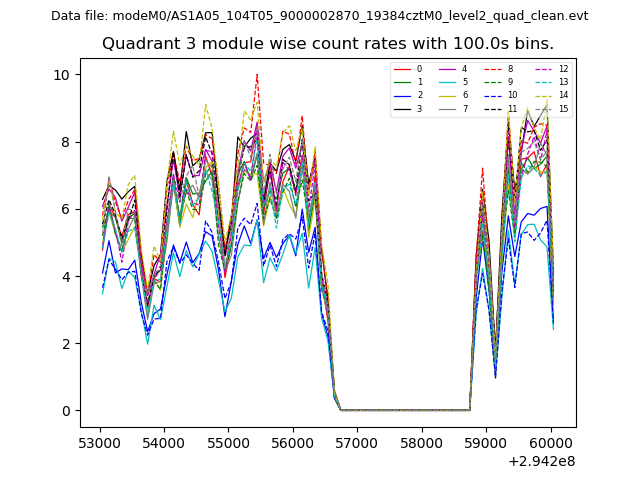 |
 |
| Parameter | Plot |
|---|---|
| CZT HV Monitor |  |
| D_VDD | 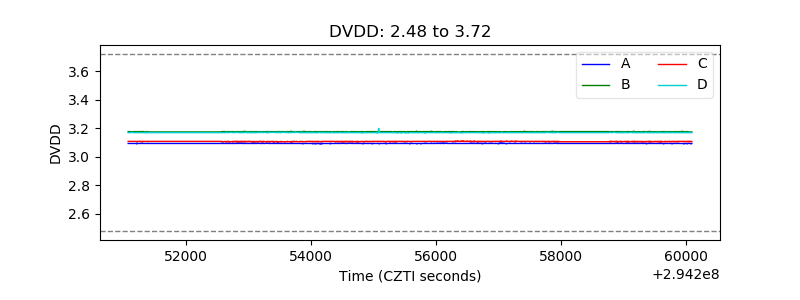 |
| Temperature 1 | 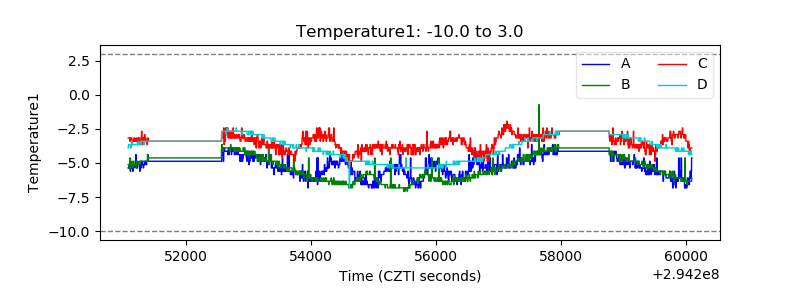 |
| Veto HV Monitor | 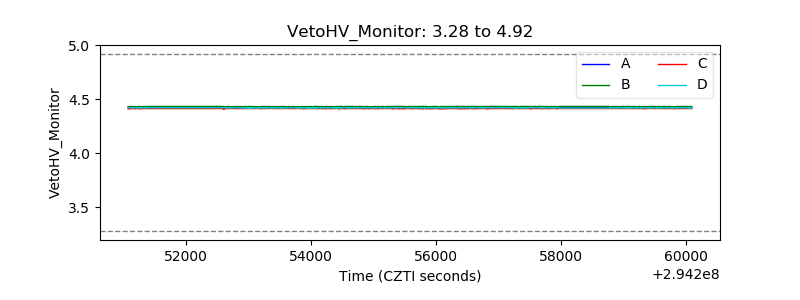 |
| Veto LLD | 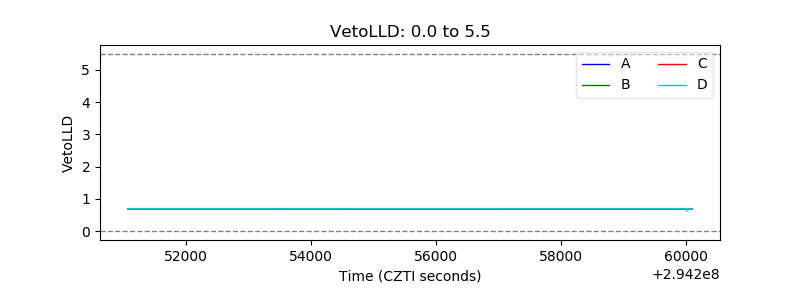 |
| Alpha Counter | 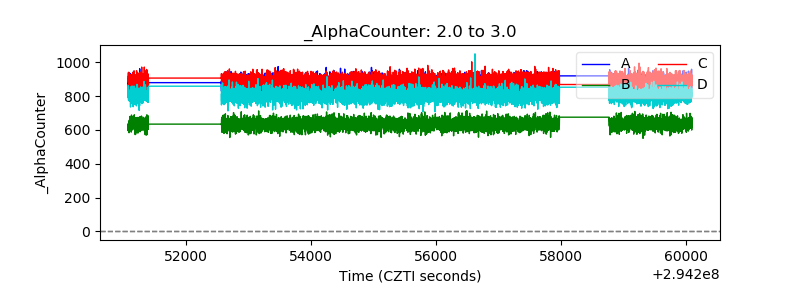 |
| _CPM_Rate | 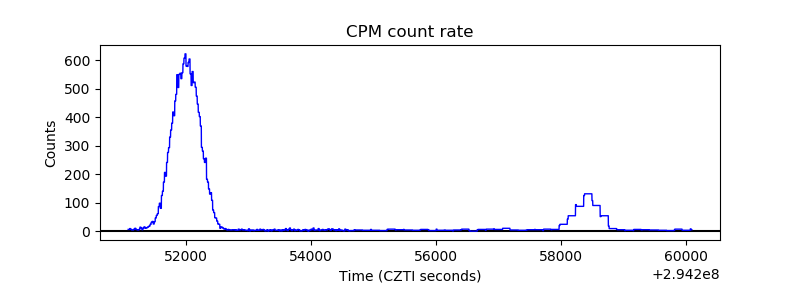 |
| CZT Counter | 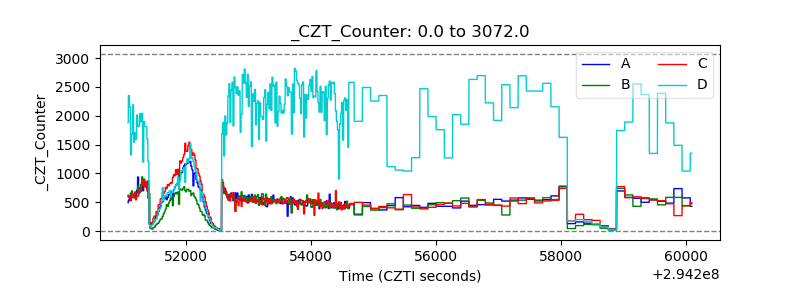 |
| +2.5 Volts monitor |  |
| +5 Volts monitor |  |
| _ROLL_ROT | 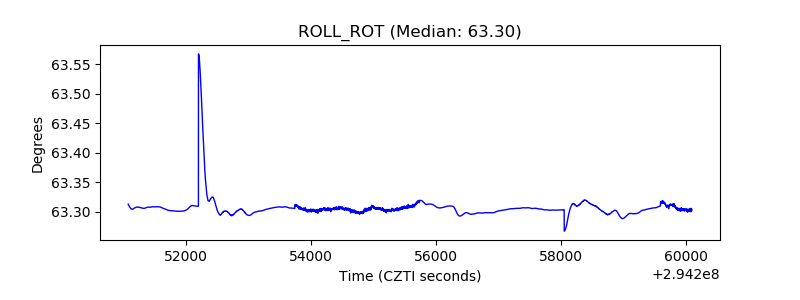 |
| _Roll_DEC | 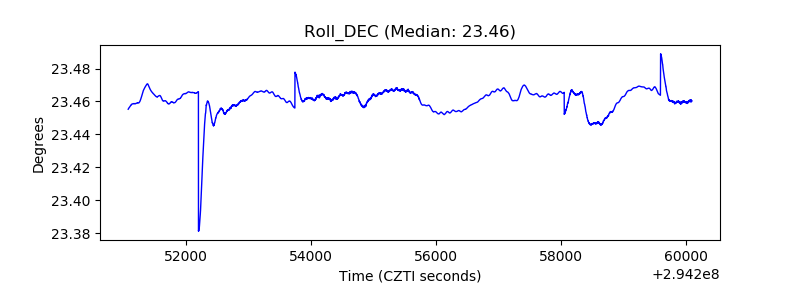 |
| _Roll_RA | 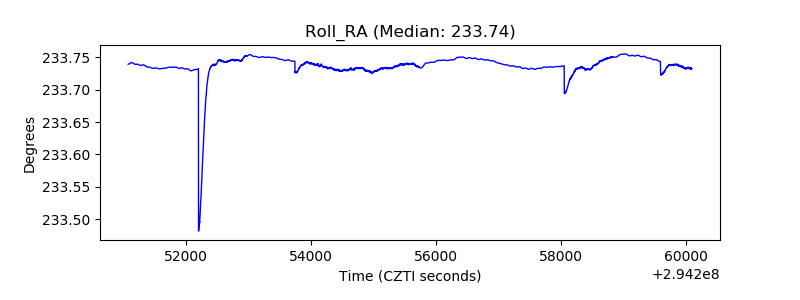 |
| Veto Counter | 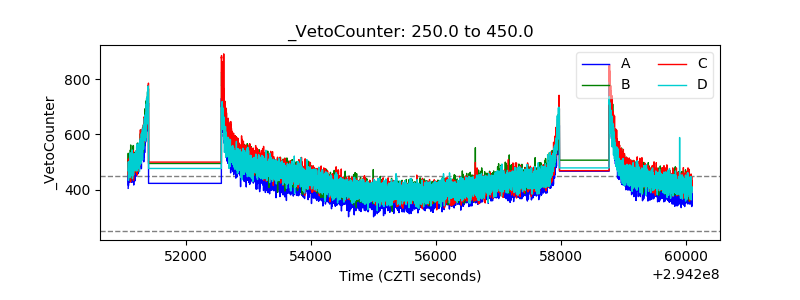 |