| Param | Original file | Final file |
|---|---|---|
| Filename | modeM0/AS1A05_104T05_9000002870_19385cztM0_level2.evt | modeM0/AS1A05_104T05_9000002870_19385cztM0_level2_quad_clean.evt |
| Size (bytes) | 879,526,080 | 97,125,120 |
| Size | 838.8 MB | 92.6 MB |
| Events in quadrant A | 3,698,352 | 640,874 |
| Events in quadrant B | 3,714,294 | 649,851 |
| Events in quadrant C | 3,693,925 | 630,242 |
| Events in quadrant D | 15,022,574 | 496,755 |
| Mode M9 | |||
|---|---|---|---|
| Quadrant | BADHDUFLAG | Total packets | Discarded packets |
| A | 0 | 13 | 0 |
| B | 0 | 13 | 0 |
| C | 0 | 13 | 0 |
| D | 0 | 13 | 0 |
| Mode SS | |||
|---|---|---|---|
| Quadrant | BADHDUFLAG | Total packets | Discarded packets |
| A | 0 | 154 | 0 |
| B | 0 | 154 | 0 |
| C | 0 | 154 | 0 |
| D | 0 | 154 | 0 |
| Mode M0 | |||
|---|---|---|---|
| Quadrant | BADHDUFLAG | Total packets | Discarded packets |
| A | 0 | 15765 | 2 |
| B | 0 | 15824 | 2 |
| C | 0 | 15698 | 2 |
| D | 0 | 49739 | 6 |
| Quadrant | Total seconds | Saturated seconds | Saturation percentage |
|---|---|---|---|
| A | 7511 | 74 | 0.985222% |
| B | 7511 | 116 | 1.544402% |
| C | 7511 | 166 | 2.210092% |
| D | 7511 | 4161 | 55.398749% |
Noise dominated data is calculated using 1-second bins in cleaned event files. If a bin has >2000 counts, and if more than 50% of those come from <1% of pixels, then it is considered to be noise-dominated and hence unusable.
| Quadrant | # 1 sec bins | Bins with >0 counts | Bins with >2000 counts | High rate bins dominated by noise | Noise dominated (total time) | Noise dominated (detector-on time) | Marked lightcurve |
|---|---|---|---|---|---|---|---|
| A | 8751 | 7513 | 0 | 0 | 0.00% | 0.00% | 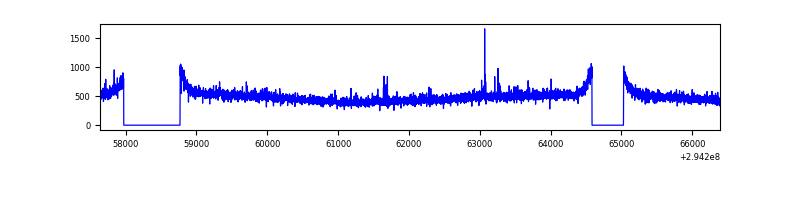 |
| B | 8751 | 7513 | 0 | 0 | 0.00% | 0.00% | 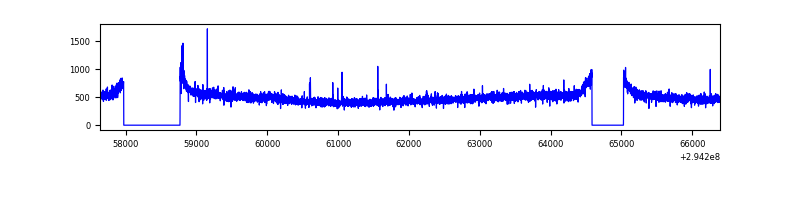 |
| C | 8751 | 7512 | 0 | 0 | 0.00% | 0.00% | 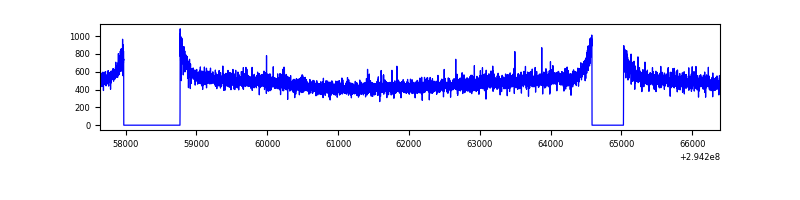 |
| D | 8751 | 7511 | 4039 | 4039 | 46.15% | 53.77% | 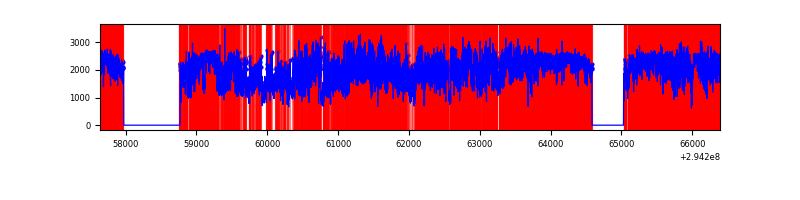 |
Top three noisy pixels from each quadrant. If the there are fewer than three noisy pixels in the level2.evt file, extra rows are filled as -1
| Pixel properties | Quadrant properties | ||||||
|---|---|---|---|---|---|---|---|
| Quadrant | DetID | PixID | Counts | Sigma | Mean | Median | Sigma |
| A | 14 | 111 | 42180 | 216.97 | 942 | 921 | 190.2 |
| A | 15 | 174 | 11368 | 54.94 | 942 | 921 | 190.2 |
| A | 12 | 96 | 10832 | 52.12 | 942 | 921 | 190.2 |
| B | 0 | 198 | 31269 | 167.42 | 938 | 913 | 181.3 |
| B | 12 | 111 | 22556 | 119.37 | 938 | 913 | 181.3 |
| B | 11 | 111 | 20037 | 105.47 | 938 | 913 | 181.3 |
| C | 14 | 238 | 140637 | 647.81 | 909 | 914 | 215.7 |
| C | 13 | 61 | 6343 | 25.17 | 909 | 914 | 215.7 |
| C | 3 | 233 | 5044 | 19.15 | 909 | 914 | 215.7 |
| D | 10 | 66 | 9550133 | 54925.37 | 711 | 690 | 173.9 |
| D | 7 | 238 | 2264740 | 13022.1 | 711 | 690 | 173.9 |
| D | 1 | 52 | 444625 | 2553.37 | 711 | 690 | 173.9 |
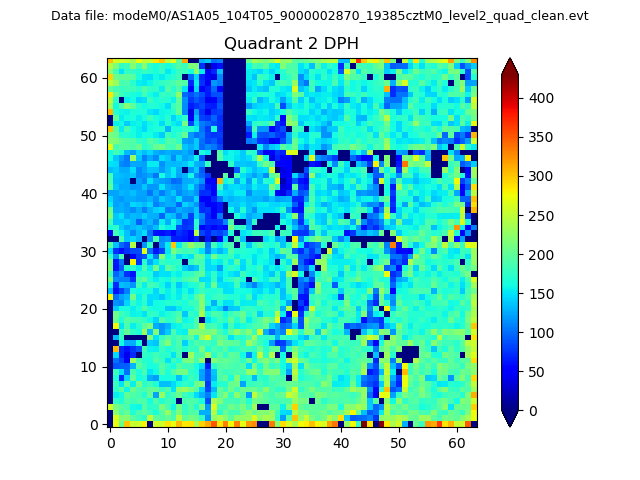
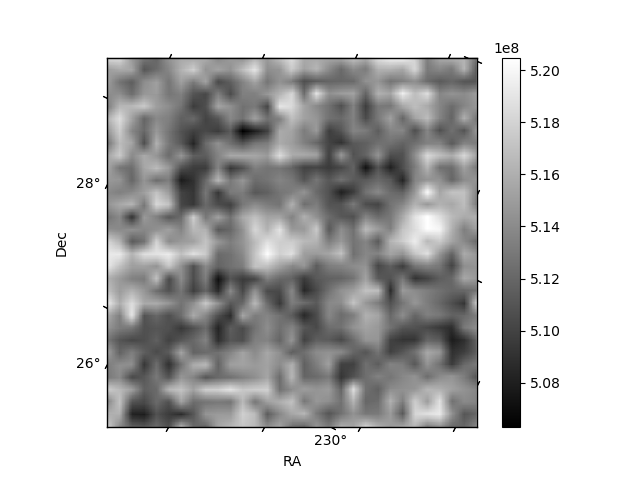
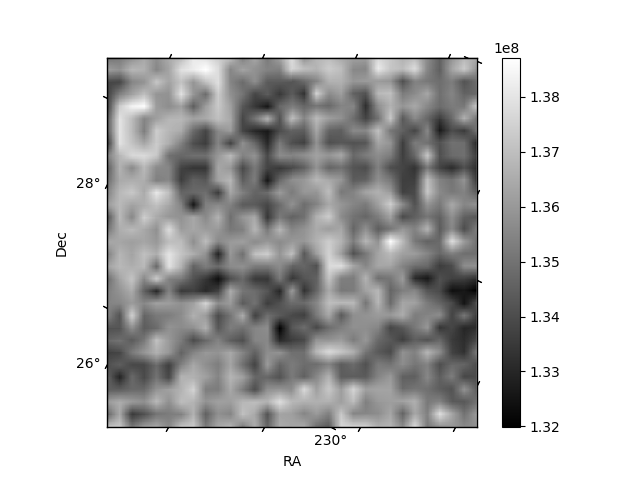
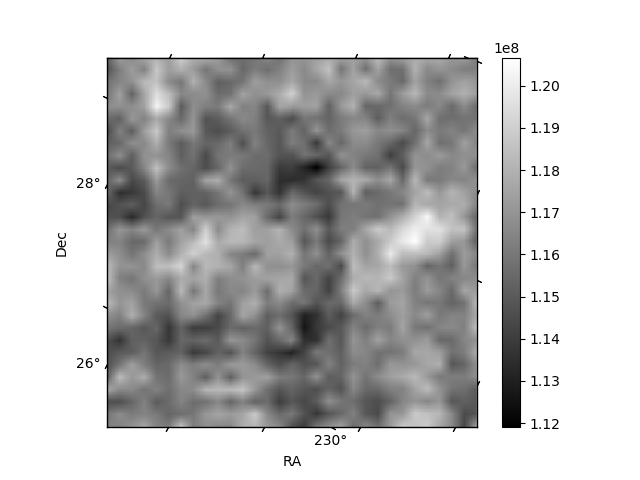
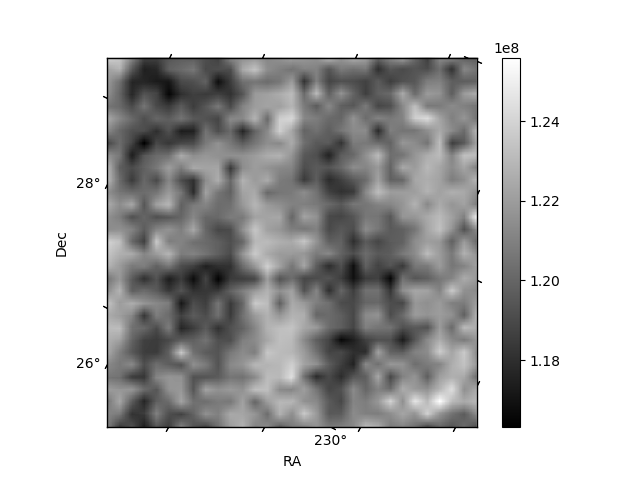
Histogram calculated using DETX and DETY for each event in the final _common_clean file
| Quadrant A | 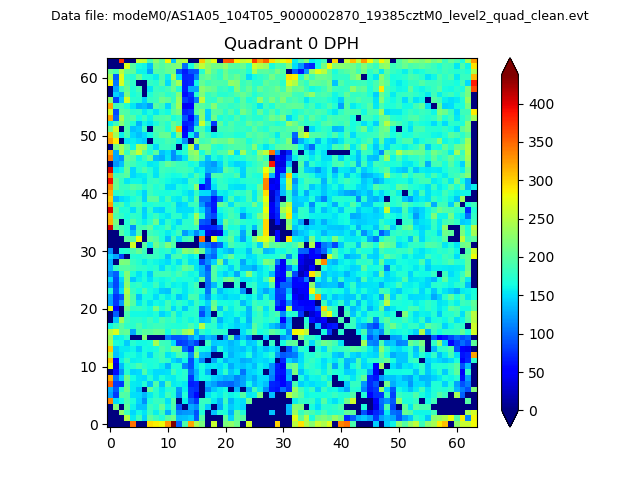 |
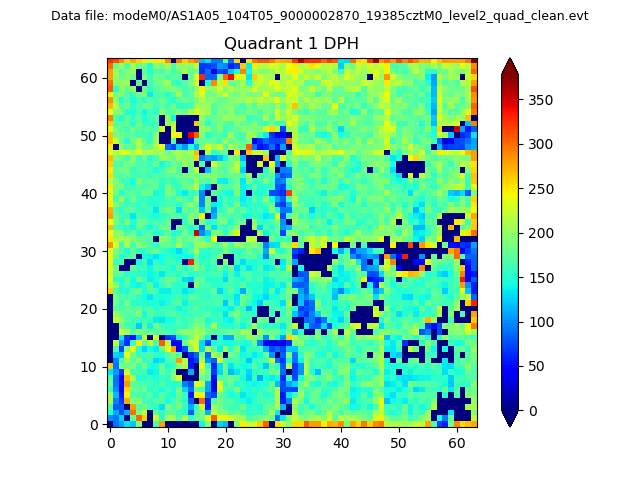 |
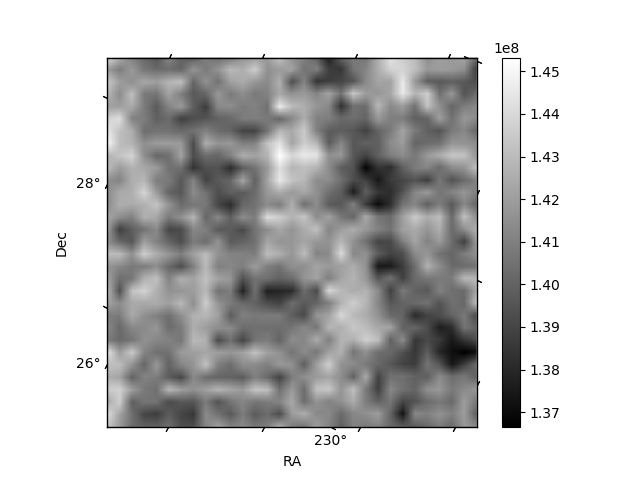
Quadrant B |
|---|---|---|---|
| Quadrant D | 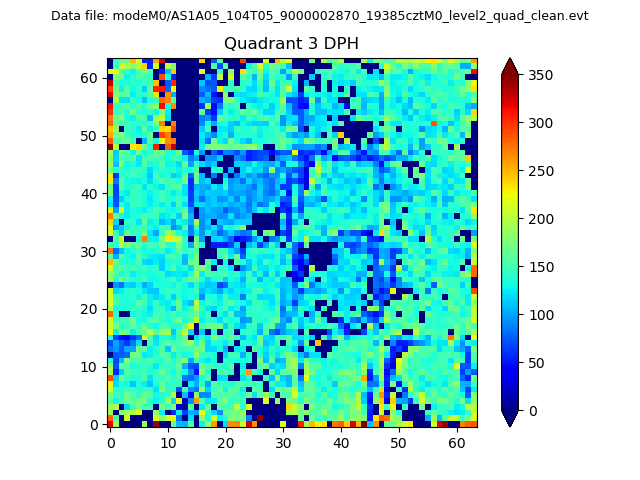 |
 |
Quadrant C |
| Plot type | Count rate plots | Images |
|---|---|---|
| Comparison with Poisson distribution Blue bars denote a histogram of data divided into 1 sec bins. Red curve is a Poisson curve with rate = median count rate of data. |
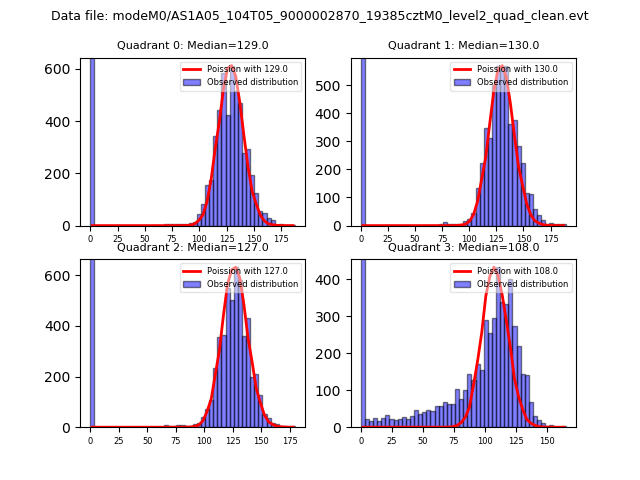 |
 |
| Quadrant-wise count rates Data is divided into 100 sec bins |
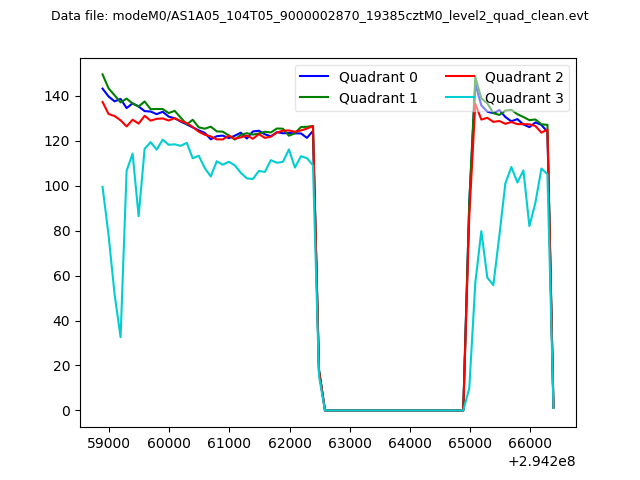 |
|
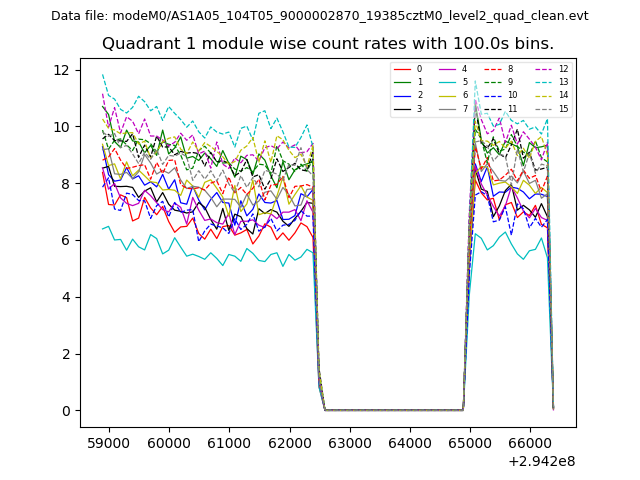
| Module-wise count rates for Quadrant A Data is divided into 100 sec bins |
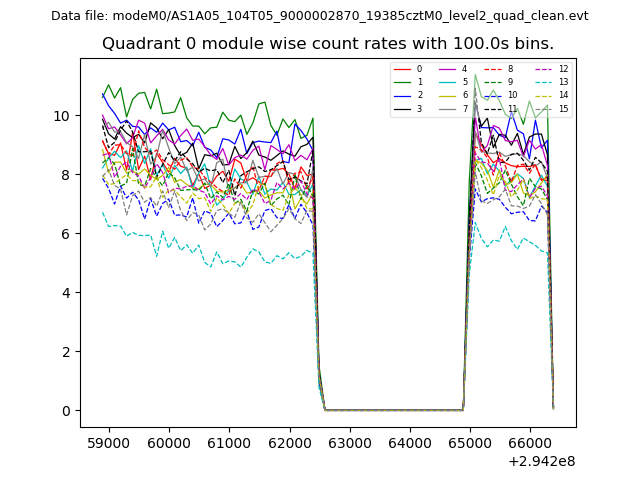 |
 |
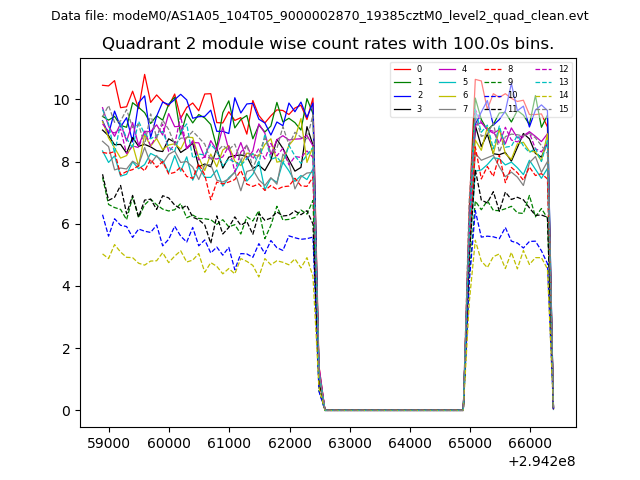
| Module-wise count rates for Quadrant B Data is divided into 100 sec bins |
 |
 |
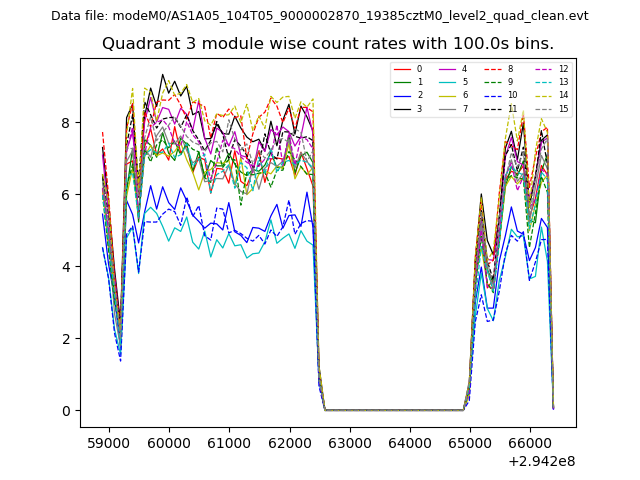
| Module-wise count rates for Quadrant C Data is divided into 100 sec bins |
 |
 |
| Module-wise count rates for Quadrant D Data is divided into 100 sec bins |
 |
 |
| Parameter | Plot |
|---|---|
| CZT HV Monitor | 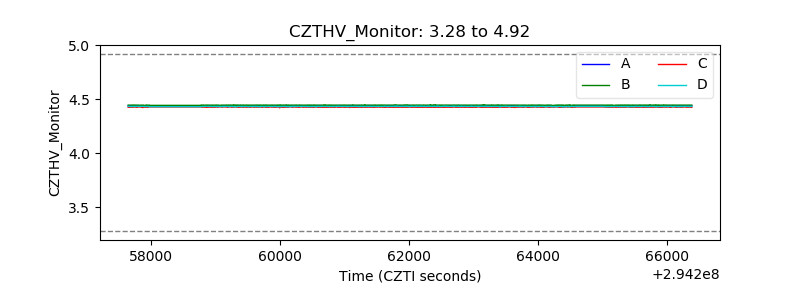 |
| D_VDD | 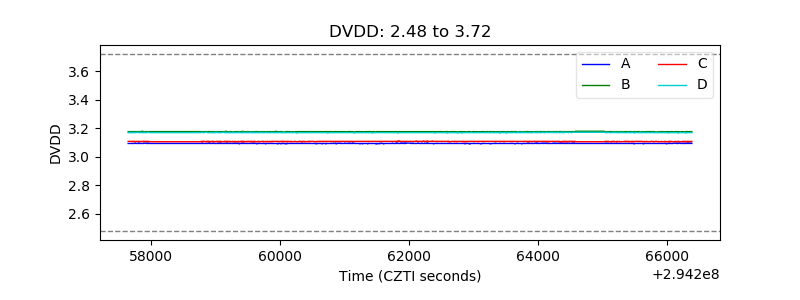 |
| Temperature 1 | 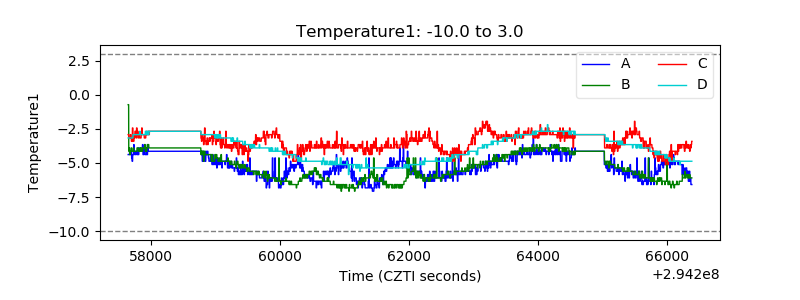 |
| Veto HV Monitor | 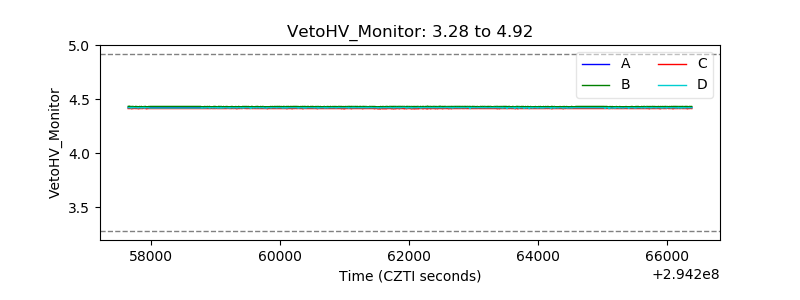 |
| Veto LLD | 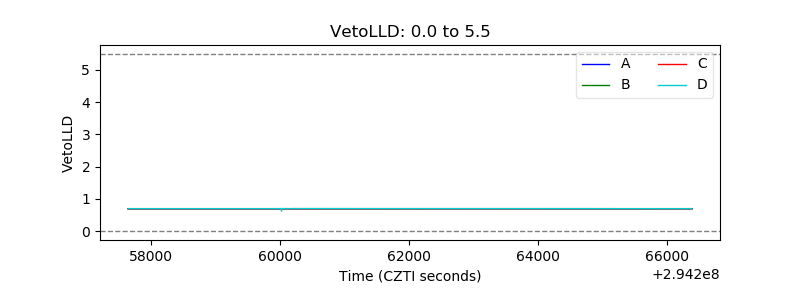 |
| Alpha Counter | 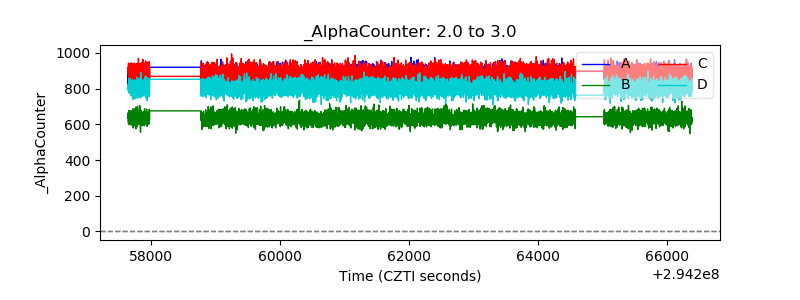 |
| _CPM_Rate | 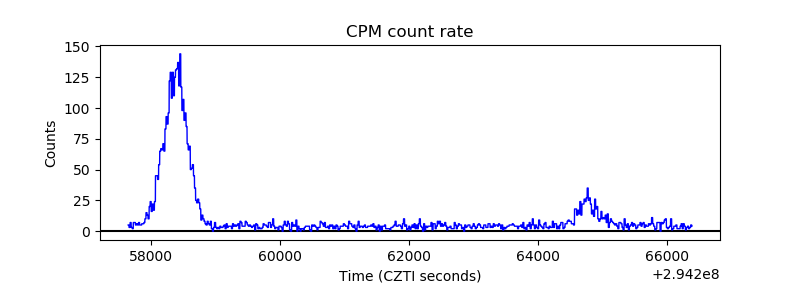 |
| CZT Counter | 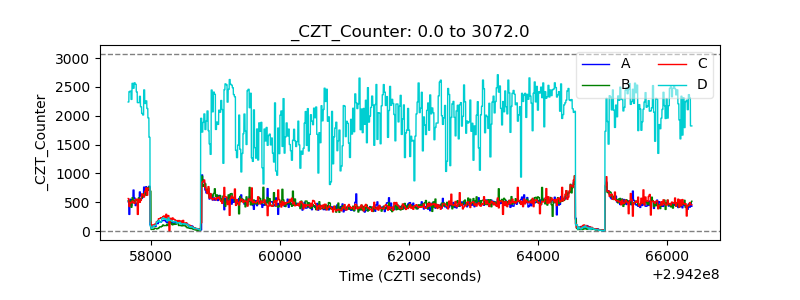 |
| +2.5 Volts monitor |  |
| +5 Volts monitor | 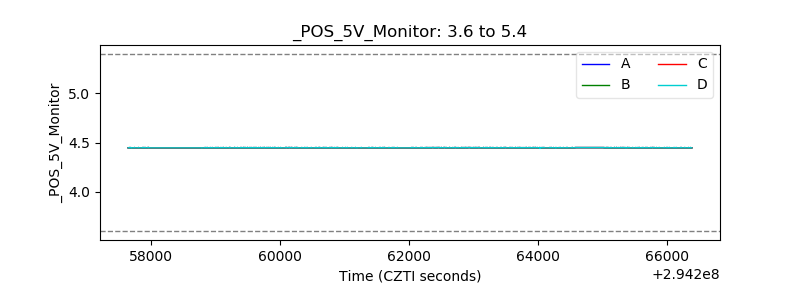 |
| _ROLL_ROT | 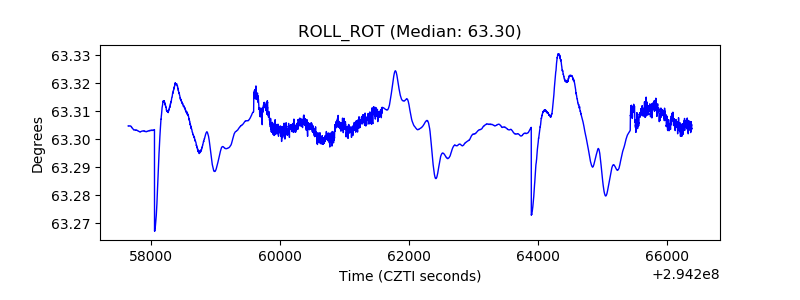 |
| _Roll_DEC | 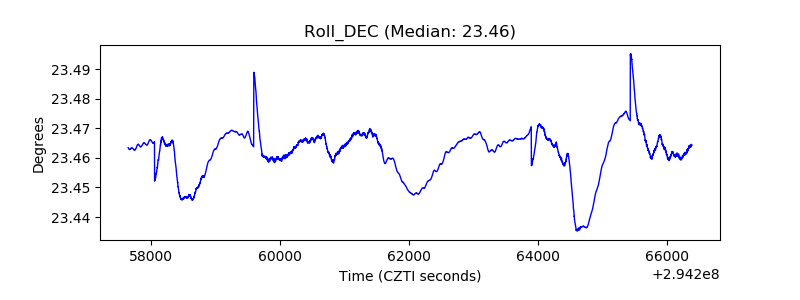 |
| _Roll_RA | 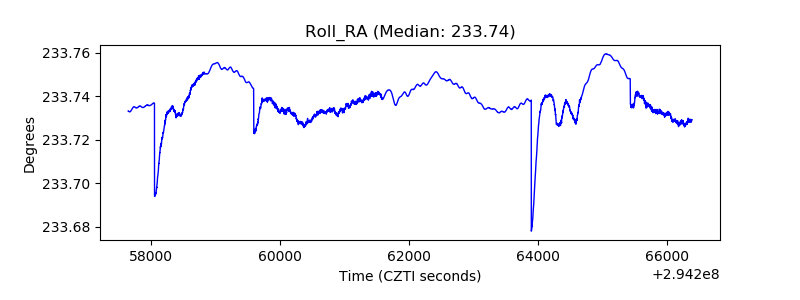 |
| Veto Counter |  |