| Param | Original file | Final file |
|---|---|---|
| Filename | modeM0/AS1A05_104T05_9000002870_19386cztM0_level2.evt | modeM0/AS1A05_104T05_9000002870_19386cztM0_level2_quad_clean.evt |
| Size (bytes) | 294,724,800 | 35,637,120 |
| Size | 281.1 MB | 34.0 MB |
| Events in quadrant A | 1,190,828 | 245,722 |
| Events in quadrant B | 1,213,669 | 249,554 |
| Events in quadrant C | 1,230,424 | 240,884 |
| Events in quadrant D | 5,125,717 | 168,837 |
| Mode M9 | |||
|---|---|---|---|
| Quadrant | BADHDUFLAG | Total packets | Discarded packets |
| A | 0 | 5 | 0 |
| B | 0 | 5 | 0 |
| C | 0 | 5 | 0 |
| D | 0 | 5 | 0 |
| Mode SS | |||
|---|---|---|---|
| Quadrant | BADHDUFLAG | Total packets | Discarded packets |
| A | 0 | 50 | 0 |
| B | 0 | 50 | 0 |
| C | 0 | 50 | 0 |
| D | 0 | 50 | 0 |
| Mode M0 | |||
|---|---|---|---|
| Quadrant | BADHDUFLAG | Total packets | Discarded packets |
| A | 0 | 5104 | 1 |
| B | 0 | 5126 | 1 |
| C | 0 | 5140 | 1 |
| D | 0 | 16874 | 1 |
| Quadrant | Total seconds | Saturated seconds | Saturation percentage |
|---|---|---|---|
| A | 2405 | 16 | 0.665281% |
| B | 2406 | 36 | 1.496259% |
| C | 2406 | 66 | 2.743142% |
| D | 2406 | 1763 | 73.275145% |
Noise dominated data is calculated using 1-second bins in cleaned event files. If a bin has >2000 counts, and if more than 50% of those come from <1% of pixels, then it is considered to be noise-dominated and hence unusable.
| Quadrant | # 1 sec bins | Bins with >0 counts | Bins with >2000 counts | High rate bins dominated by noise | Noise dominated (total time) | Noise dominated (detector-on time) | Marked lightcurve |
|---|---|---|---|---|---|---|---|
| A | 2850 | 2406 | 0 | 0 | 0.00% | 0.00% | 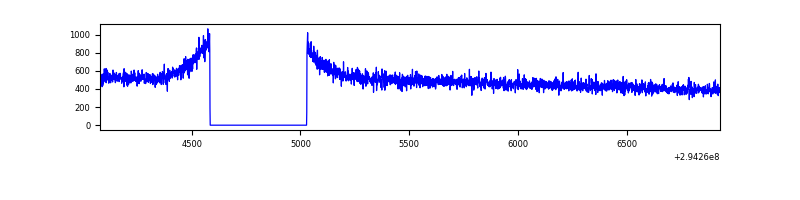 |
| B | 2851 | 2407 | 0 | 0 | 0.00% | 0.00% | 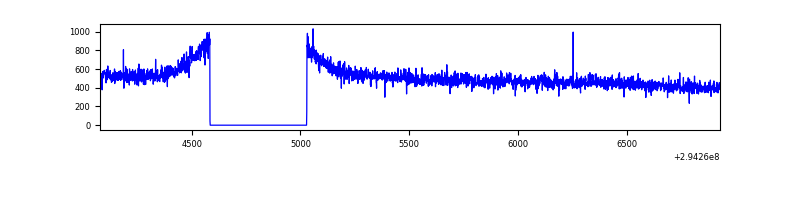 |
| C | 2851 | 2407 | 0 | 0 | 0.00% | 0.00% | 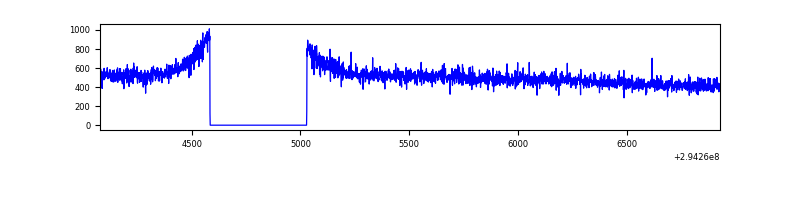 |
| D | 2851 | 2406 | 1650 | 1650 | 57.87% | 68.58% | 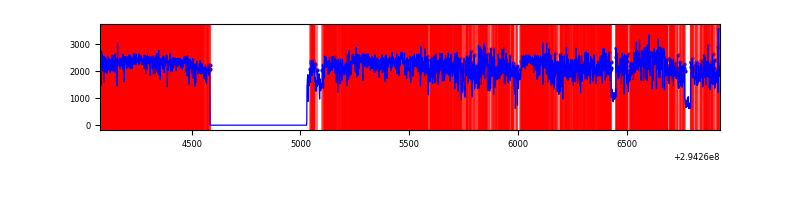 |
Top three noisy pixels from each quadrant. If the there are fewer than three noisy pixels in the level2.evt file, extra rows are filled as -1
| Pixel properties | Quadrant properties | ||||||
|---|---|---|---|---|---|---|---|
| Quadrant | DetID | PixID | Counts | Sigma | Mean | Median | Sigma |
| A | 11 | 29 | 2731 | 37.58 | 308 | 300 | 64.7 |
| A | 13 | 254 | 2606 | 35.65 | 308 | 300 | 64.7 |
| A | 3 | 137 | 2559 | 34.92 | 308 | 300 | 64.7 |
| B | 12 | 111 | 7565 | 117.38 | 308 | 298 | 61.9 |
| B | 11 | 111 | 6746 | 104.15 | 308 | 298 | 61.9 |
| B | 14 | 111 | 5904 | 90.55 | 308 | 298 | 61.9 |
| C | 14 | 238 | 46819 | 629.42 | 302 | 303 | 73.9 |
| C | 3 | 233 | 2266 | 26.56 | 302 | 303 | 73.9 |
| C | 13 | 61 | 2064 | 23.83 | 302 | 303 | 73.9 |
| D | 10 | 66 | 3543039 | 67594.03 | 205 | 199 | 52.4 |
| D | 7 | 238 | 624010 | 11901.72 | 205 | 199 | 52.4 |
| D | 1 | 52 | 179257 | 3416.26 | 205 | 199 | 52.4 |
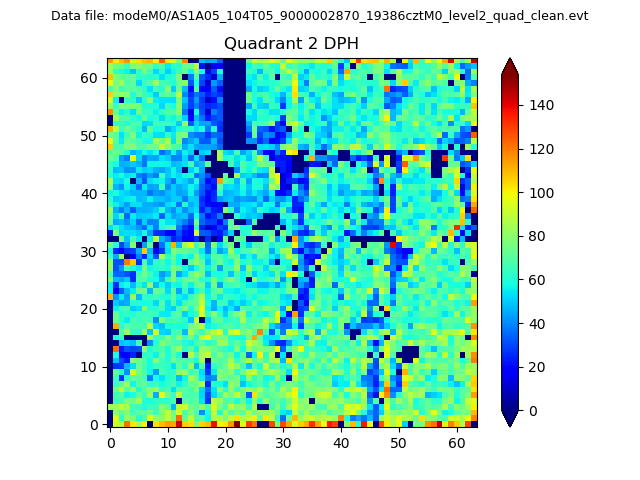
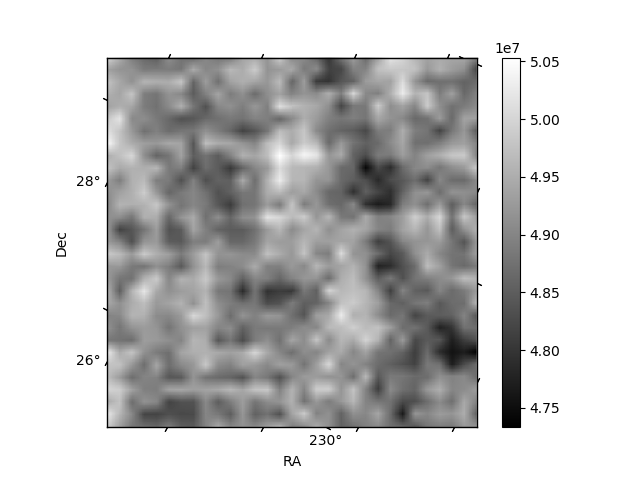
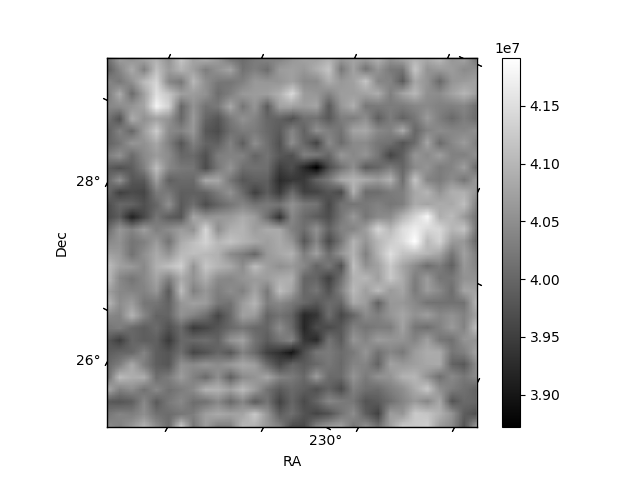
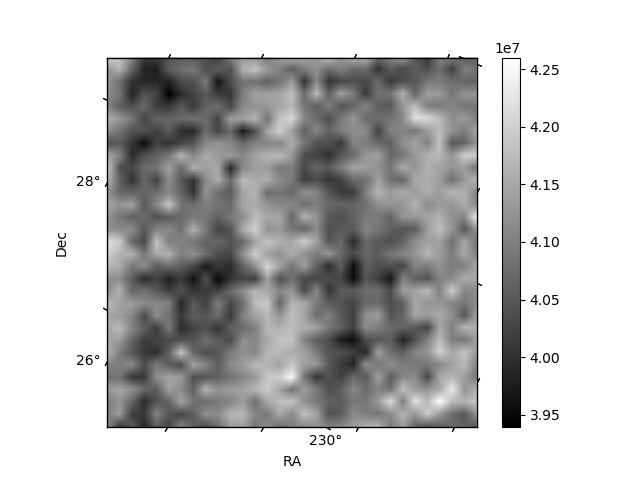
Histogram calculated using DETX and DETY for each event in the final _common_clean file
| Quadrant A | 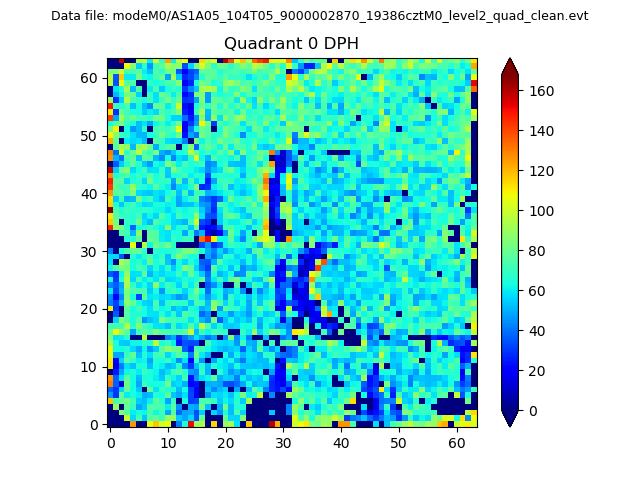 |
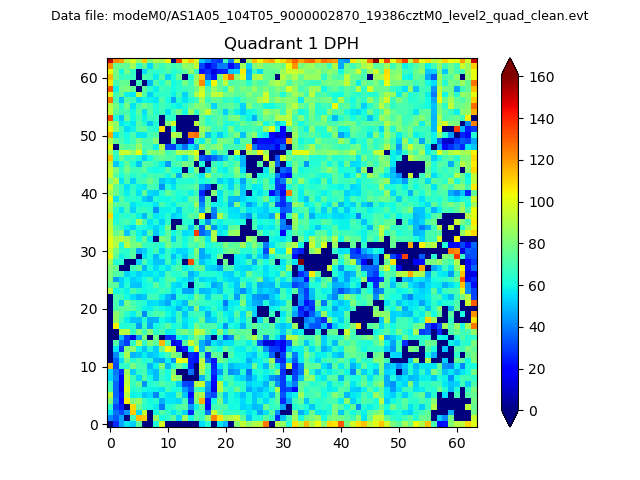 |
Quadrant B |
|---|---|---|---|
| Quadrant D | 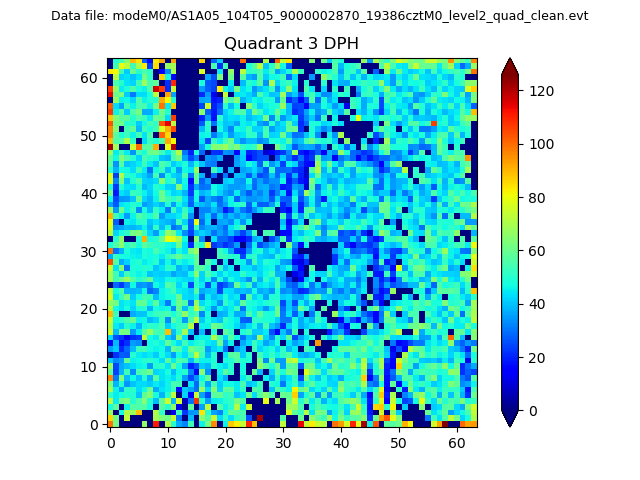 |
 |
Quadrant C |
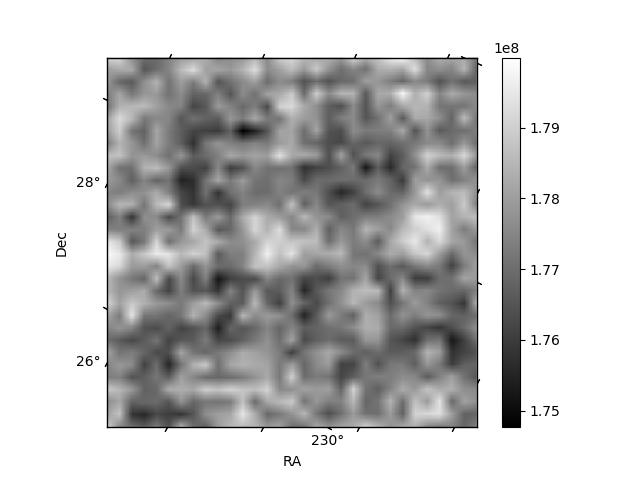
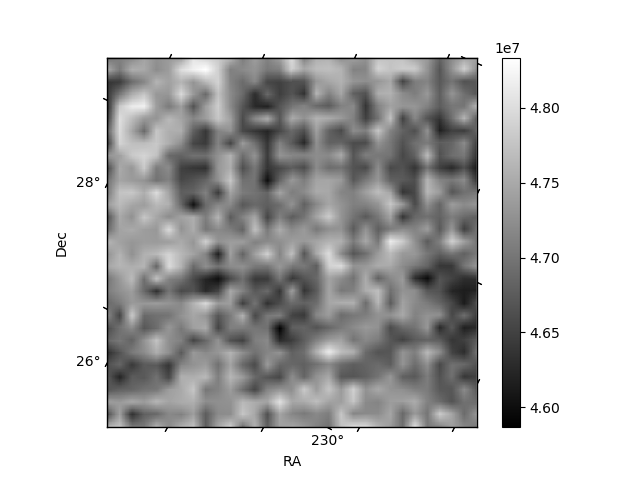
| Plot type | Count rate plots | Images |
|---|---|---|
| Comparison with Poisson distribution Blue bars denote a histogram of data divided into 1 sec bins. Red curve is a Poisson curve with rate = median count rate of data. |
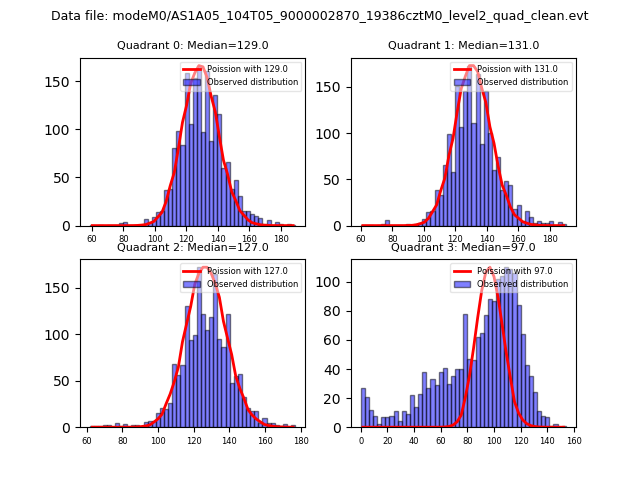 |
 |
| Quadrant-wise count rates Data is divided into 100 sec bins |
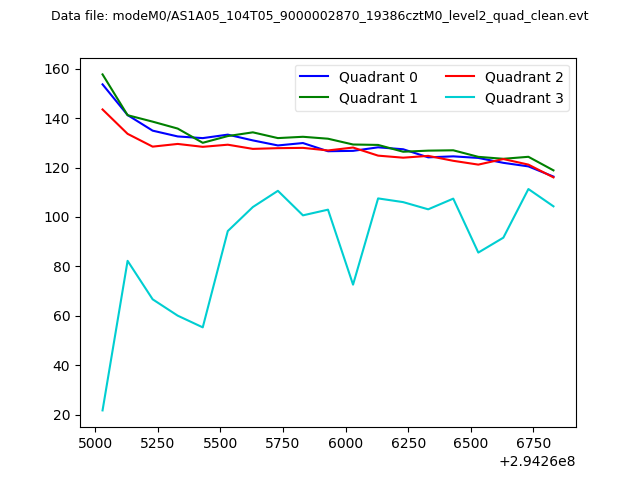 |
|
| Module-wise count rates for Quadrant A Data is divided into 100 sec bins |
 |
 |
| Module-wise count rates for Quadrant B Data is divided into 100 sec bins |
 |
 |
| Module-wise count rates for Quadrant C Data is divided into 100 sec bins |
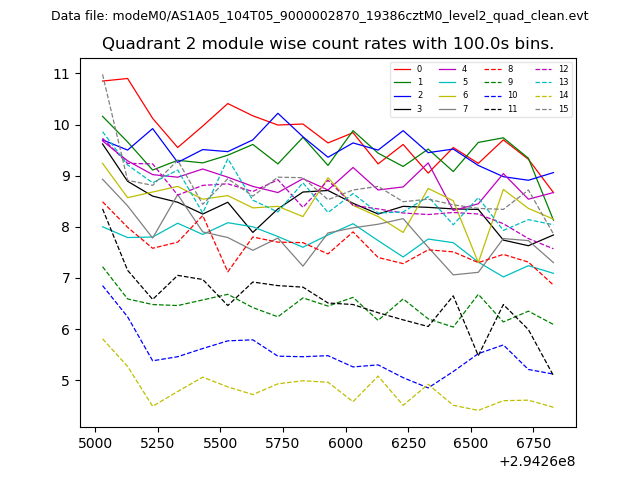 |
 |
| Module-wise count rates for Quadrant D Data is divided into 100 sec bins |
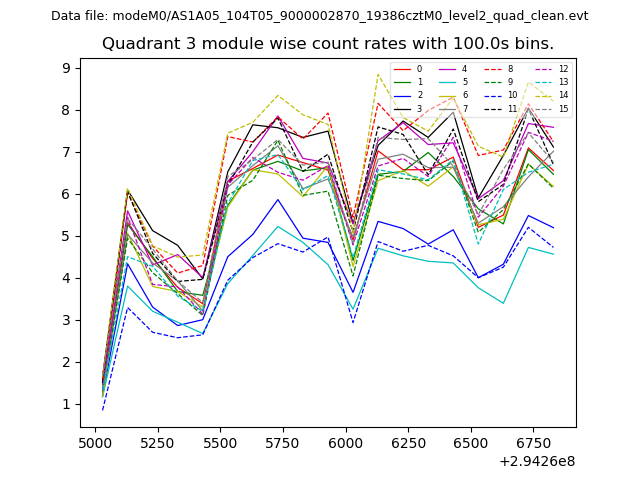 |
 |
| Parameter | Plot |
|---|---|
| CZT HV Monitor | 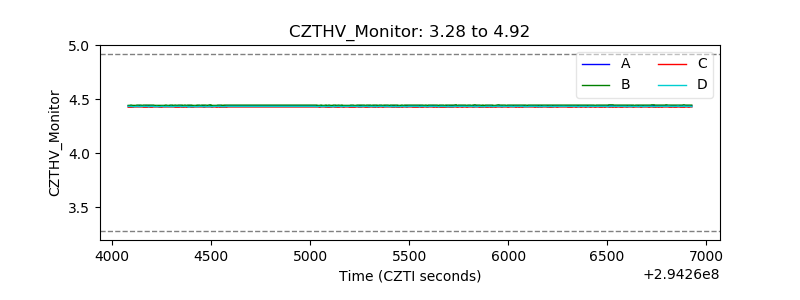 |
| D_VDD | 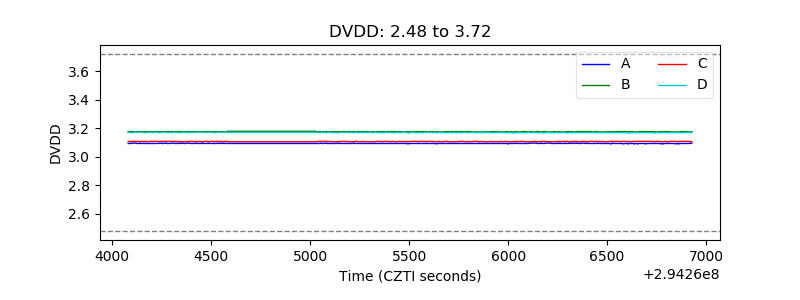 |
| Temperature 1 |  |
| Veto HV Monitor | 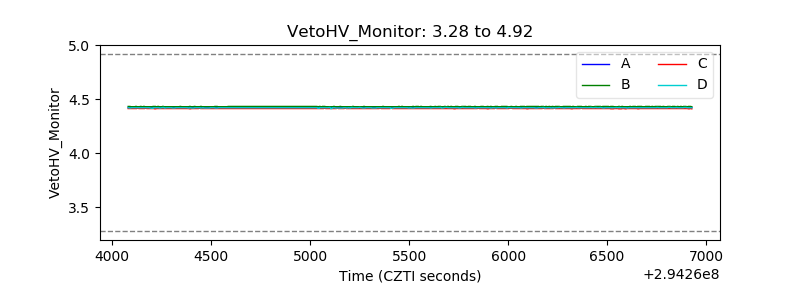 |
| Veto LLD |  |
| Alpha Counter | 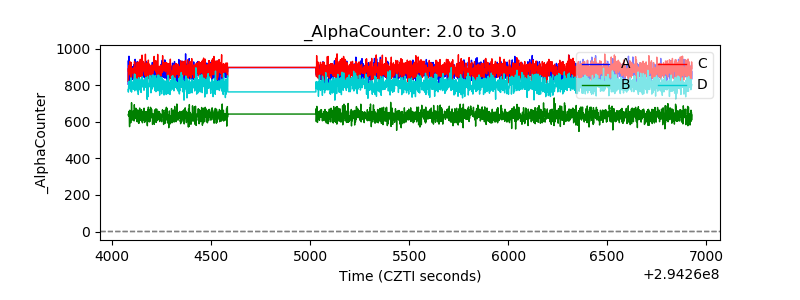 |
| _CPM_Rate | 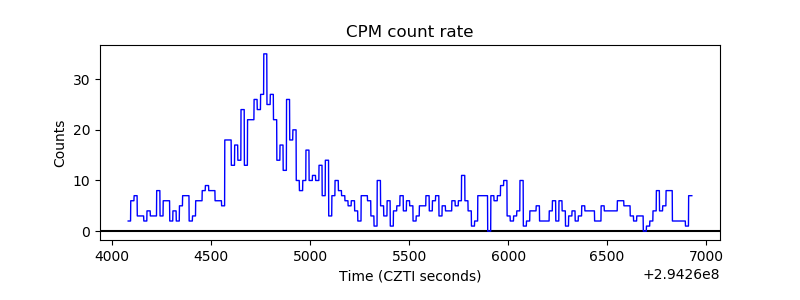 |
| CZT Counter | 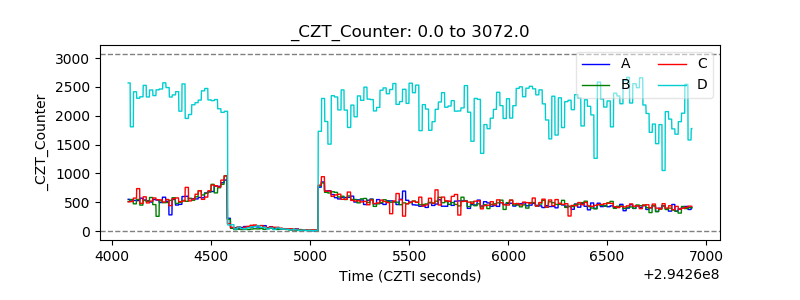 |
| +2.5 Volts monitor |  |
| +5 Volts monitor | 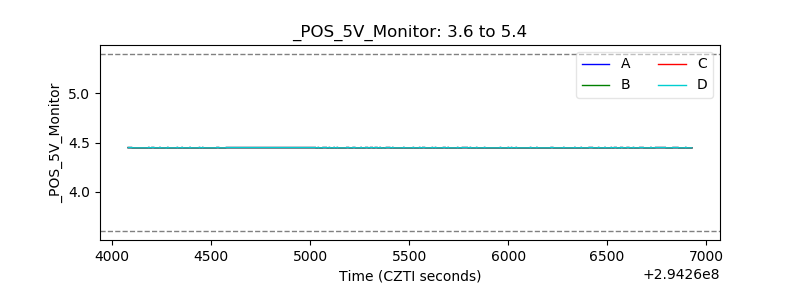 |
| _ROLL_ROT | 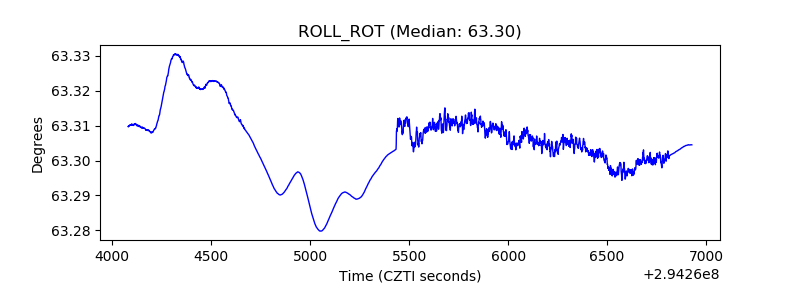 |
| _Roll_DEC | 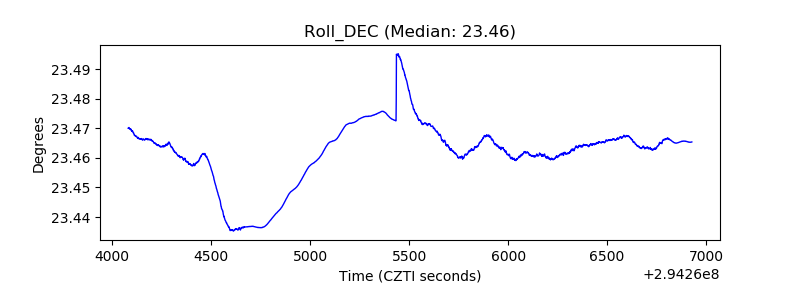 |
| _Roll_RA | 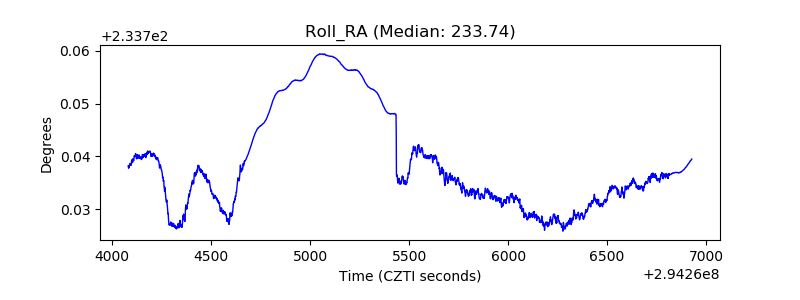 |
| Veto Counter |  |