| Param | Original file | Final file |
|---|---|---|
| Filename | modeM0/AS1A05_208T03_9000002874cztM0_level2.fits | modeM0/AS1A05_208T03_9000002874cztM0_level2_quad_clean.evt |
| Size (bytes) | 551,427,840 | 442,192,320 |
| Size | 525.9 MB | 421.7 MB |
| Events in quadrant A | 3,614,308 | 2,893,251 |
| Events in quadrant B | 3,436,328 | 2,882,896 |
| Events in quadrant C | 3,473,878 | 2,717,908 |
| Events in quadrant D | 2,258,158 | 992,533 |
| Mode M9 | |||
|---|---|---|---|
| Quadrant | BADHDUFLAG | Total packets | Discarded packets |
| A | 0 | 108 | 0 |
| B | 0 | 108 | 0 |
| C | 0 | 108 | 0 |
| D | 0 | 108 | 0 |
| Mode M0 | |||
|---|---|---|---|
| Quadrant | BADHDUFLAG | Total packets | Discarded packets |
| A | 0 | 119839 | 0 |
| B | 0 | 119629 | 0 |
| C | 0 | 119017 | 0 |
| D | 0 | 347073 | 0 |
| Mode SS | |||
|---|---|---|---|
| Quadrant | BADHDUFLAG | Total packets | Discarded packets |
| A | 0 | 1160 | 0 |
| B | 0 | 1160 | 0 |
| C | 0 | 1160 | 0 |
| D | 0 | 1160 | 0 |
| Quadrant | Total seconds | Saturated seconds | Saturation percentage |
|---|---|---|---|
| A | 56887 | 577 | 1.014291% |
| B | 56887 | 621 | 1.091638% |
| C | 56887 | 802 | 1.409812% |
| D | 56887 | 32228 | 56.652662% |
Noise dominated data is calculated using 1-second bins in cleaned event files. If a bin has >2000 counts, and if more than 50% of those come from <1% of pixels, then it is considered to be noise-dominated and hence unusable.
| Quadrant | # 1 sec bins | Bins with >0 counts | Bins with >2000 counts | High rate bins dominated by noise | Noise dominated (total time) | Noise dominated (detector-on time) | Marked lightcurve |
|---|---|---|---|---|---|---|---|
| A | 67677 | 56879 | 0 | 0 | 0.00% | 0.00% | 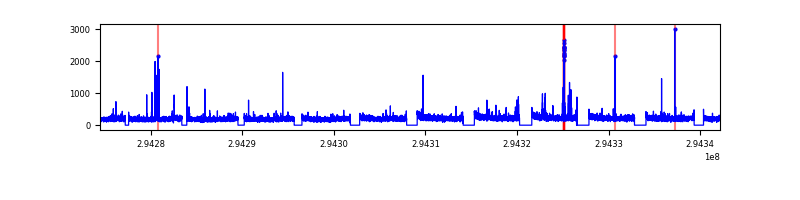 |
| B | 67677 | 56876 | 0 | 0 | 0.00% | 0.00% | 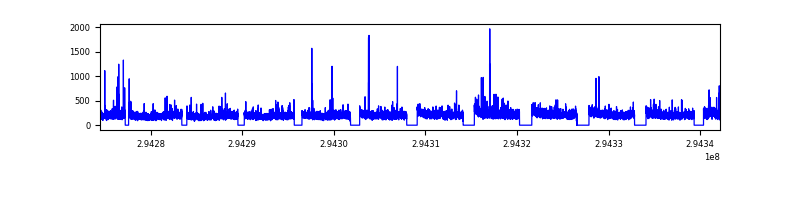 |
| C | 67677 | 56878 | 0 | 0 | 0.00% | 0.00% | 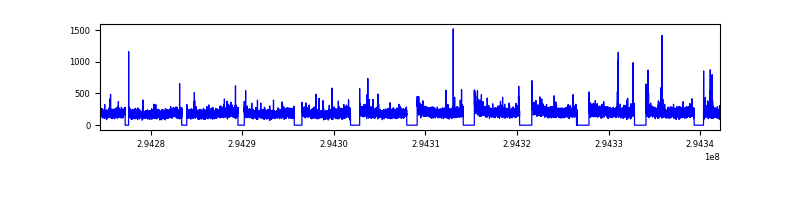 |
| D | 67676 | 56781 | 0 | 0 | 0.00% | 0.00% | 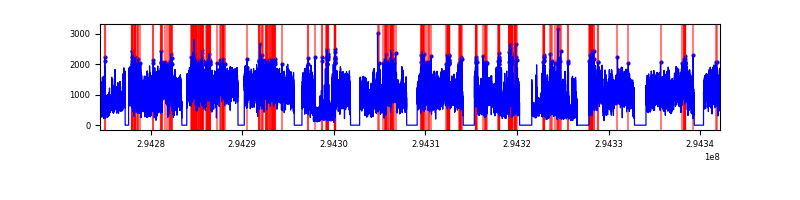 |
Top three noisy pixels from each quadrant. If the there are fewer than three noisy pixels in the level2.evt file, extra rows are filled as -1
| Pixel properties | Quadrant properties | ||||||
|---|---|---|---|---|---|---|---|
| Quadrant | DetID | PixID | Counts | Sigma | Mean | Median | Sigma |
| A | 0 | 29 | 3431 | 11.16 | 941 | 887 | 227.9 |
| A | 7 | 110 | 2922 | 8.93 | 941 | 887 | 227.9 |
| A | 9 | 19 | 2790 | 8.35 | 941 | 887 | 227.9 |
| B | 2 | 9 | 2784 | 10.9 | 908 | 869 | 175.7 |
| B | 2 | 8 | 2282 | 8.04 | 908 | 869 | 175.7 |
| B | 3 | 17 | 2260 | 7.92 | 908 | 869 | 175.7 |
| C | 3 | 126 | 2365 | 6.44 | 918 | 862 | 233.5 |
| C | 12 | 241 | 2350 | 6.37 | 918 | 862 | 233.5 |
| C | 12 | 250 | 2343 | 6.34 | 918 | 862 | 233.5 |
| D | 15 | 46 | 1608 | 6.01 | 644 | 588 | 169.5 |
| D | 3 | 14 | 1595 | 5.94 | 644 | 588 | 169.5 |
| D | 10 | 190 | 1585 | 5.88 | 644 | 588 | 169.5 |
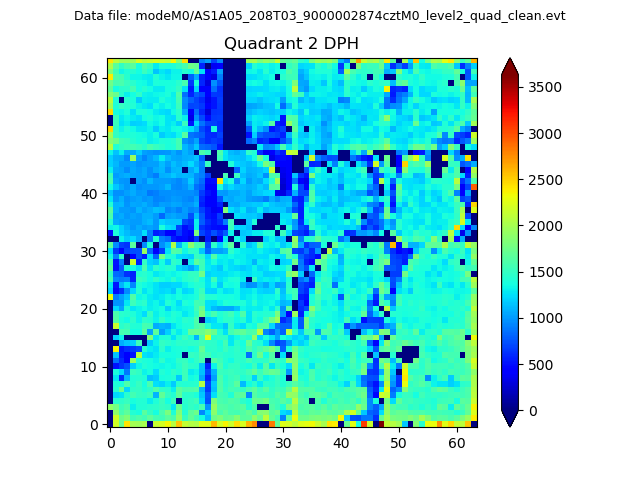
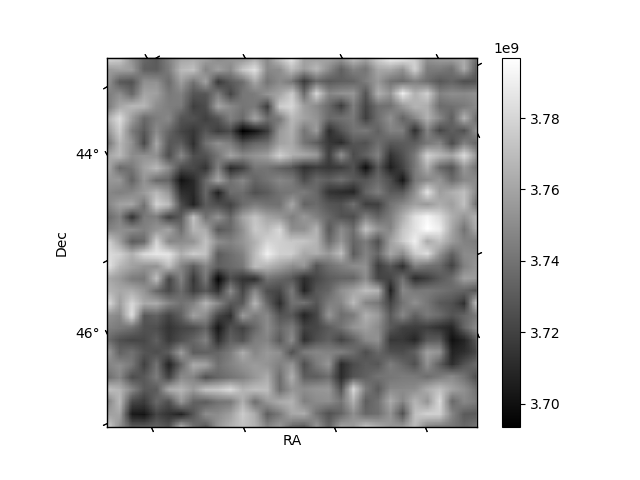
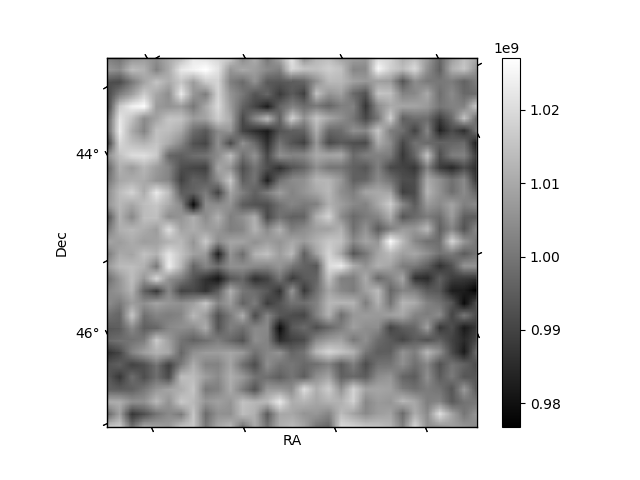
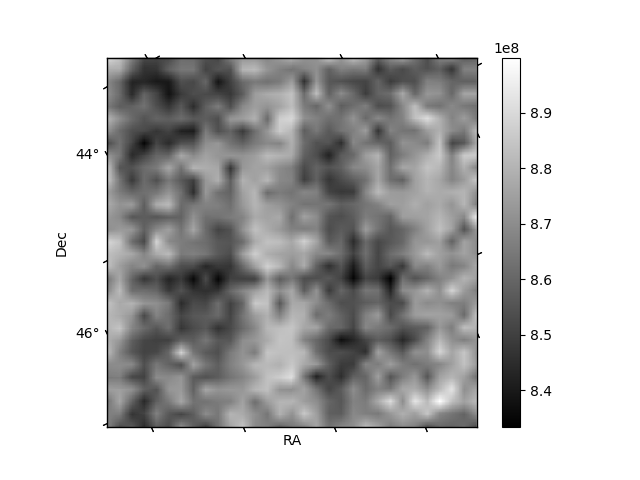
Histogram calculated using DETX and DETY for each event in the final _common_clean file
| Quadrant A | 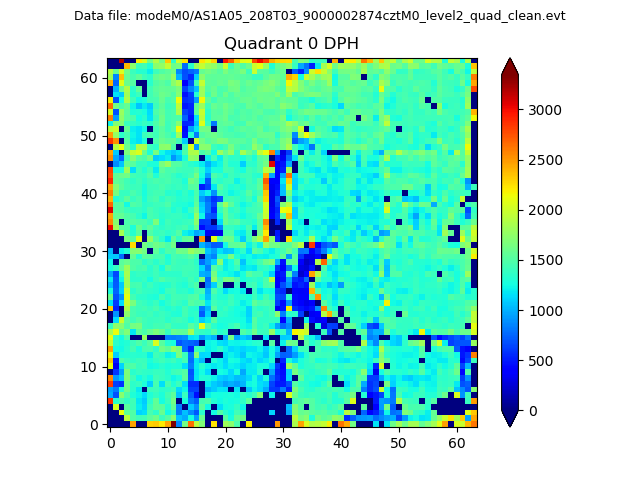 |
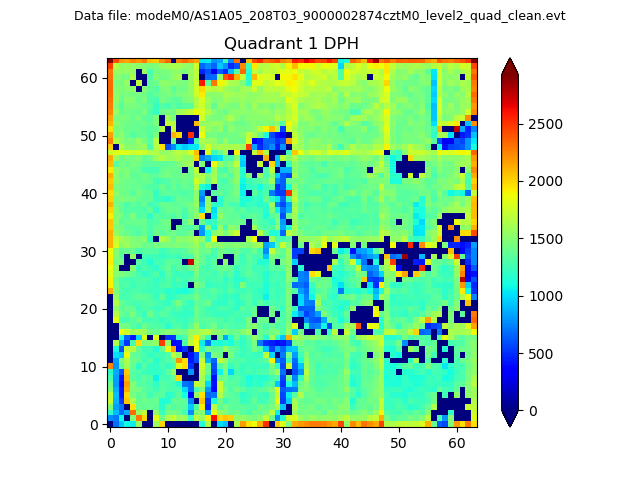 |
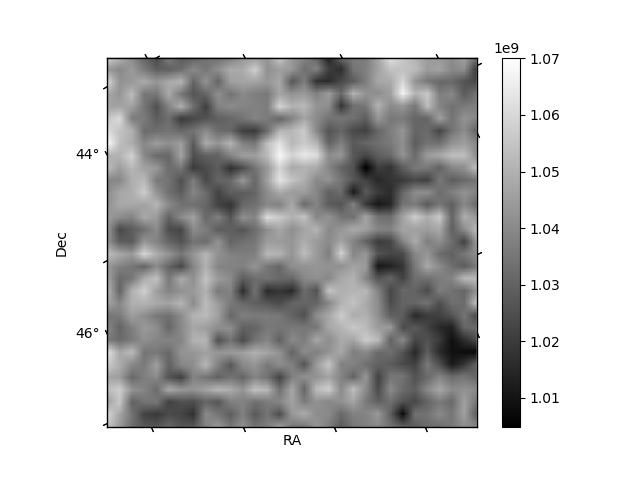
Quadrant B |
|---|---|---|---|
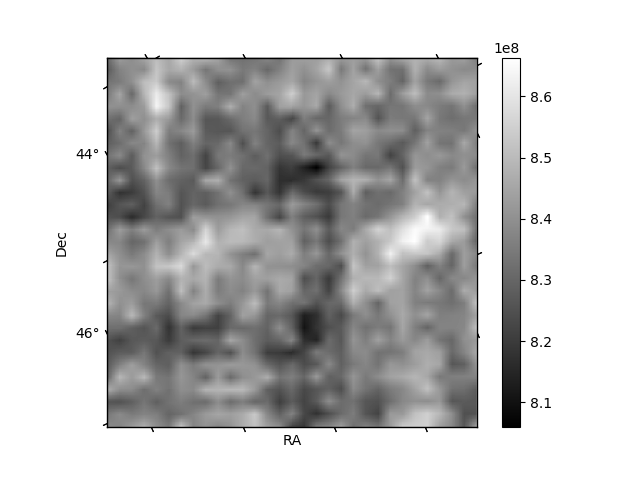
| Quadrant D | 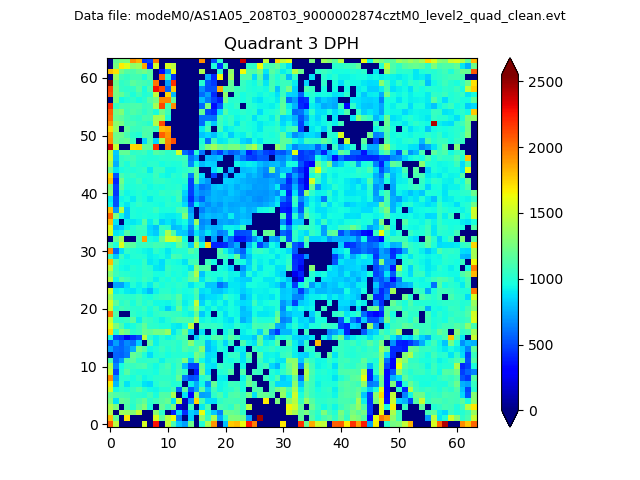 |
 |
Quadrant C |
| Plot type | Count rate plots | Images |
|---|---|---|
| Comparison with Poisson distribution Blue bars denote a histogram of data divided into 1 sec bins. Red curve is a Poisson curve with rate = median count rate of data. |
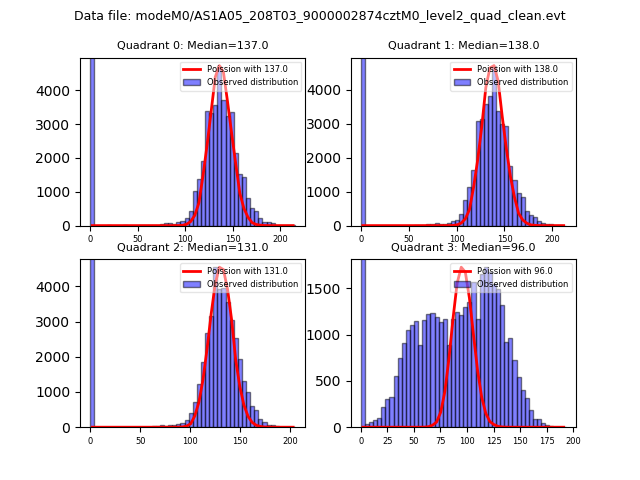 |
 |
| Quadrant-wise count rates Data is divided into 100 sec bins |
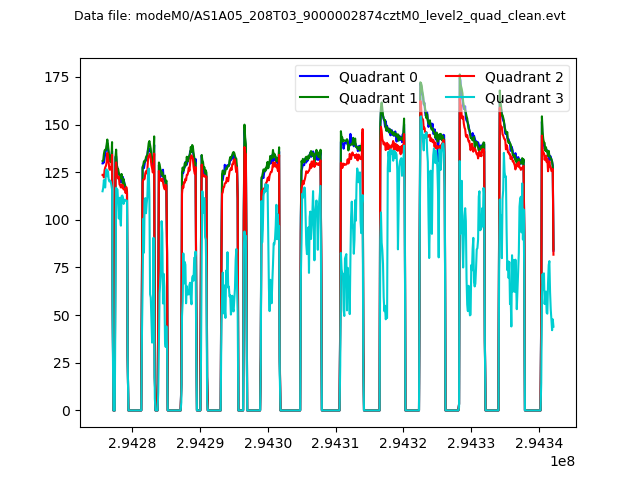 |
|
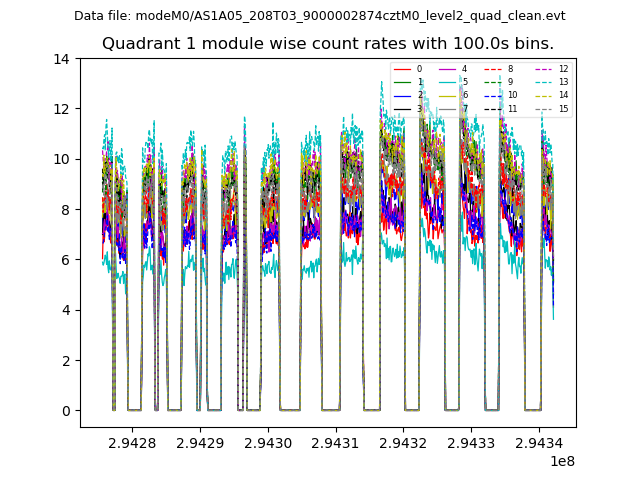
| Module-wise count rates for Quadrant A Data is divided into 100 sec bins |
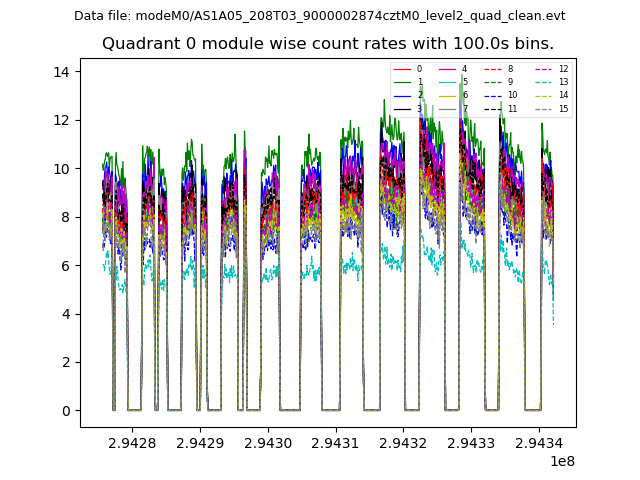 |
 |
| Module-wise count rates for Quadrant B Data is divided into 100 sec bins |
 |
 |
| Module-wise count rates for Quadrant C Data is divided into 100 sec bins |
 |
 |
| Module-wise count rates for Quadrant D Data is divided into 100 sec bins |
 |
 |
| Parameter | Plot |
|---|---|
| CZT HV Monitor | 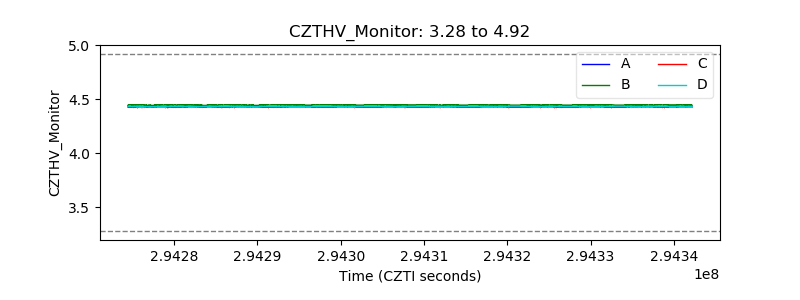 |
| D_VDD | 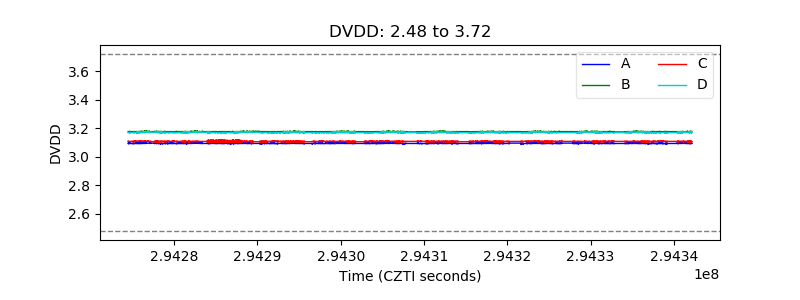 |
| Temperature 1 |  |
| Veto HV Monitor | 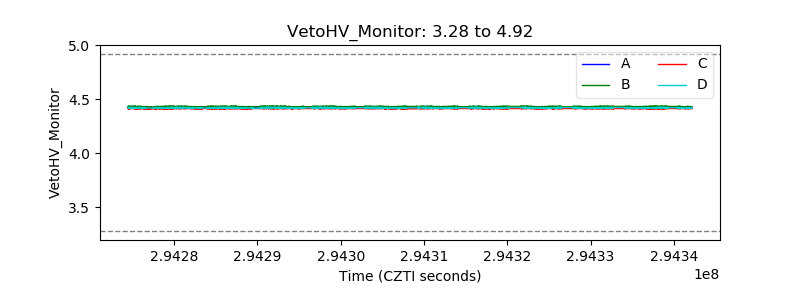 |
| Veto LLD | 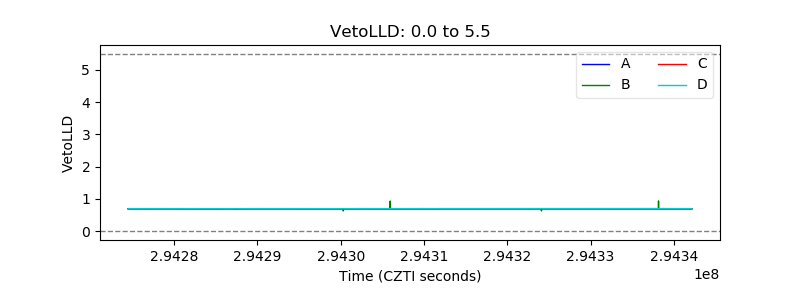 |
| Alpha Counter |  |
| _CPM_Rate | 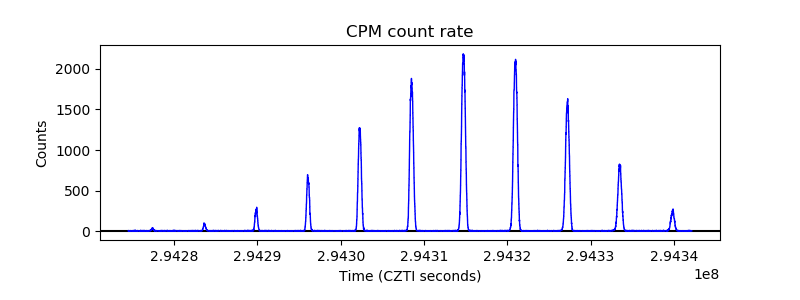 |
| CZT Counter |  |
| +2.5 Volts monitor | 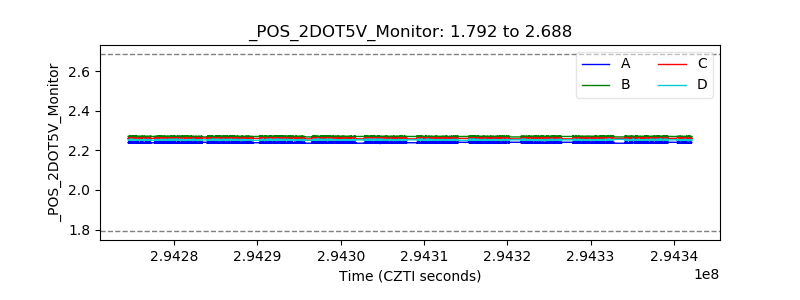 |
| +5 Volts monitor |  |
| _ROLL_ROT | 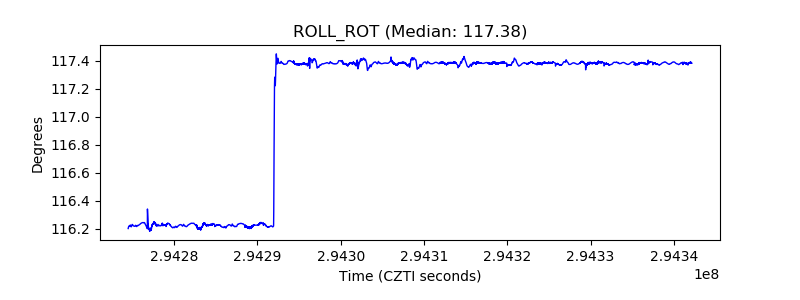 |
| _Roll_DEC | 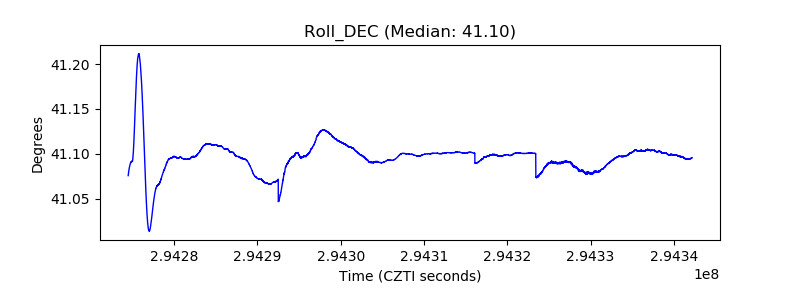 |
| _Roll_RA |  |
| Veto Counter | 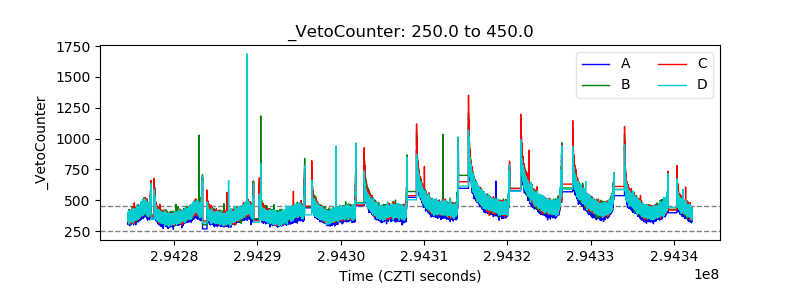 |