| Param | Original file | Final file |
|---|---|---|
| Filename | modeM0/AS1A05_208T03_9000002874_19389cztM0_level2.evt | modeM0/AS1A05_208T03_9000002874_19389cztM0_level2_quad_clean.evt |
| Size (bytes) | 1,479,444,480 | 151,925,760 |
| Size | 1.4 GB | 144.9 MB |
| Events in quadrant A | 5,969,799 | 1,026,888 |
| Events in quadrant B | 5,974,647 | 1,035,659 |
| Events in quadrant C | 5,984,364 | 990,369 |
| Events in quadrant D | 26,009,009 | 657,414 |
| Mode M9 | |||
|---|---|---|---|
| Quadrant | BADHDUFLAG | Total packets | Discarded packets |
| A | 0 | 15 | 0 |
| B | 0 | 16 | 0 |
| C | 0 | 16 | 0 |
| D | 0 | 16 | 0 |
| Mode M0 | |||
|---|---|---|---|
| Quadrant | BADHDUFLAG | Total packets | Discarded packets |
| A | 0 | 26359 | 3 |
| B | 0 | 26168 | 3 |
| C | 0 | 26244 | 3 |
| D | 0 | 86079 | 3 |
| Mode SS | |||
|---|---|---|---|
| Quadrant | BADHDUFLAG | Total packets | Discarded packets |
| A | 0 | 264 | 0 |
| B | 0 | 264 | 0 |
| C | 0 | 264 | 0 |
| D | 0 | 264 | 0 |
| Quadrant | Total seconds | Saturated seconds | Saturation percentage |
|---|---|---|---|
| A | 12854 | 55 | 0.427882% |
| B | 12853 | 73 | 0.567961% |
| C | 12853 | 103 | 0.801369% |
| D | 12853 | 8364 | 65.074302% |
Noise dominated data is calculated using 1-second bins in cleaned event files. If a bin has >2000 counts, and if more than 50% of those come from <1% of pixels, then it is considered to be noise-dominated and hence unusable.
| Quadrant | # 1 sec bins | Bins with >0 counts | Bins with >2000 counts | High rate bins dominated by noise | Noise dominated (total time) | Noise dominated (detector-on time) | Marked lightcurve |
|---|---|---|---|---|---|---|---|
| A | 14099 | 12856 | 10 | 10 | 0.07% | 0.08% | 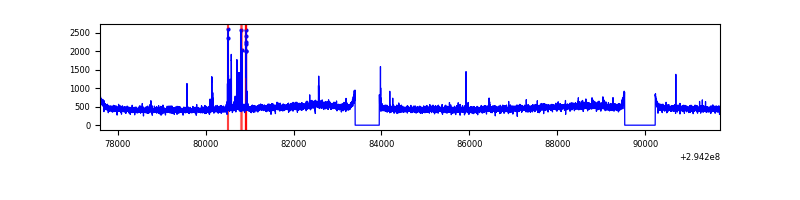 |
| B | 14098 | 12854 | 0 | 0 | 0.00% | 0.00% | 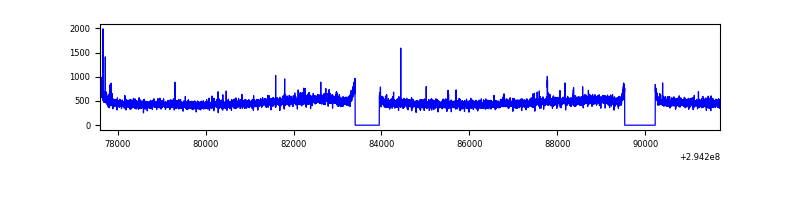 |
| C | 14098 | 12854 | 0 | 0 | 0.00% | 0.00% | 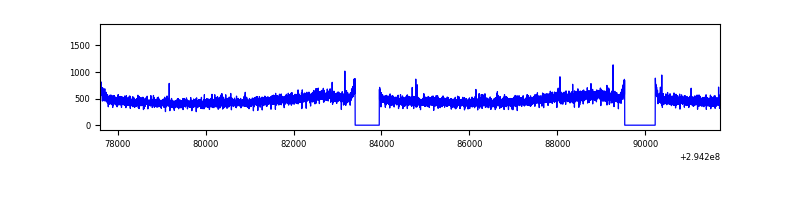 |
| D | 14097 | 12852 | 7956 | 7956 | 56.44% | 61.90% | 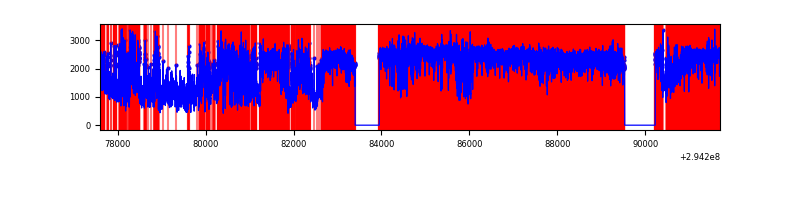 |
Top three noisy pixels from each quadrant. If the there are fewer than three noisy pixels in the level2.evt file, extra rows are filled as -1
| Pixel properties | Quadrant properties | ||||||
|---|---|---|---|---|---|---|---|
| Quadrant | DetID | PixID | Counts | Sigma | Mean | Median | Sigma |
| A | 5 | 16 | 94326 | 303.94 | 1517 | 1482 | 305.5 |
| A | 12 | 96 | 31348 | 97.77 | 1517 | 1482 | 305.5 |
| A | 13 | 254 | 17738 | 53.22 | 1517 | 1482 | 305.5 |
| B | 12 | 111 | 36078 | 119.67 | 1512 | 1472 | 289.2 |
| B | 11 | 111 | 31708 | 104.55 | 1512 | 1472 | 289.2 |
| B | 14 | 111 | 27730 | 90.8 | 1512 | 1472 | 289.2 |
| C | 14 | 238 | 224147 | 649.48 | 1458 | 1463 | 342.9 |
| C | 3 | 233 | 59697 | 169.85 | 1458 | 1463 | 342.9 |
| C | 8 | 128 | 10468 | 26.26 | 1458 | 1463 | 342.9 |
| D | 10 | 66 | 14940427 | 59192.43 | 1038 | 1007 | 252.4 |
| D | 7 | 238 | 4776218 | 18920.17 | 1038 | 1007 | 252.4 |
| D | 1 | 52 | 2317782 | 9179.44 | 1038 | 1007 | 252.4 |
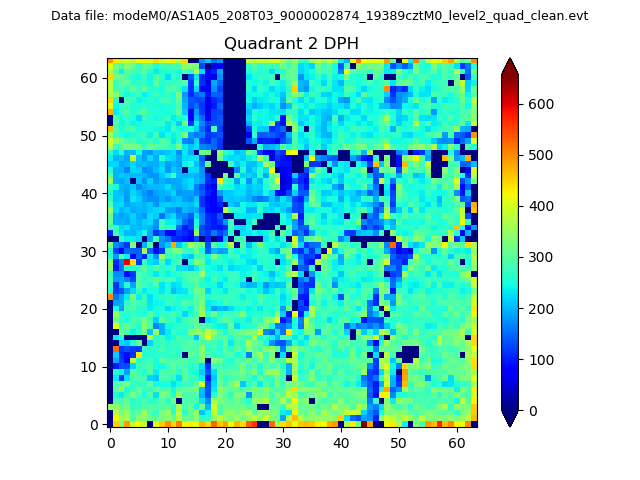
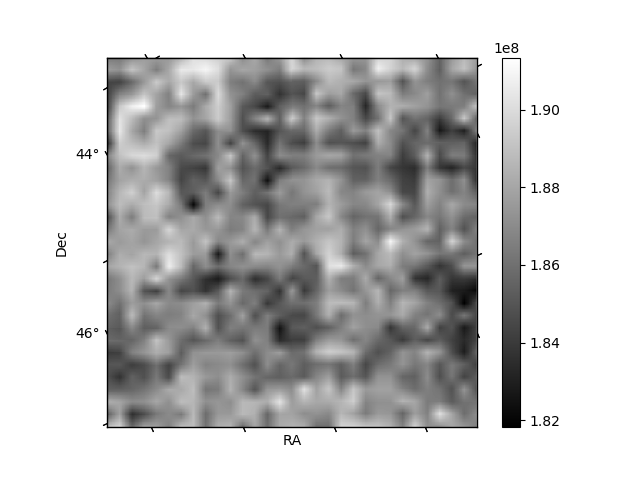
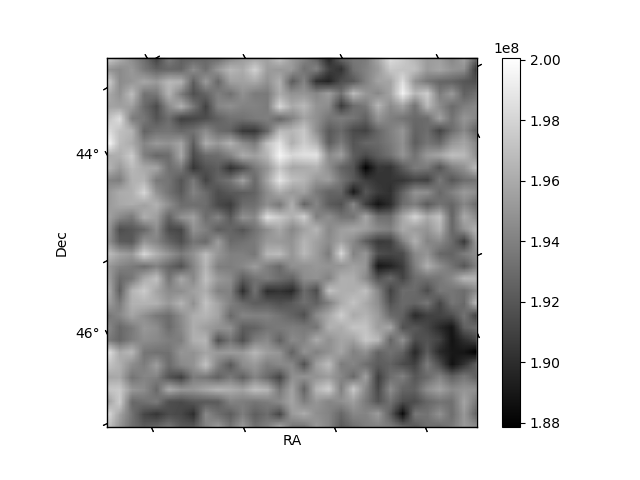
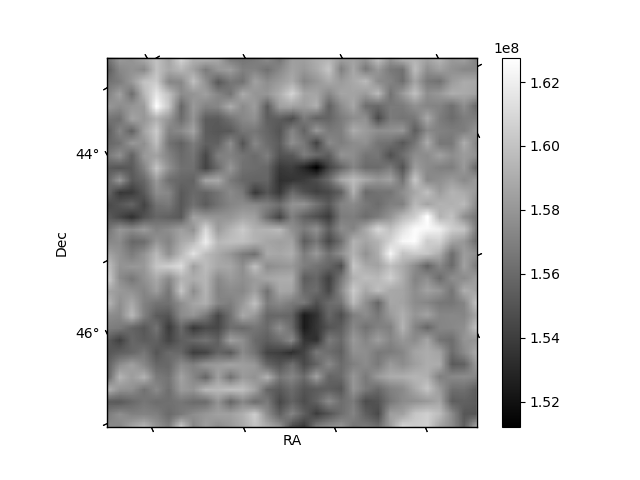
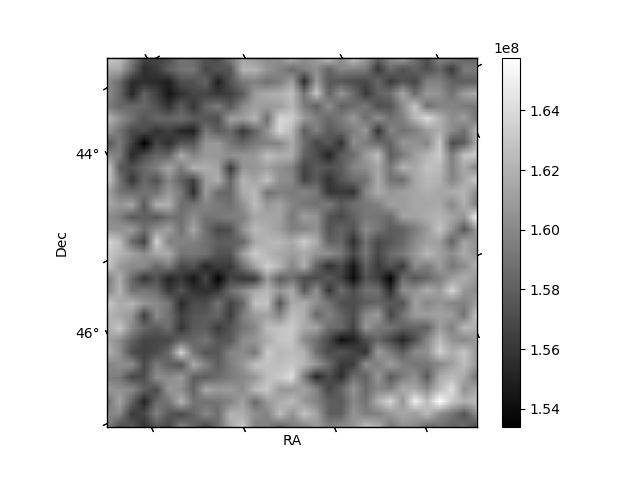
Histogram calculated using DETX and DETY for each event in the final _common_clean file
| Quadrant A | 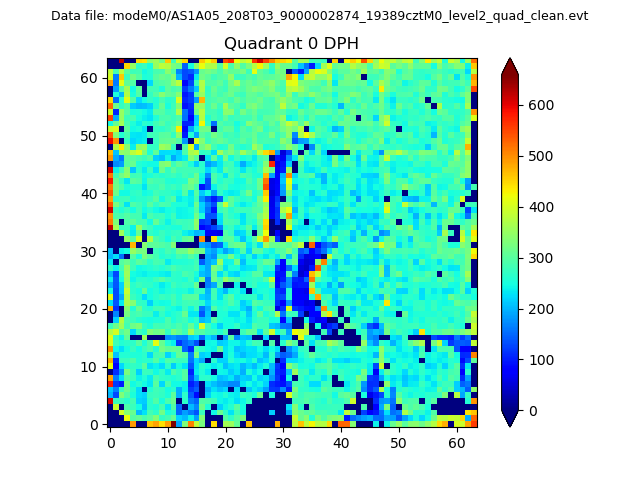 |
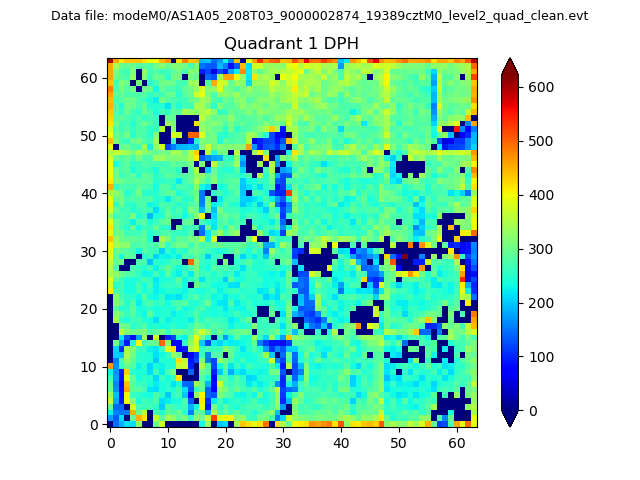 |
Quadrant B |
|---|---|---|---|
| Quadrant D | 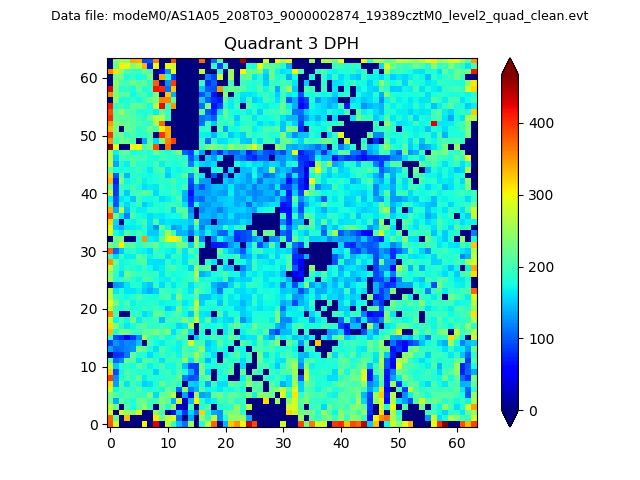 |
 |
Quadrant C |
| Plot type | Count rate plots | Images |
|---|---|---|
| Comparison with Poisson distribution Blue bars denote a histogram of data divided into 1 sec bins. Red curve is a Poisson curve with rate = median count rate of data. |
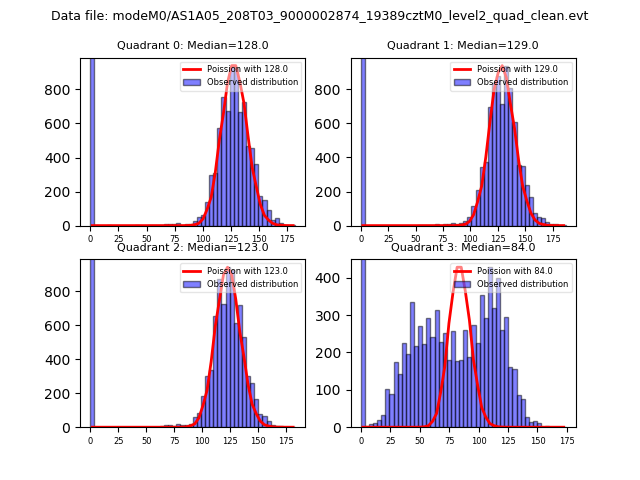 |
 |
| Quadrant-wise count rates Data is divided into 100 sec bins |
 |
|
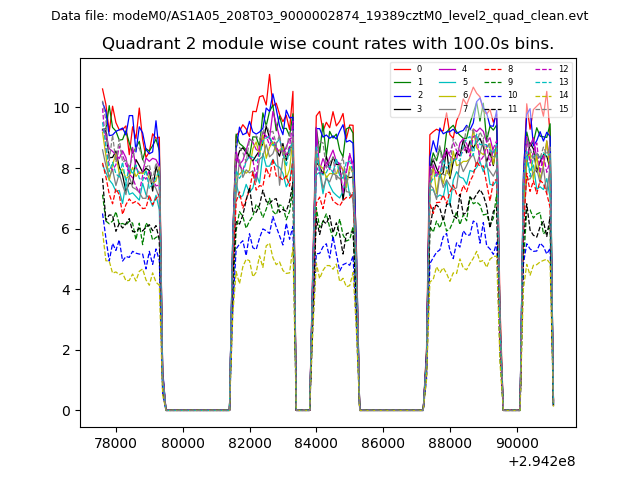
| Module-wise count rates for Quadrant A Data is divided into 100 sec bins |
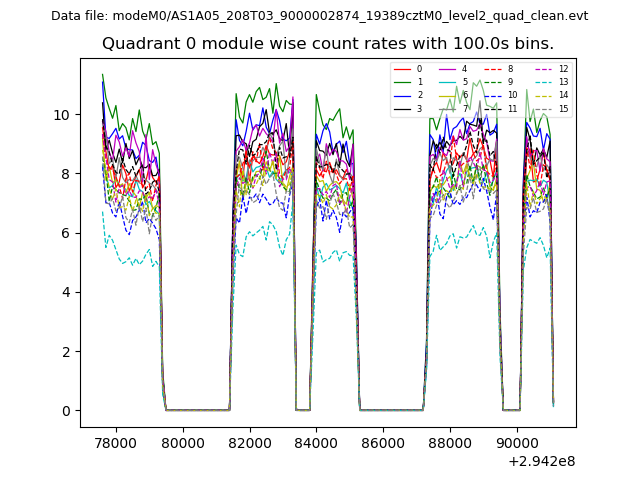 |
 |
| Module-wise count rates for Quadrant B Data is divided into 100 sec bins |
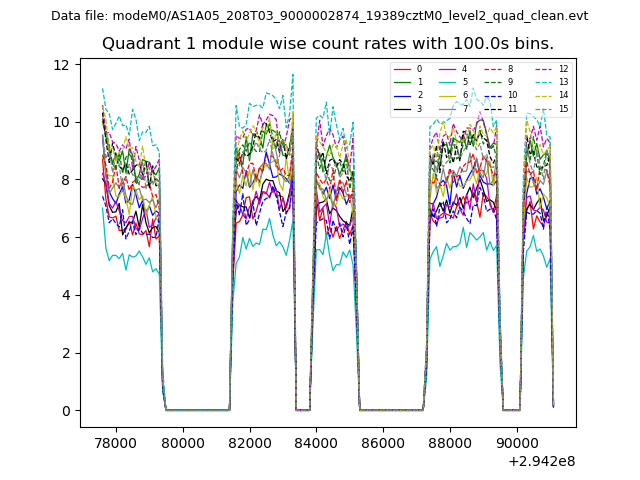 |
 |
| Module-wise count rates for Quadrant C Data is divided into 100 sec bins |
 |
 |
| Module-wise count rates for Quadrant D Data is divided into 100 sec bins |
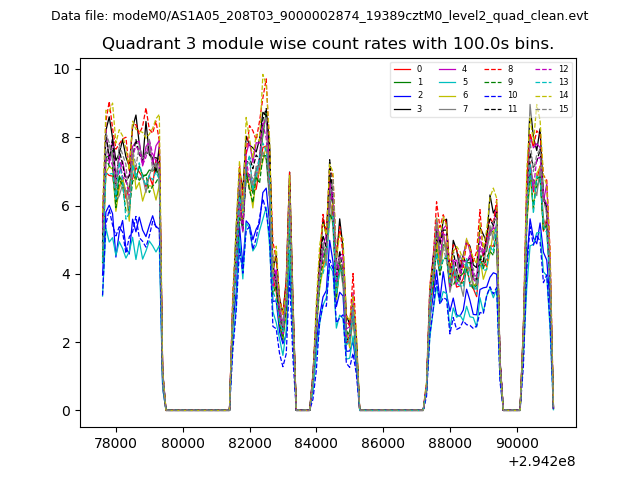 |
 |
| Parameter | Plot |
|---|---|
| CZT HV Monitor | 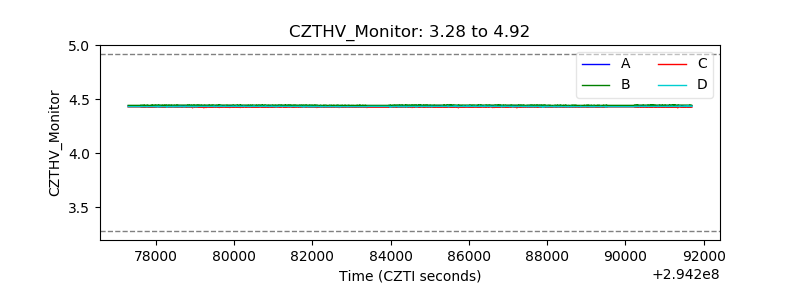 |
| D_VDD | 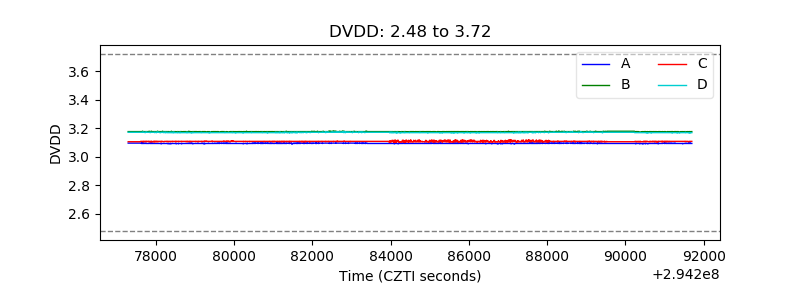 |
| Temperature 1 | 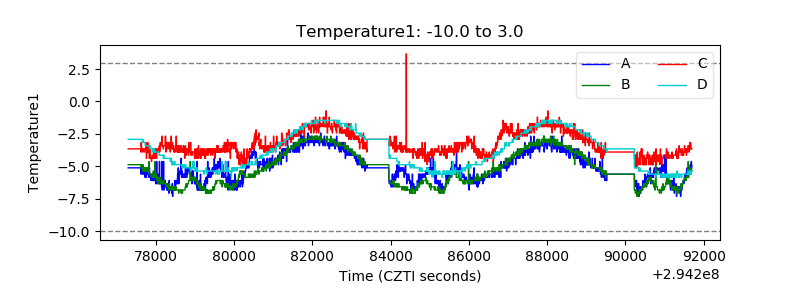 |
| Veto HV Monitor | 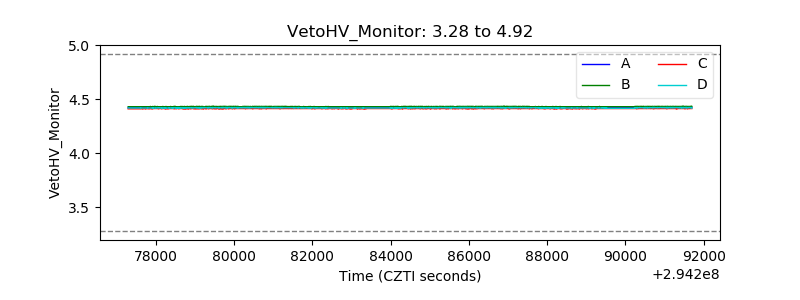 |
| Veto LLD | 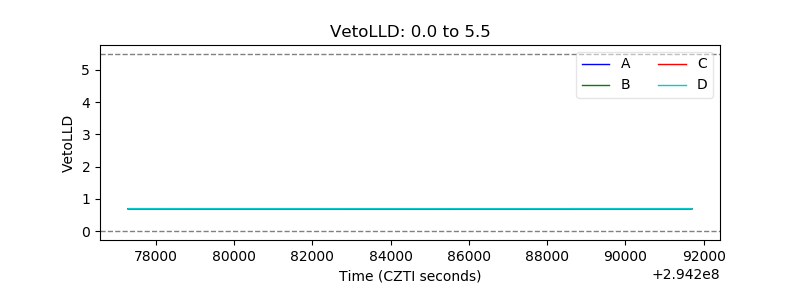 |
| Alpha Counter | 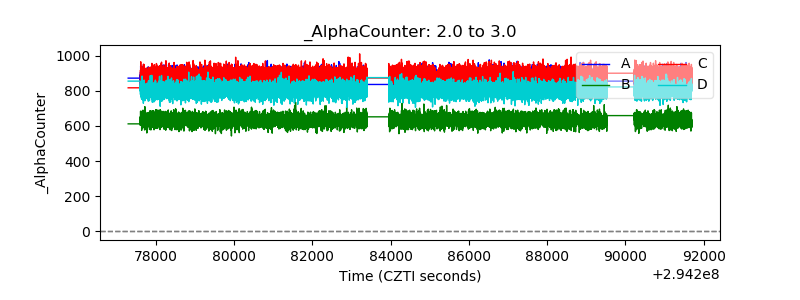 |
| _CPM_Rate | 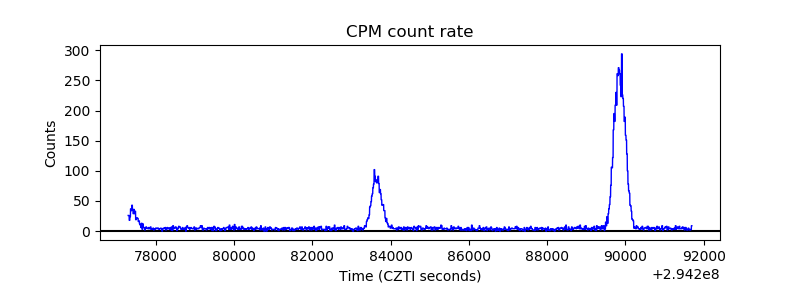 |
| CZT Counter |  |
| +2.5 Volts monitor |  |
| +5 Volts monitor |  |
| _ROLL_ROT | 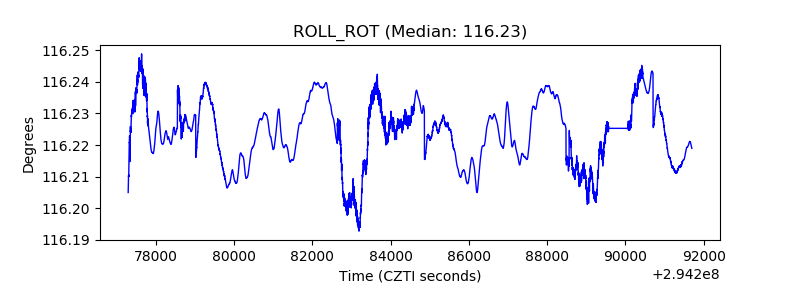 |
| _Roll_DEC | 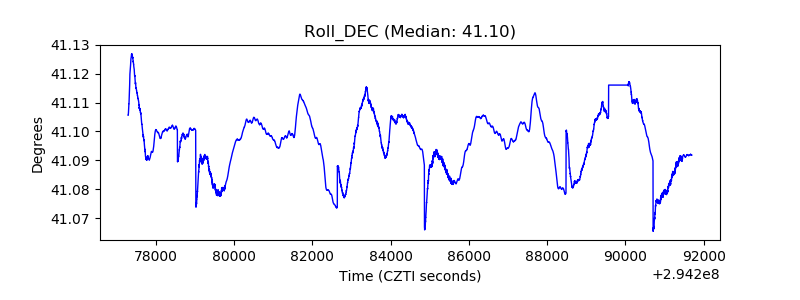 |
| _Roll_RA |  |
| Veto Counter | 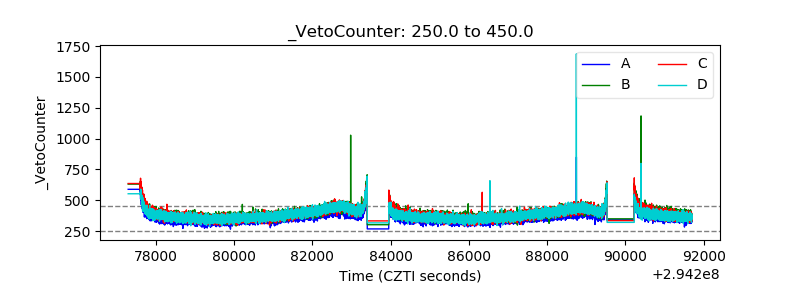 |