| Param | Original file | Final file |
|---|---|---|
| Filename | modeM0/AS1A05_208T03_9000002874_19390cztM0_level2.evt | modeM0/AS1A05_208T03_9000002874_19390cztM0_level2_quad_clean.evt |
| Size (bytes) | 779,100,480 | 65,427,840 |
| Size | 743.0 MB | 62.4 MB |
| Events in quadrant A | 3,007,839 | 434,732 |
| Events in quadrant B | 3,064,814 | 438,052 |
| Events in quadrant C | 3,022,635 | 417,919 |
| Events in quadrant D | 14,060,448 | 236,798 |
| Mode M9 | |||
|---|---|---|---|
| Quadrant | BADHDUFLAG | Total packets | Discarded packets |
| A | 0 | 9 | 0 |
| B | 0 | 9 | 0 |
| C | 0 | 9 | 0 |
| D | 0 | 9 | 0 |
| Mode M0 | |||
|---|---|---|---|
| Quadrant | BADHDUFLAG | Total packets | Discarded packets |
| A | 0 | 13149 | 1 |
| B | 0 | 13188 | 1 |
| C | 0 | 13142 | 2 |
| D | 0 | 46179 | 1 |
| Mode SS | |||
|---|---|---|---|
| Quadrant | BADHDUFLAG | Total packets | Discarded packets |
| A | 0 | 130 | 0 |
| B | 0 | 130 | 0 |
| C | 0 | 130 | 0 |
| D | 0 | 130 | 0 |
| Quadrant | Total seconds | Saturated seconds | Saturation percentage |
|---|---|---|---|
| A | 6485 | 45 | 0.693909% |
| B | 6485 | 53 | 0.817271% |
| C | 6485 | 54 | 0.832691% |
| D | 6485 | 5249 | 80.940632% |
Noise dominated data is calculated using 1-second bins in cleaned event files. If a bin has >2000 counts, and if more than 50% of those come from <1% of pixels, then it is considered to be noise-dominated and hence unusable.
| Quadrant | # 1 sec bins | Bins with >0 counts | Bins with >2000 counts | High rate bins dominated by noise | Noise dominated (total time) | Noise dominated (detector-on time) | Marked lightcurve |
|---|---|---|---|---|---|---|---|
| A | 7330 | 6485 | 1 | 1 | 0.01% | 0.02% | 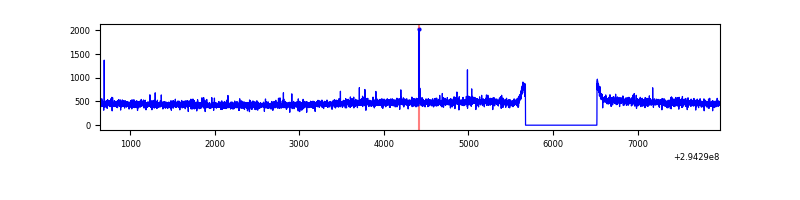 |
| B | 7330 | 6485 | 0 | 0 | 0.00% | 0.00% | 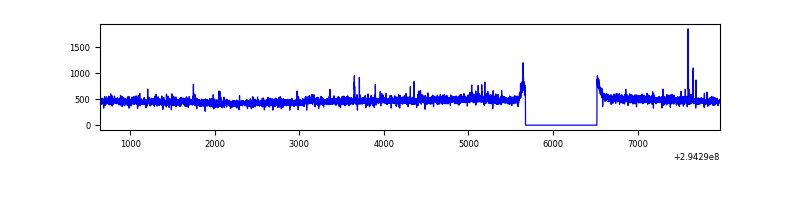 |
| C | 7330 | 6485 | 0 | 0 | 0.00% | 0.00% | 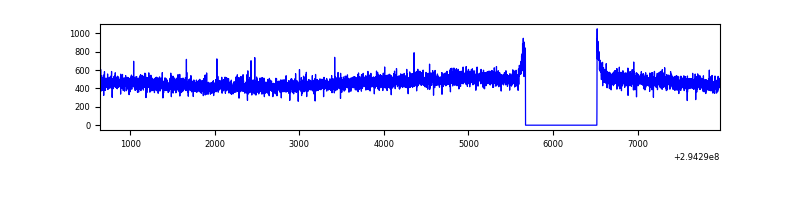 |
| D | 7330 | 6485 | 4896 | 4896 | 66.79% | 75.50% | 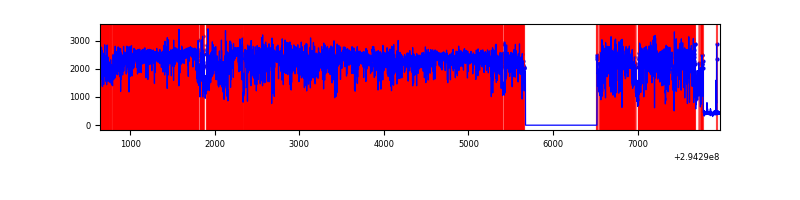 |
Top three noisy pixels from each quadrant. If the there are fewer than three noisy pixels in the level2.evt file, extra rows are filled as -1
| Pixel properties | Quadrant properties | ||||||
|---|---|---|---|---|---|---|---|
| Quadrant | DetID | PixID | Counts | Sigma | Mean | Median | Sigma |
| A | 13 | 254 | 8914 | 51.79 | 778 | 761 | 157.4 |
| A | 0 | 226 | 6736 | 37.96 | 778 | 761 | 157.4 |
| A | 3 | 137 | 6381 | 35.7 | 778 | 761 | 157.4 |
| B | 12 | 111 | 18629 | 118.7 | 775 | 755 | 150.6 |
| B | 11 | 111 | 16587 | 105.14 | 775 | 755 | 150.6 |
| B | 14 | 111 | 14630 | 92.15 | 775 | 755 | 150.6 |
| C | 14 | 238 | 112781 | 636.59 | 743 | 748 | 176.0 |
| C | 3 | 233 | 14169 | 76.26 | 743 | 748 | 176.0 |
| C | 13 | 61 | 5201 | 25.3 | 743 | 748 | 176.0 |
| D | 10 | 66 | 8635399 | 70316.71 | 506 | 491 | 122.8 |
| D | 7 | 238 | 2324197 | 18922.65 | 506 | 491 | 122.8 |
| D | 1 | 52 | 1095746 | 8919.0 | 506 | 491 | 122.8 |
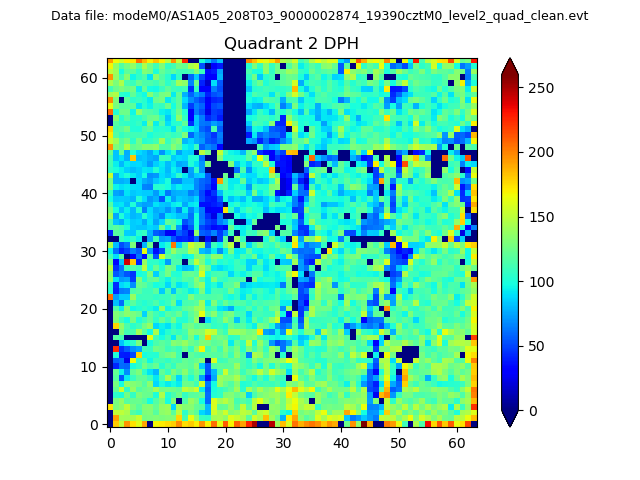
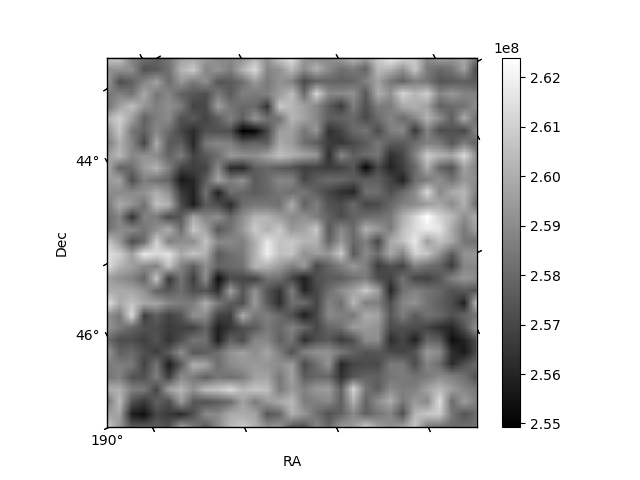
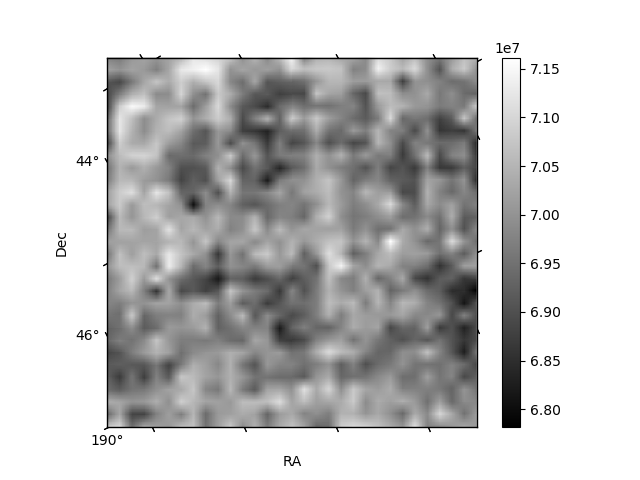
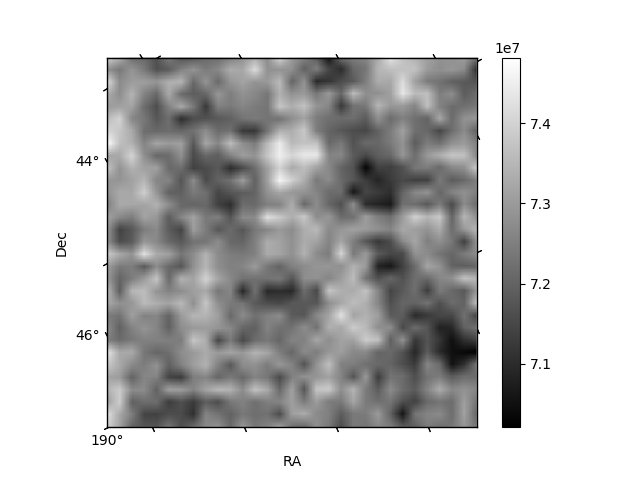
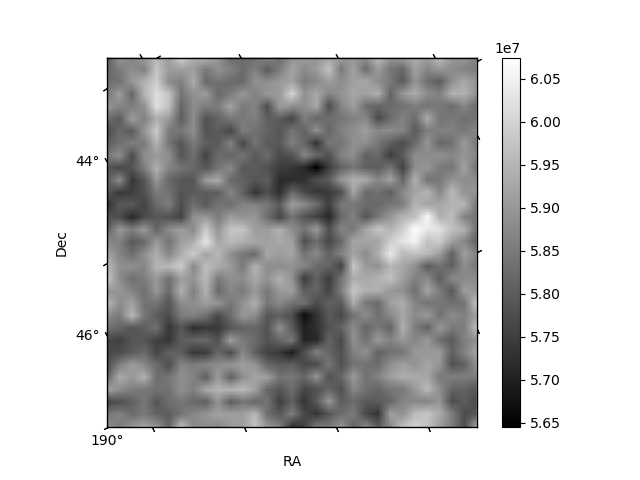
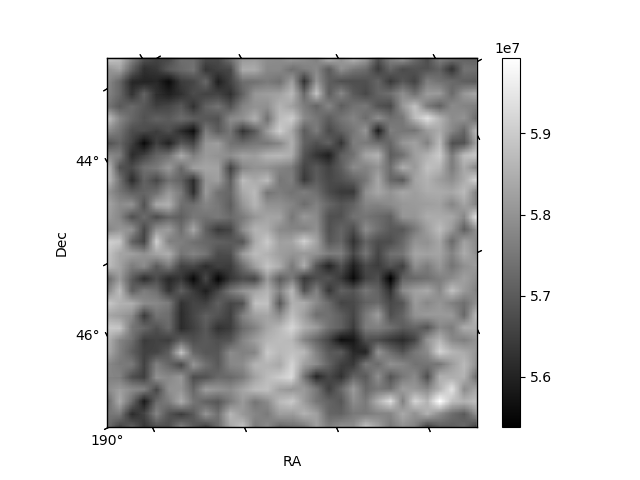
Histogram calculated using DETX and DETY for each event in the final _common_clean file
| Quadrant A | 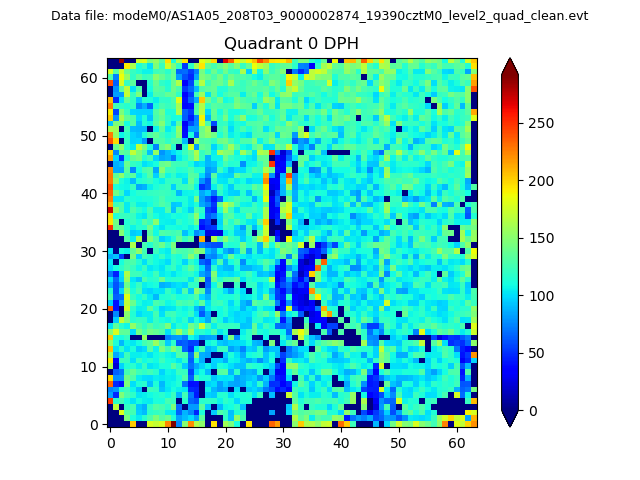 |
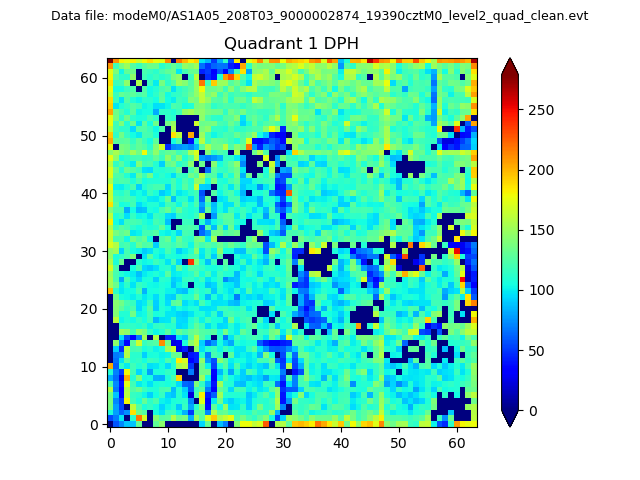 |
Quadrant B |
|---|---|---|---|
| Quadrant D | 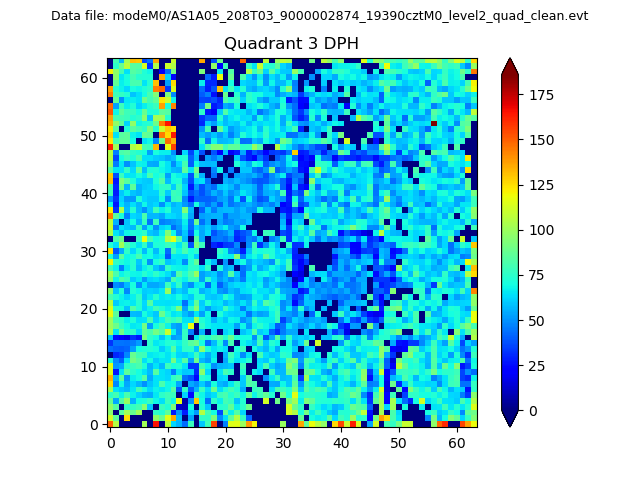 |
 |
Quadrant C |
| Plot type | Count rate plots | Images |
|---|---|---|
| Comparison with Poisson distribution Blue bars denote a histogram of data divided into 1 sec bins. Red curve is a Poisson curve with rate = median count rate of data. |
 |
 |
| Quadrant-wise count rates Data is divided into 100 sec bins |
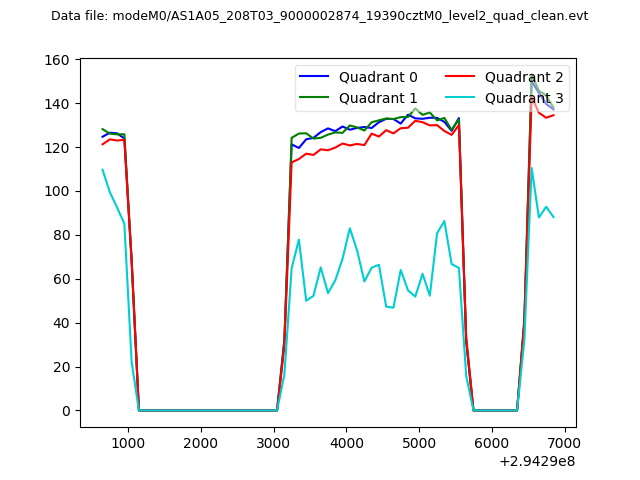 |
|
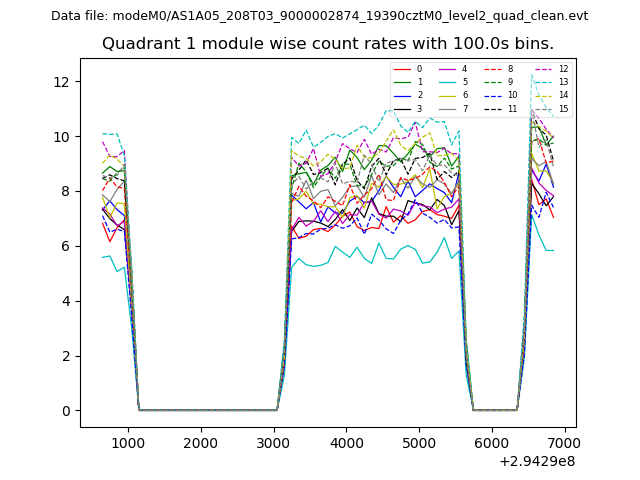
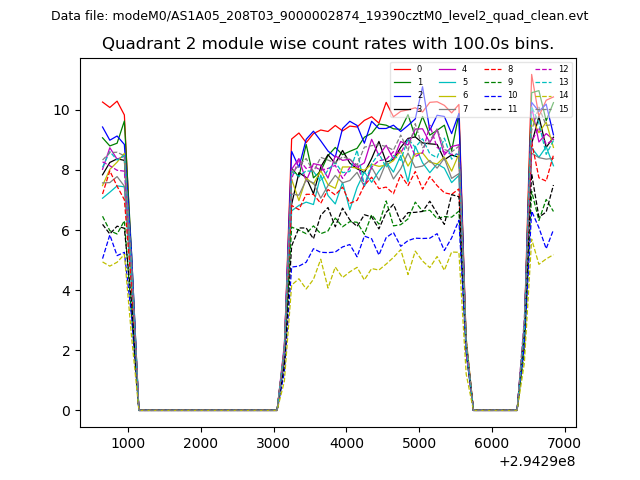
| Module-wise count rates for Quadrant A Data is divided into 100 sec bins |
 |
 |
| Module-wise count rates for Quadrant B Data is divided into 100 sec bins |
 |
 |
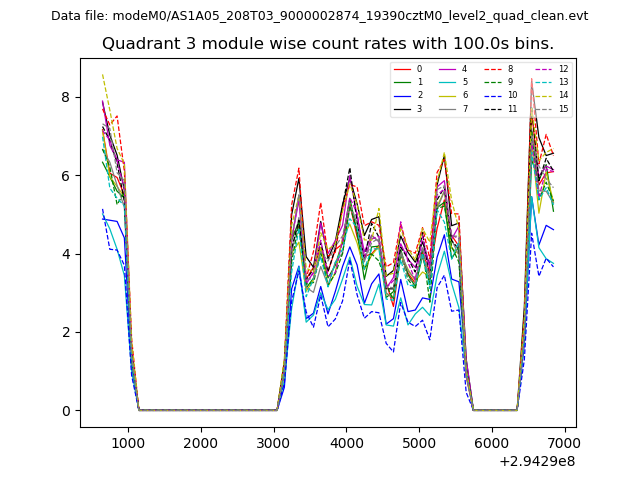
| Module-wise count rates for Quadrant C Data is divided into 100 sec bins |
 |
 |
| Module-wise count rates for Quadrant D Data is divided into 100 sec bins |
 |
 |
| Parameter | Plot |
|---|---|
| CZT HV Monitor | 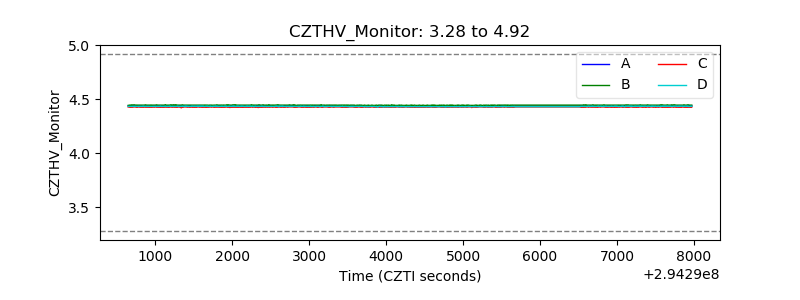 |
| D_VDD |  |
| Temperature 1 | 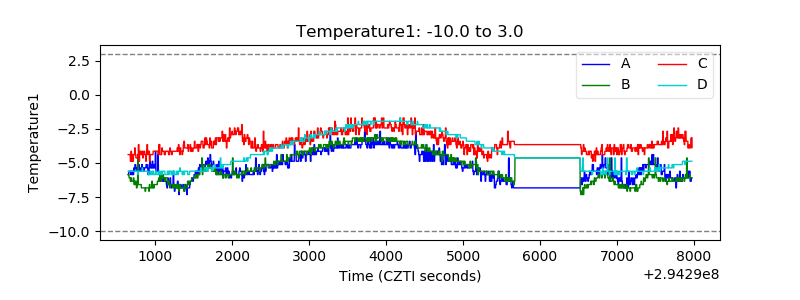 |
| Veto HV Monitor | 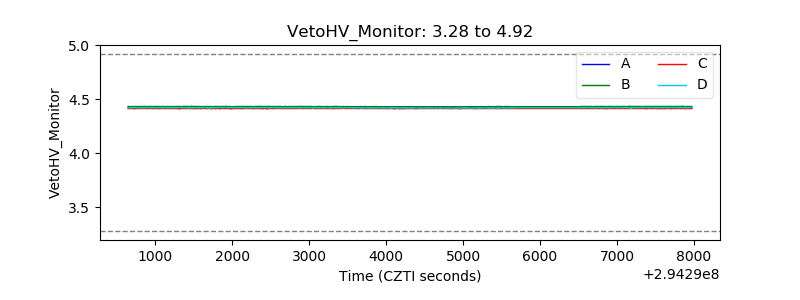 |
| Veto LLD | 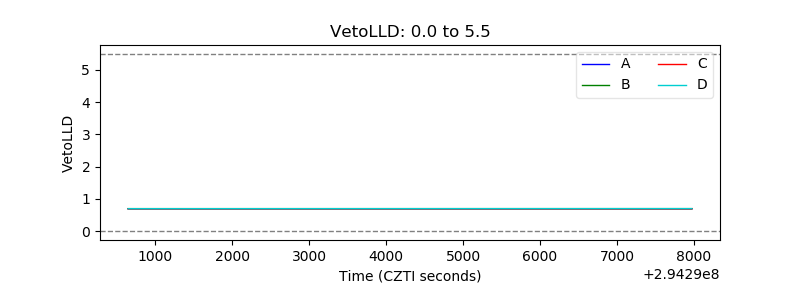 |
| Alpha Counter | 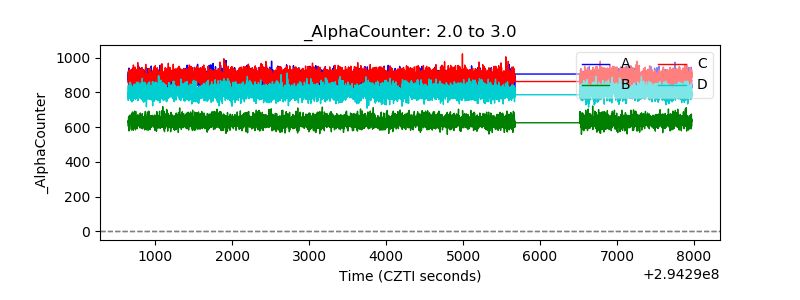 |
| _CPM_Rate | 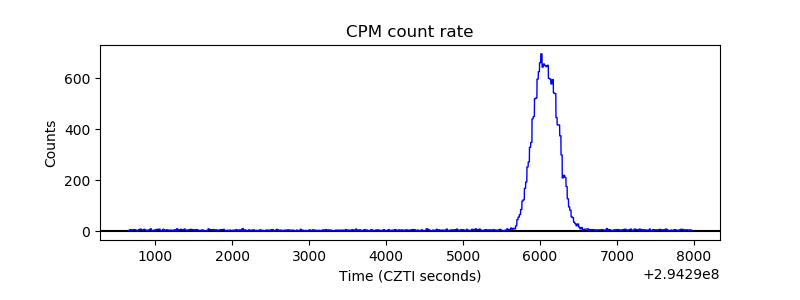 |
| CZT Counter | 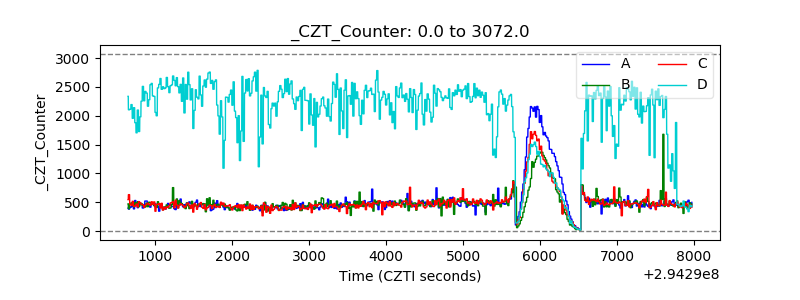 |
| +2.5 Volts monitor |  |
| +5 Volts monitor |  |
| _ROLL_ROT | 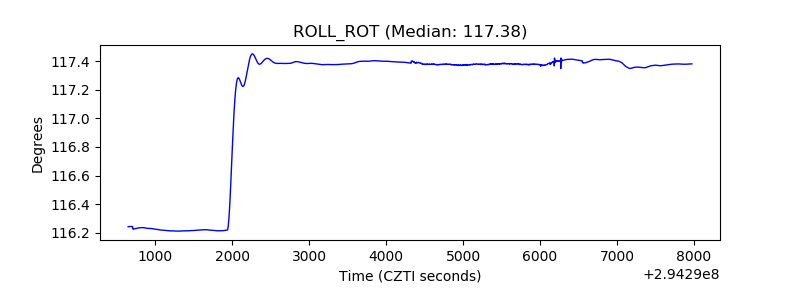 |
| _Roll_DEC | 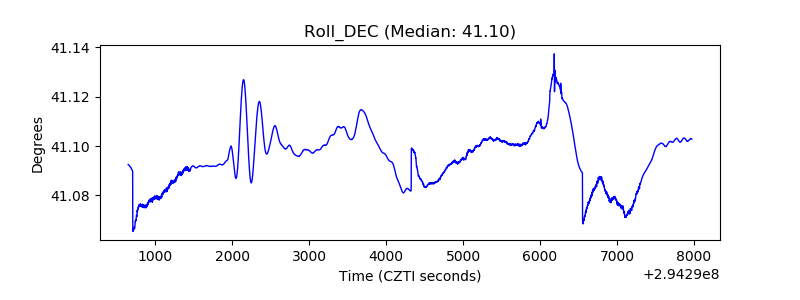 |
| _Roll_RA | 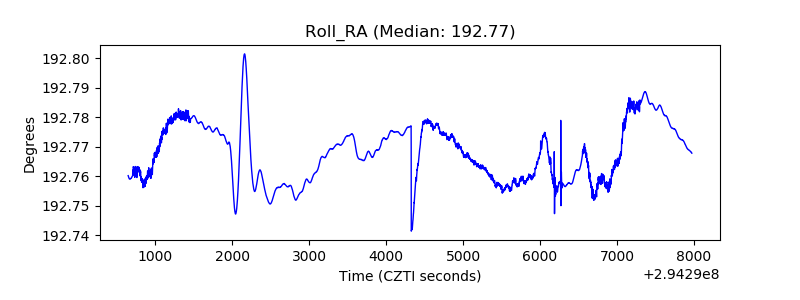 |
| Veto Counter | 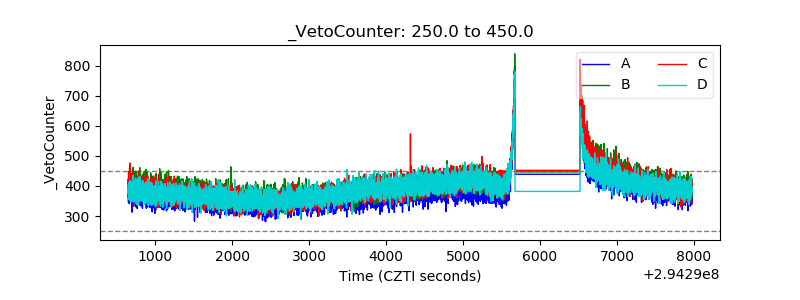 |