| Param | Original file | Final file |
|---|---|---|
| Filename | modeM0/AS1A05_208T03_9000002874_19391cztM0_level2.evt | modeM0/AS1A05_208T03_9000002874_19391cztM0_level2_quad_clean.evt |
| Size (bytes) | 643,596,480 | 65,456,640 |
| Size | 613.8 MB | 62.4 MB |
| Events in quadrant A | 3,139,546 | 413,776 |
| Events in quadrant B | 3,211,195 | 420,407 |
| Events in quadrant C | 3,147,442 | 396,796 |
| Events in quadrant D | 9,551,421 | 295,454 |
| Mode M9 | |||
|---|---|---|---|
| Quadrant | BADHDUFLAG | Total packets | Discarded packets |
| A | 0 | 13 | 0 |
| B | 0 | 14 | 0 |
| C | 0 | 14 | 0 |
| D | 0 | 14 | 0 |
| Mode M0 | |||
|---|---|---|---|
| Quadrant | BADHDUFLAG | Total packets | Discarded packets |
| A | 0 | 13388 | 2 |
| B | 0 | 13501 | 2 |
| C | 0 | 13396 | 2 |
| D | 0 | 32841 | 2 |
| Mode SS | |||
|---|---|---|---|
| Quadrant | BADHDUFLAG | Total packets | Discarded packets |
| A | 0 | 132 | 0 |
| B | 0 | 132 | 0 |
| C | 0 | 132 | 0 |
| D | 0 | 132 | 0 |
| Quadrant | Total seconds | Saturated seconds | Saturation percentage |
|---|---|---|---|
| A | 6516 | 55 | 0.844076% |
| B | 6516 | 62 | 0.951504% |
| C | 6516 | 71 | 1.089626% |
| D | 6516 | 2668 | 40.945365% |
Noise dominated data is calculated using 1-second bins in cleaned event files. If a bin has >2000 counts, and if more than 50% of those come from <1% of pixels, then it is considered to be noise-dominated and hence unusable.
| Quadrant | # 1 sec bins | Bins with >0 counts | Bins with >2000 counts | High rate bins dominated by noise | Noise dominated (total time) | Noise dominated (detector-on time) | Marked lightcurve |
|---|---|---|---|---|---|---|---|
| A | 7521 | 6516 | 0 | 0 | 0.00% | 0.00% | 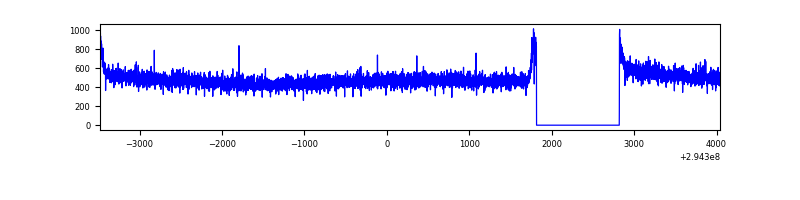 |
| B | 7521 | 6516 | 2 | 2 | 0.03% | 0.03% | 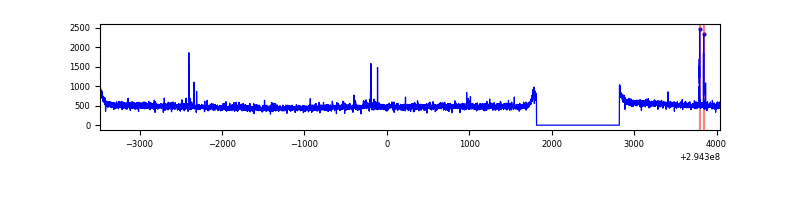 |
| C | 7521 | 6516 | 0 | 0 | 0.00% | 0.00% | 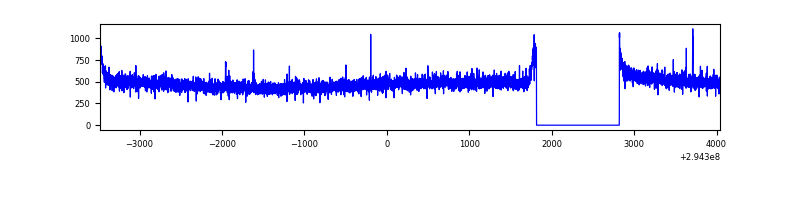 |
| D | 7521 | 6516 | 2374 | 2374 | 31.56% | 36.43% | 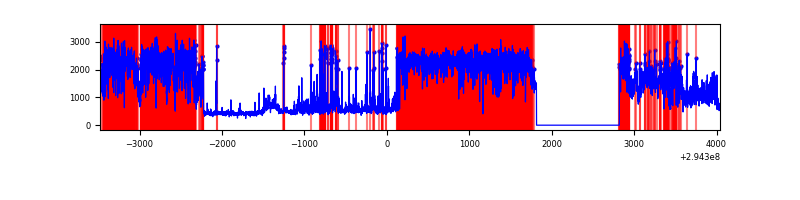 |
Top three noisy pixels from each quadrant. If the there are fewer than three noisy pixels in the level2.evt file, extra rows are filled as -1
| Pixel properties | Quadrant properties | ||||||
|---|---|---|---|---|---|---|---|
| Quadrant | DetID | PixID | Counts | Sigma | Mean | Median | Sigma |
| A | 13 | 254 | 9067 | 50.39 | 813 | 797 | 164.1 |
| A | 0 | 226 | 7071 | 38.23 | 813 | 797 | 164.1 |
| A | 3 | 137 | 6547 | 35.03 | 813 | 797 | 164.1 |
| B | 0 | 230 | 25945 | 162.17 | 807 | 787 | 155.1 |
| B | 12 | 111 | 19117 | 118.15 | 807 | 787 | 155.1 |
| B | 11 | 111 | 16910 | 103.93 | 807 | 787 | 155.1 |
| C | 14 | 238 | 120298 | 661.24 | 771 | 773 | 180.8 |
| C | 3 | 233 | 12074 | 62.52 | 771 | 773 | 180.8 |
| C | 13 | 61 | 5512 | 26.22 | 771 | 773 | 180.8 |
| D | 10 | 66 | 5969934 | 36255.98 | 675 | 654 | 164.6 |
| D | 1 | 52 | 522897 | 3171.98 | 675 | 654 | 164.6 |
| D | 7 | 238 | 271723 | 1646.41 | 675 | 654 | 164.6 |
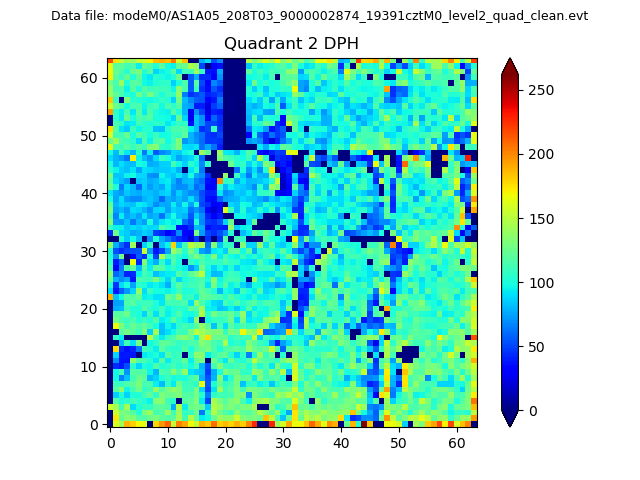
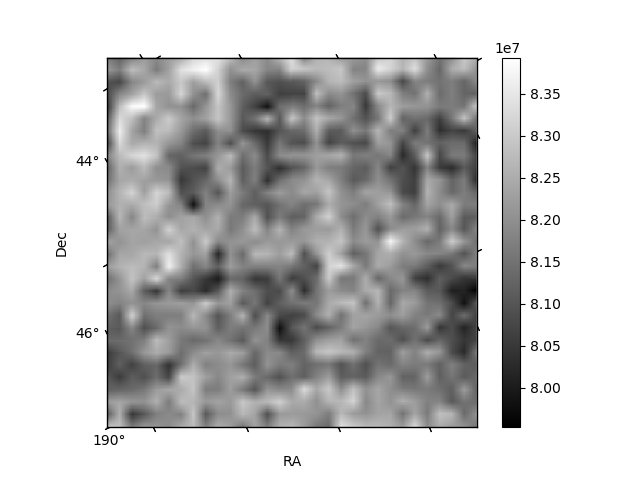
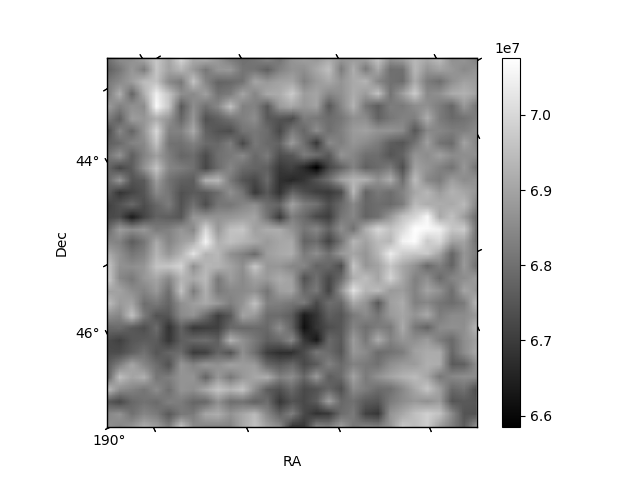
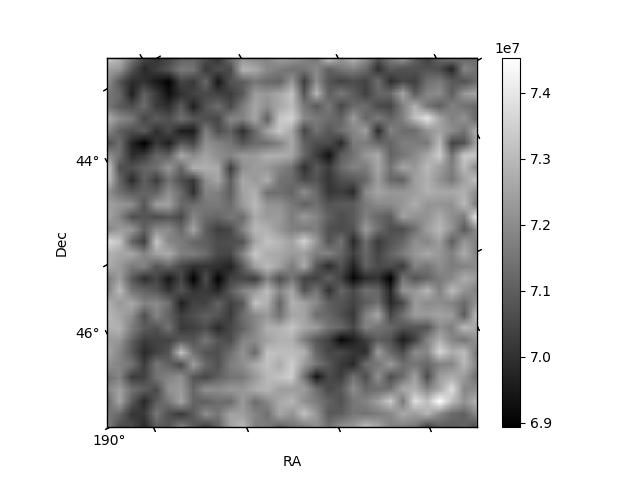
Histogram calculated using DETX and DETY for each event in the final _common_clean file
| Quadrant A |  |
 |
Quadrant B |
|---|---|---|---|
| Quadrant D | 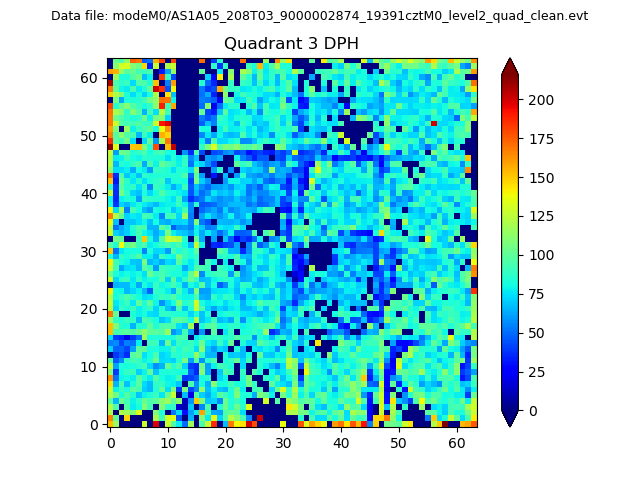 |
 |
Quadrant C |
| Plot type | Count rate plots | Images |
|---|---|---|
| Comparison with Poisson distribution Blue bars denote a histogram of data divided into 1 sec bins. Red curve is a Poisson curve with rate = median count rate of data. |
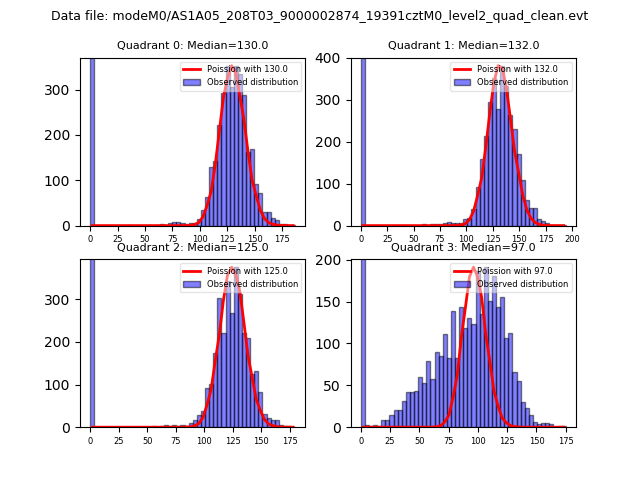 |
 |
| Quadrant-wise count rates Data is divided into 100 sec bins |
 |
|
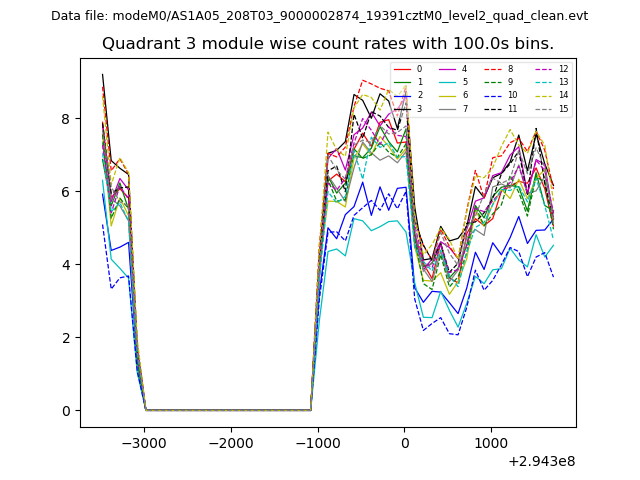
| Module-wise count rates for Quadrant A Data is divided into 100 sec bins |
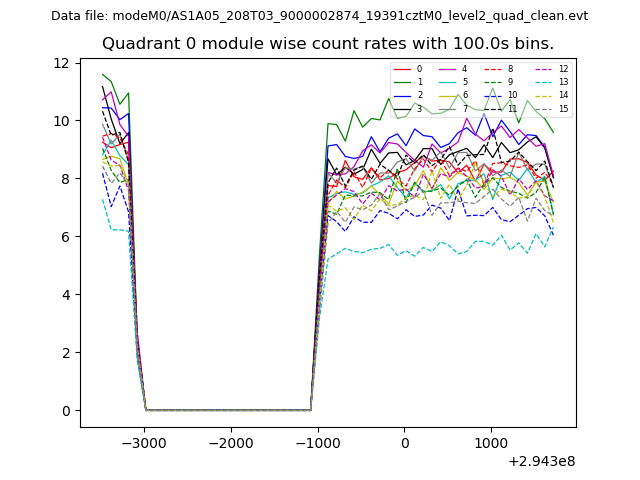 |
 |
| Module-wise count rates for Quadrant B Data is divided into 100 sec bins |
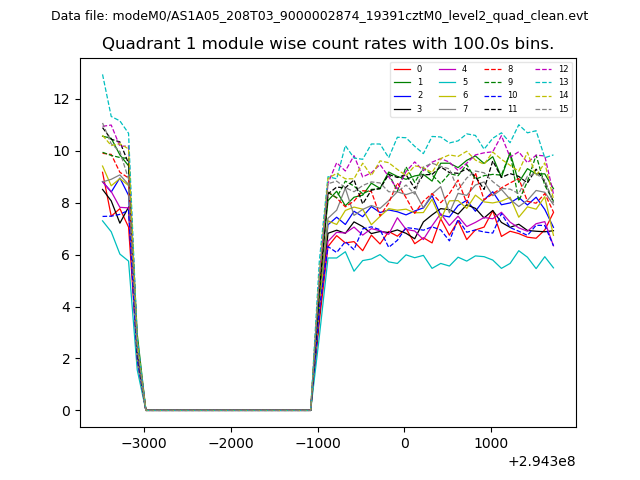 |
 |
| Module-wise count rates for Quadrant C Data is divided into 100 sec bins |
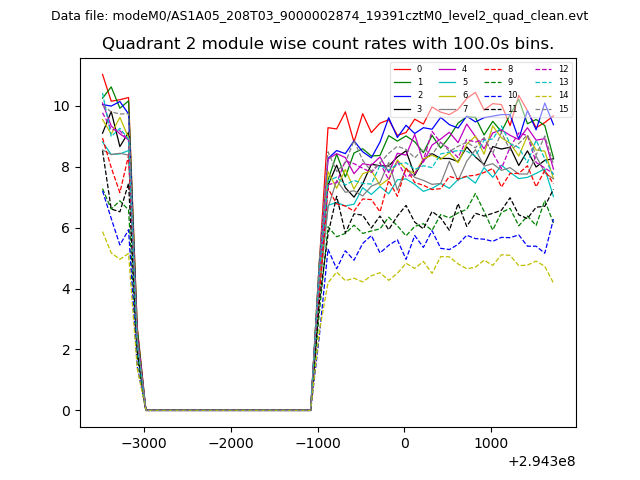 |
 |
| Module-wise count rates for Quadrant D Data is divided into 100 sec bins |
 |
 |
| Parameter | Plot |
|---|---|
| CZT HV Monitor | 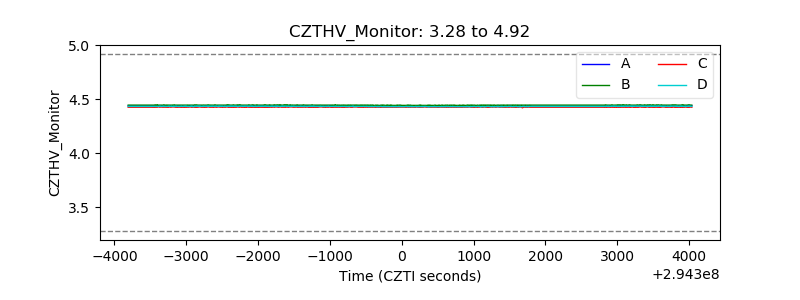 |
| D_VDD | 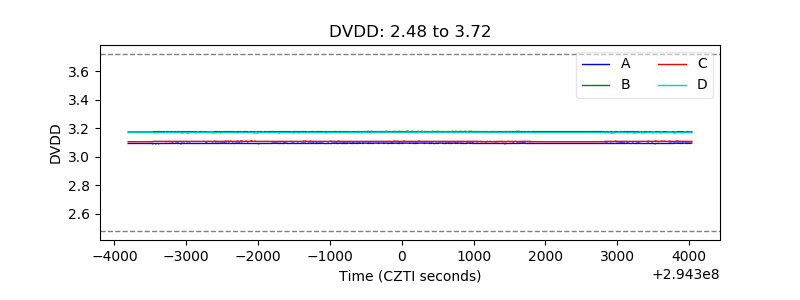 |
| Temperature 1 | 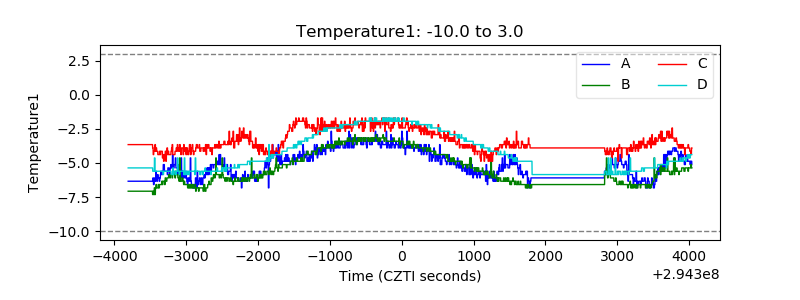 |
| Veto HV Monitor |  |
| Veto LLD | 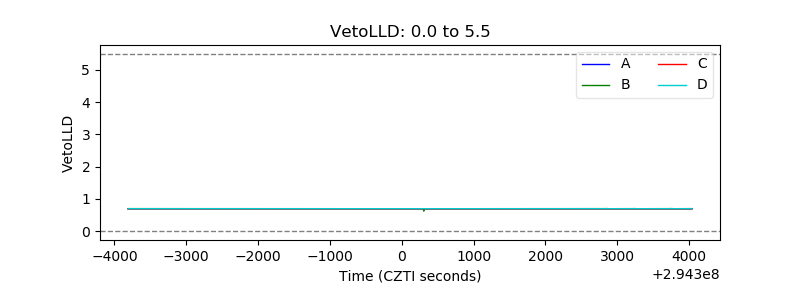 |
| Alpha Counter | 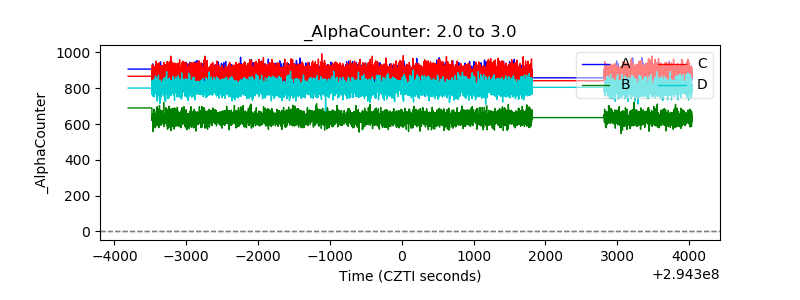 |
| _CPM_Rate | 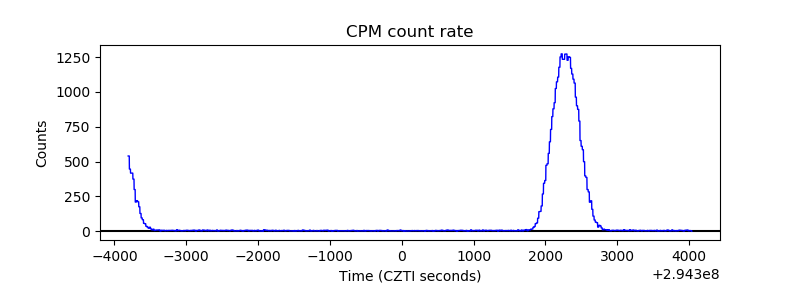 |
| CZT Counter | 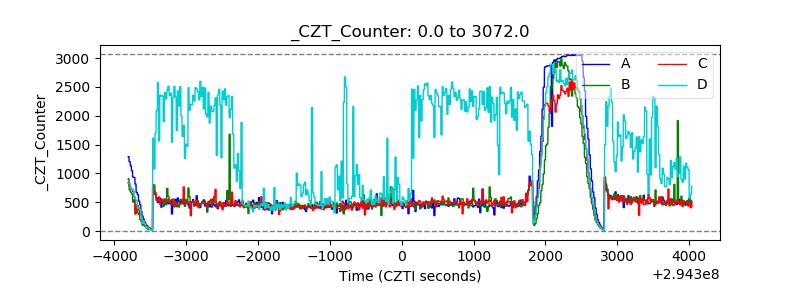 |
| +2.5 Volts monitor |  |
| +5 Volts monitor |  |
| _ROLL_ROT | 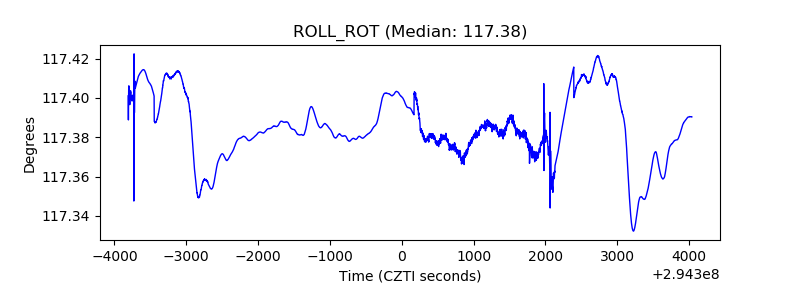 |
| _Roll_DEC | 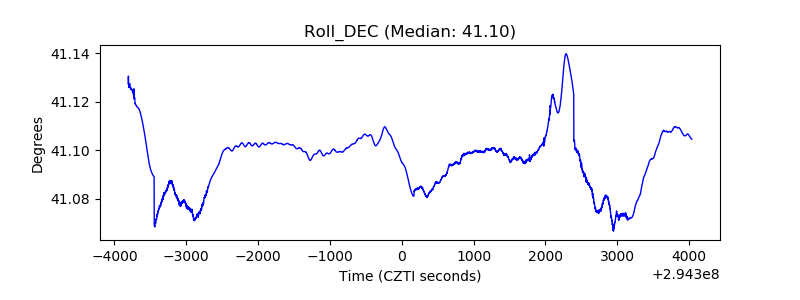 |
| _Roll_RA | 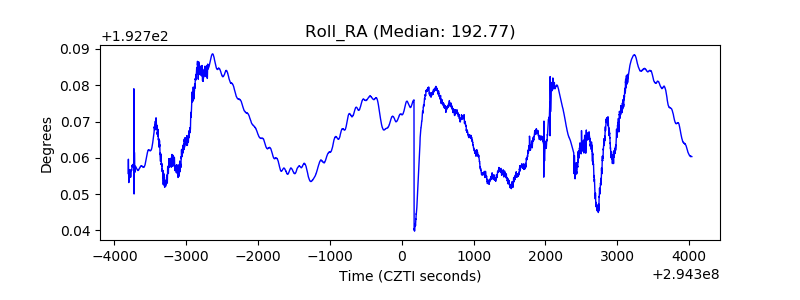 |
| Veto Counter | 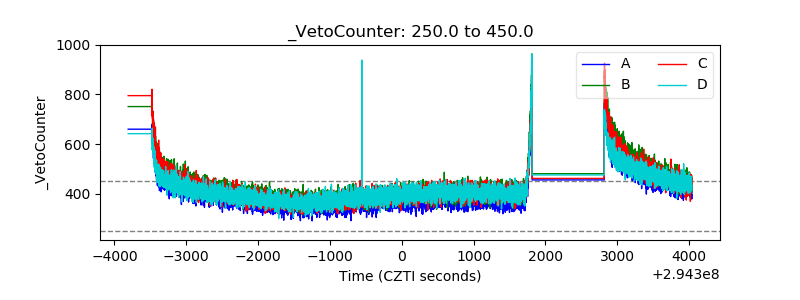 |