| Param | Original file | Final file |
|---|---|---|
| Filename | modeM0/AS1A05_208T03_9000002874_19394cztM0_level2.evt | modeM0/AS1A05_208T03_9000002874_19394cztM0_level2_quad_clean.evt |
| Size (bytes) | 786,625,920 | 76,014,720 |
| Size | 750.2 MB | 72.5 MB |
| Events in quadrant A | 3,530,377 | 513,747 |
| Events in quadrant B | 3,515,972 | 515,917 |
| Events in quadrant C | 3,479,007 | 484,876 |
| Events in quadrant D | 12,855,057 | 329,674 |
| Mode M9 | |||
|---|---|---|---|
| Quadrant | BADHDUFLAG | Total packets | Discarded packets |
| A | 0 | 21 | 0 |
| B | 0 | 22 | 0 |
| C | 0 | 22 | 0 |
| D | 0 | 22 | 0 |
| Mode M0 | |||
|---|---|---|---|
| Quadrant | BADHDUFLAG | Total packets | Discarded packets |
| A | 0 | 14605 | 2 |
| B | 0 | 14529 | 2 |
| C | 0 | 14307 | 2 |
| D | 0 | 42706 | 2 |
| Mode SS | |||
|---|---|---|---|
| Quadrant | BADHDUFLAG | Total packets | Discarded packets |
| A | 0 | 132 | 0 |
| B | 0 | 132 | 0 |
| C | 0 | 132 | 0 |
| D | 0 | 132 | 0 |
| Quadrant | Total seconds | Saturated seconds | Saturation percentage |
|---|---|---|---|
| A | 6546 | 96 | 1.466544% |
| B | 6546 | 99 | 1.512374% |
| C | 6546 | 113 | 1.726245% |
| D | 6546 | 4218 | 64.436297% |
Noise dominated data is calculated using 1-second bins in cleaned event files. If a bin has >2000 counts, and if more than 50% of those come from <1% of pixels, then it is considered to be noise-dominated and hence unusable.
| Quadrant | # 1 sec bins | Bins with >0 counts | Bins with >2000 counts | High rate bins dominated by noise | Noise dominated (total time) | Noise dominated (detector-on time) | Marked lightcurve |
|---|---|---|---|---|---|---|---|
| A | 7766 | 6546 | 0 | 0 | 0.00% | 0.00% | 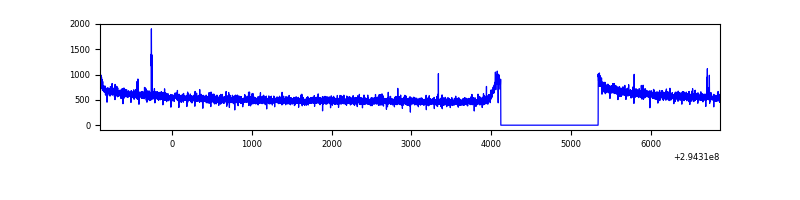 |
| B | 7766 | 6546 | 0 | 0 | 0.00% | 0.00% | 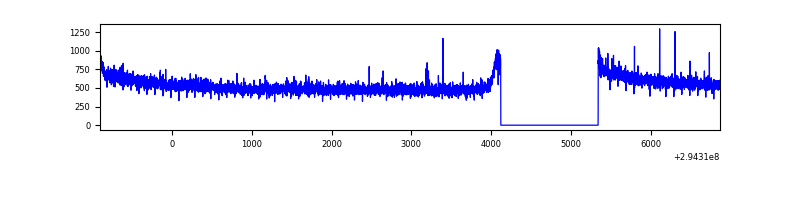 |
| C | 7766 | 6546 | 1 | 1 | 0.01% | 0.02% | 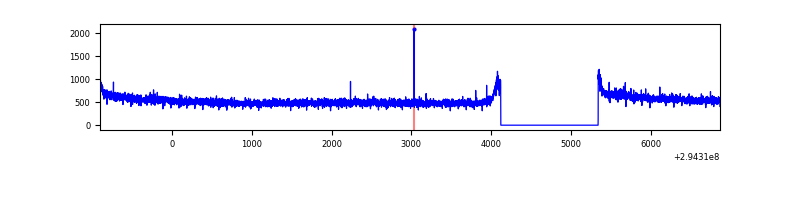 |
| D | 7766 | 6546 | 3674 | 3674 | 47.31% | 56.13% | 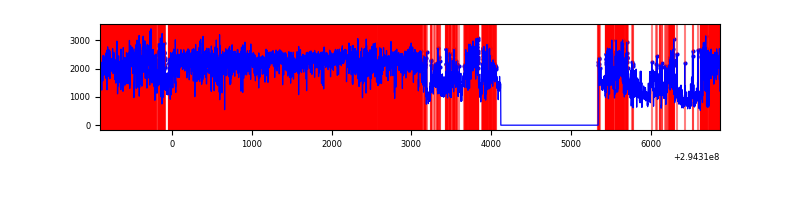 |
Top three noisy pixels from each quadrant. If the there are fewer than three noisy pixels in the level2.evt file, extra rows are filled as -1
| Pixel properties | Quadrant properties | ||||||
|---|---|---|---|---|---|---|---|
| Quadrant | DetID | PixID | Counts | Sigma | Mean | Median | Sigma |
| A | 9 | 143 | 11495 | 58.52 | 911 | 896 | 181.1 |
| A | 5 | 16 | 9325 | 46.54 | 911 | 896 | 181.1 |
| A | 13 | 254 | 9023 | 44.87 | 911 | 896 | 181.1 |
| B | 12 | 111 | 20072 | 115.66 | 895 | 875 | 166.0 |
| B | 11 | 111 | 17805 | 102.01 | 895 | 875 | 166.0 |
| B | 14 | 111 | 16011 | 91.2 | 895 | 875 | 166.0 |
| C | 14 | 238 | 135339 | 689.18 | 850 | 856 | 195.1 |
| C | 3 | 233 | 17451 | 85.04 | 850 | 856 | 195.1 |
| C | 13 | 61 | 5976 | 26.24 | 850 | 856 | 195.1 |
| D | 10 | 66 | 7256099 | 44194.23 | 680 | 660 | 164.2 |
| D | 7 | 238 | 2612757 | 15910.77 | 680 | 660 | 164.2 |
| D | 1 | 52 | 396175 | 2409.16 | 680 | 660 | 164.2 |
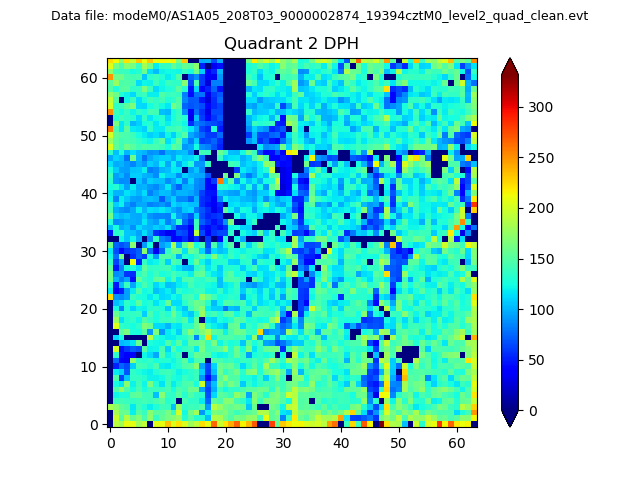
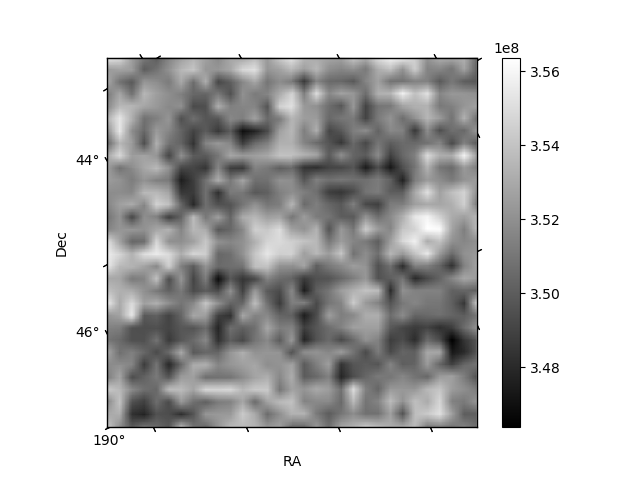
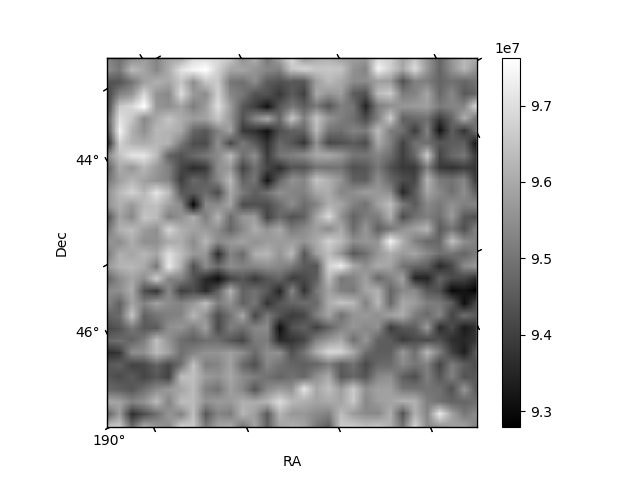
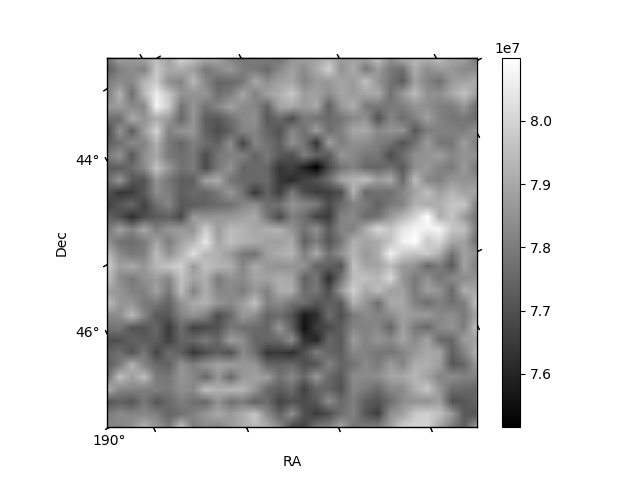
Histogram calculated using DETX and DETY for each event in the final _common_clean file
| Quadrant A | 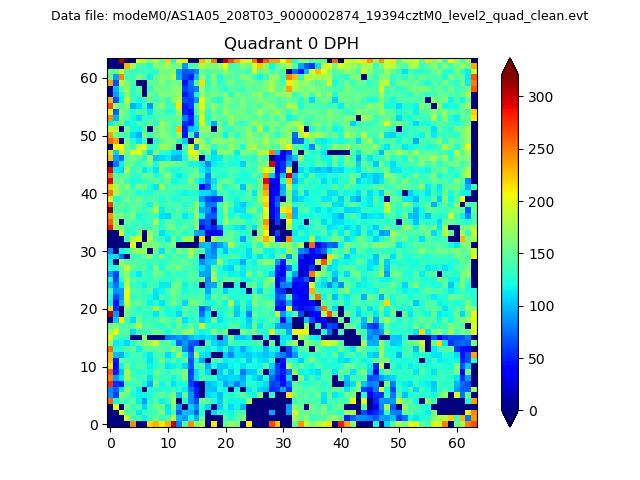 |
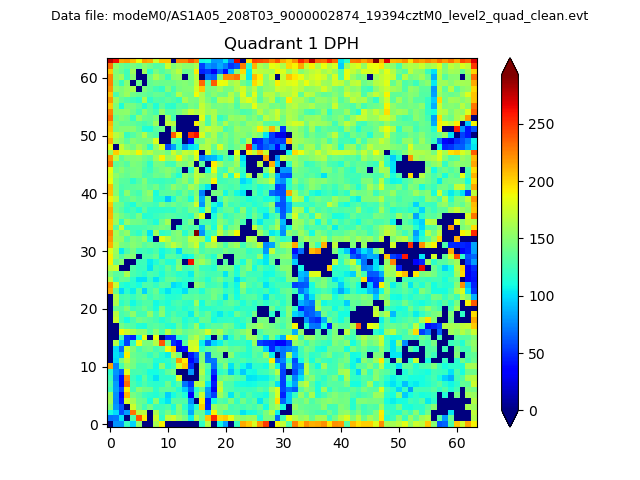 |
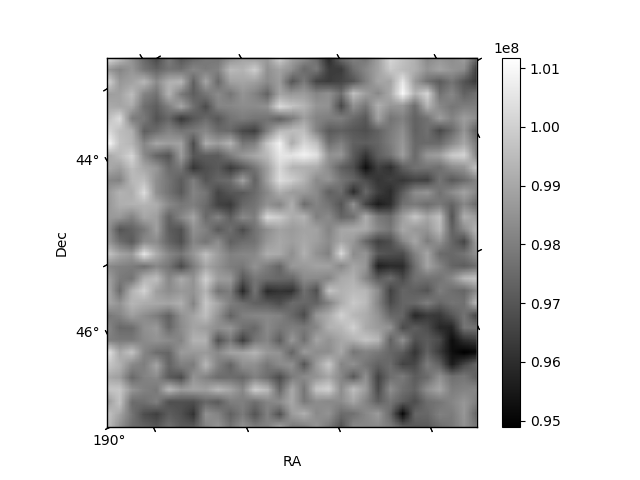
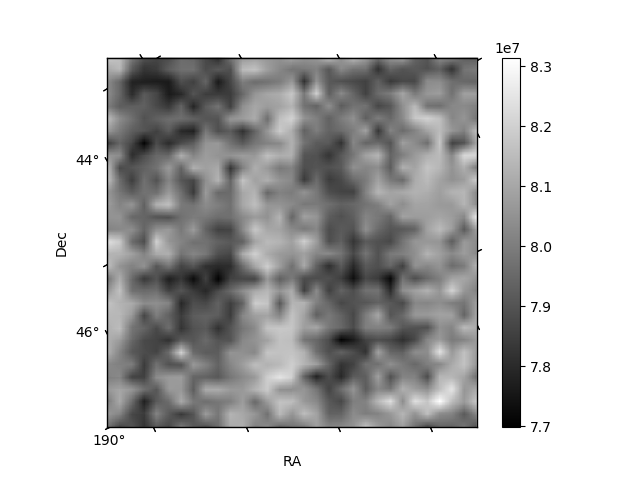
Quadrant B |
|---|---|---|---|
| Quadrant D | 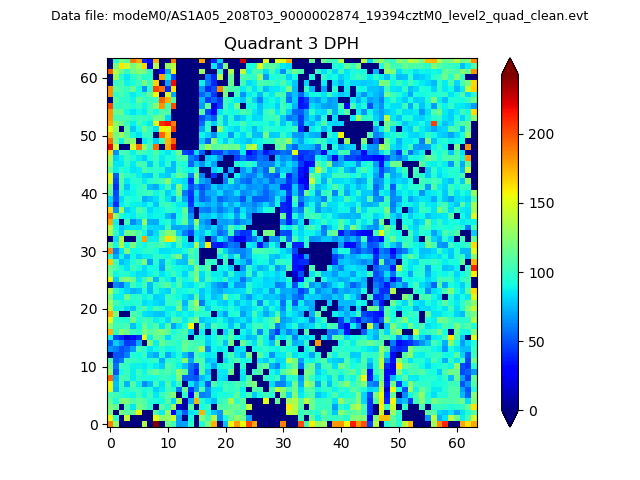 |
 |
Quadrant C |
| Plot type | Count rate plots | Images |
|---|---|---|
| Comparison with Poisson distribution Blue bars denote a histogram of data divided into 1 sec bins. Red curve is a Poisson curve with rate = median count rate of data. |
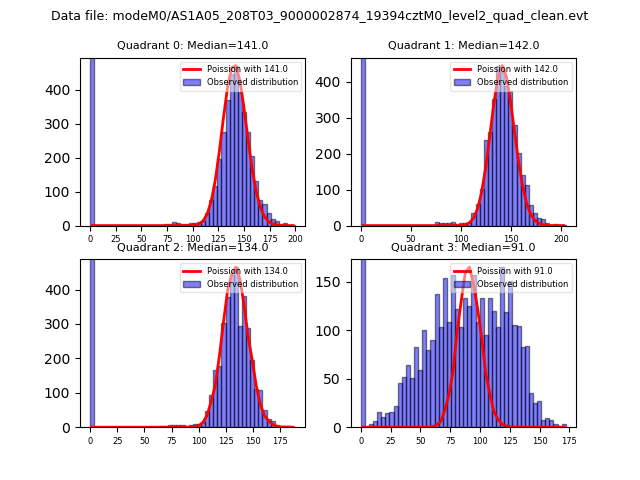 |
 |
| Quadrant-wise count rates Data is divided into 100 sec bins |
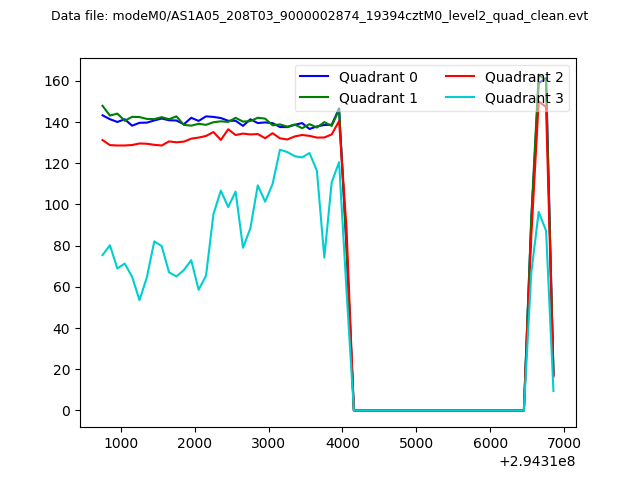 |
|
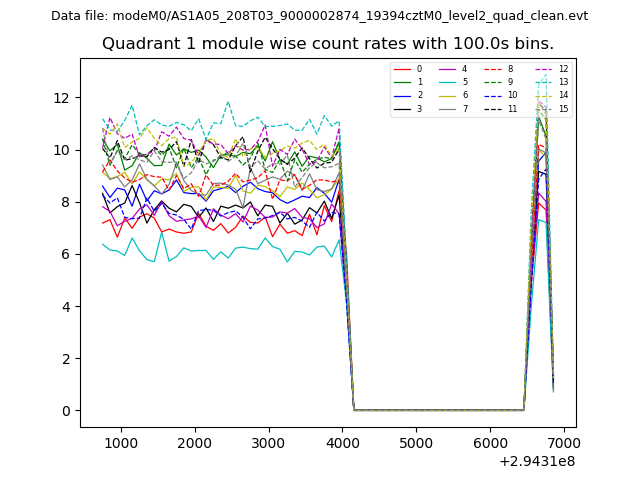
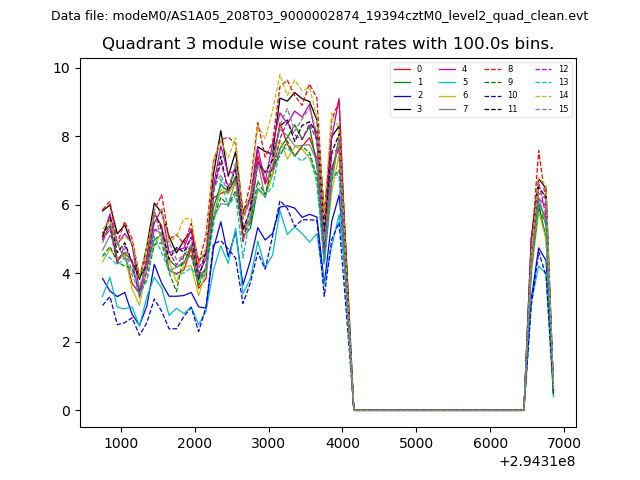
| Module-wise count rates for Quadrant A Data is divided into 100 sec bins |
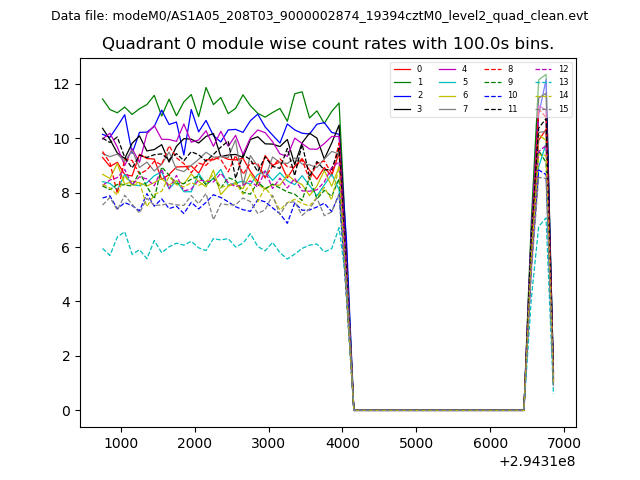 |
 |
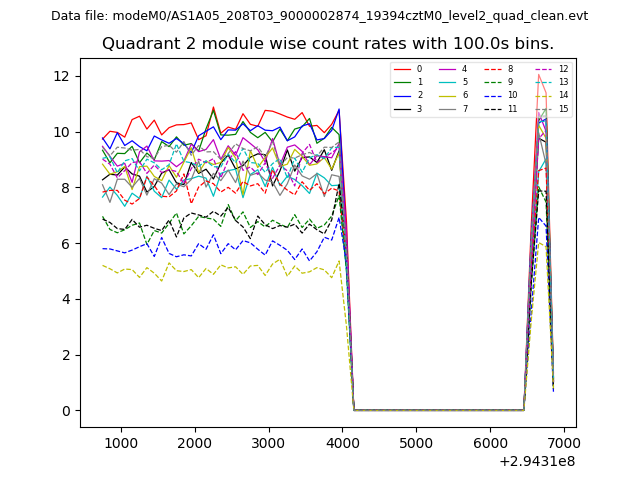
| Module-wise count rates for Quadrant B Data is divided into 100 sec bins |
 |
 |
| Module-wise count rates for Quadrant C Data is divided into 100 sec bins |
 |
 |
| Module-wise count rates for Quadrant D Data is divided into 100 sec bins |
 |
 |
| Parameter | Plot |
|---|---|
| CZT HV Monitor | 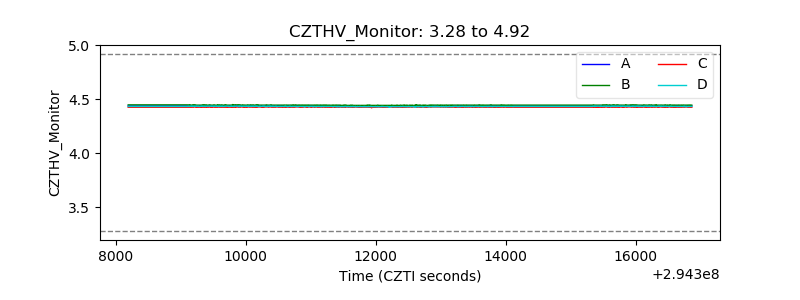 |
| D_VDD | 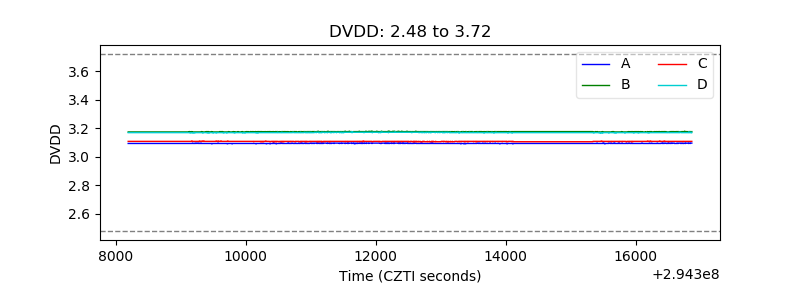 |
| Temperature 1 | 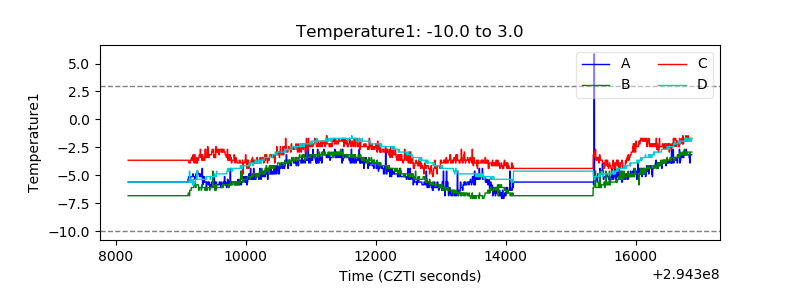 |
| Veto HV Monitor | 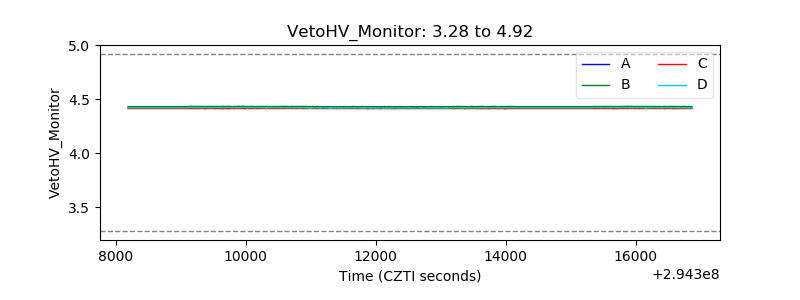 |
| Veto LLD | 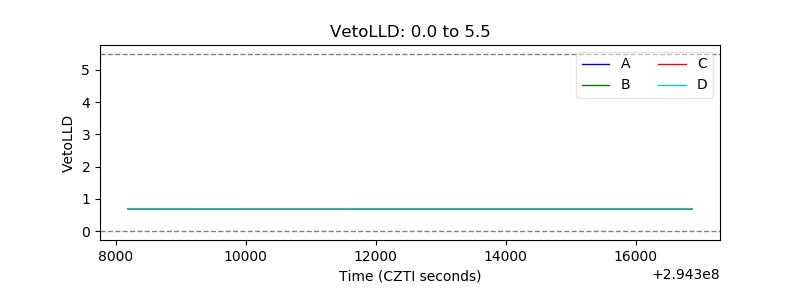 |
| Alpha Counter | 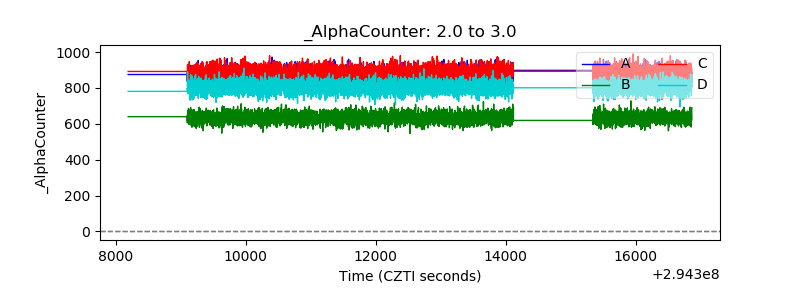 |
| _CPM_Rate | 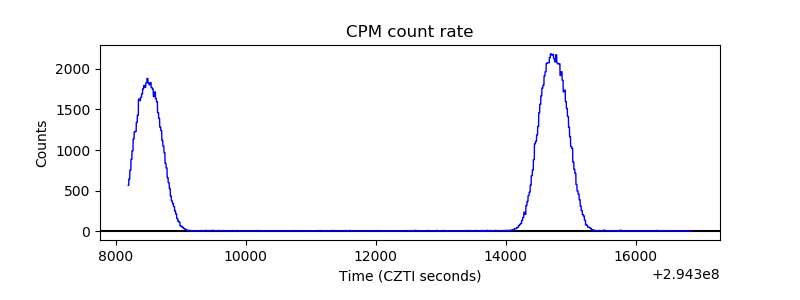 |
| CZT Counter | 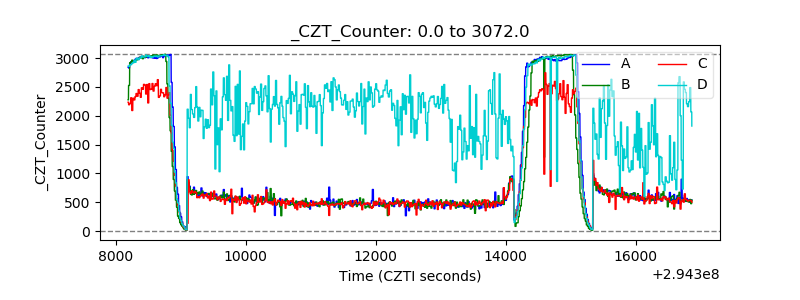 |
| +2.5 Volts monitor | 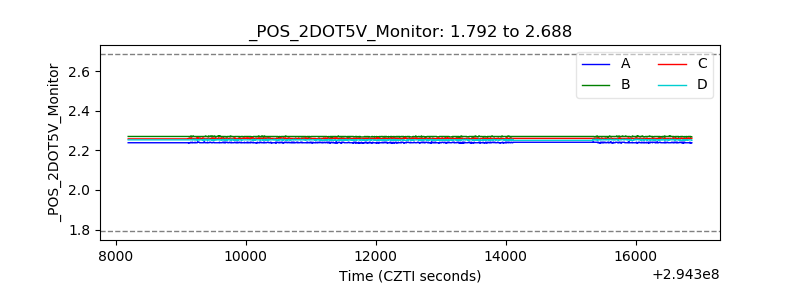 |
| +5 Volts monitor |  |
| _ROLL_ROT | 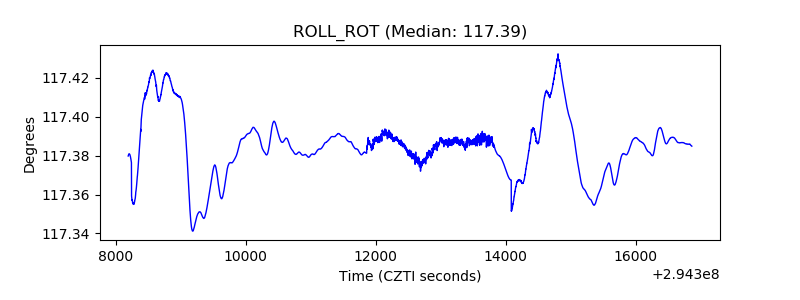 |
| _Roll_DEC | 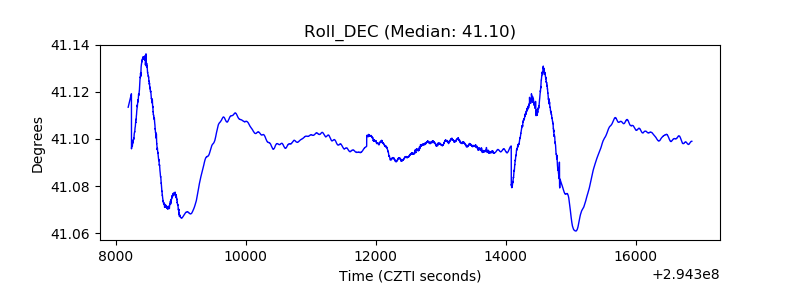 |
| _Roll_RA | 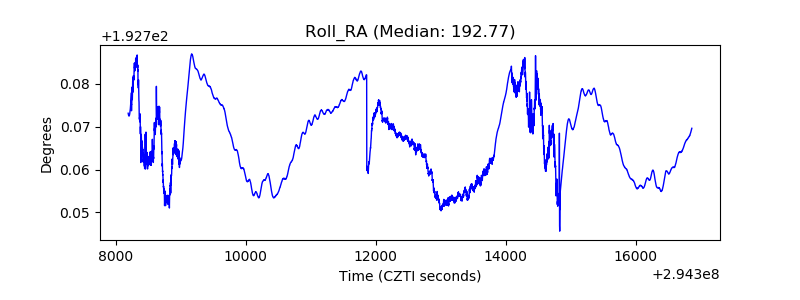 |
| Veto Counter | 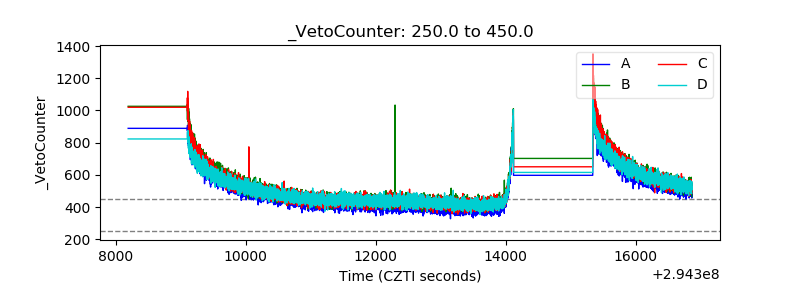 |