| Param | Original file | Final file |
|---|---|---|
| Filename | modeM0/AS1A05_208T03_9000002874_19395cztM0_level2.evt | modeM0/AS1A05_208T03_9000002874_19395cztM0_level2_quad_clean.evt |
| Size (bytes) | 629,775,360 | 95,941,440 |
| Size | 600.6 MB | 91.5 MB |
| Events in quadrant A | 3,413,844 | 663,094 |
| Events in quadrant B | 3,394,364 | 666,799 |
| Events in quadrant C | 3,355,439 | 625,729 |
| Events in quadrant D | 8,489,574 | 516,219 |
| Mode M9 | |||
|---|---|---|---|
| Quadrant | BADHDUFLAG | Total packets | Discarded packets |
| A | 0 | 14 | 0 |
| B | 0 | 14 | 0 |
| C | 0 | 14 | 0 |
| D | 0 | 14 | 0 |
| Mode M0 | |||
|---|---|---|---|
| Quadrant | BADHDUFLAG | Total packets | Discarded packets |
| A | 0 | 14102 | 1 |
| B | 0 | 13896 | 1 |
| C | 0 | 13683 | 1 |
| D | 0 | 29614 | 2 |
| Mode SS | |||
|---|---|---|---|
| Quadrant | BADHDUFLAG | Total packets | Discarded packets |
| A | 0 | 124 | 0 |
| B | 0 | 124 | 0 |
| C | 0 | 124 | 0 |
| D | 0 | 124 | 0 |
| Quadrant | Total seconds | Saturated seconds | Saturation percentage |
|---|---|---|---|
| A | 6212 | 59 | 0.949775% |
| B | 6213 | 64 | 1.030098% |
| C | 6213 | 93 | 1.496861% |
| D | 6212 | 1547 | 24.903413% |
Noise dominated data is calculated using 1-second bins in cleaned event files. If a bin has >2000 counts, and if more than 50% of those come from <1% of pixels, then it is considered to be noise-dominated and hence unusable.
| Quadrant | # 1 sec bins | Bins with >0 counts | Bins with >2000 counts | High rate bins dominated by noise | Noise dominated (total time) | Noise dominated (detector-on time) | Marked lightcurve |
|---|---|---|---|---|---|---|---|
| A | 7552 | 6212 | 0 | 0 | 0.00% | 0.00% | 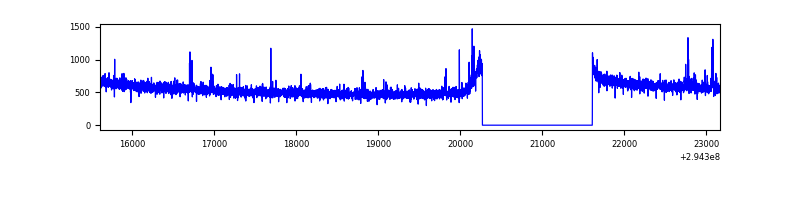 |
| B | 7553 | 6213 | 1 | 1 | 0.01% | 0.02% | 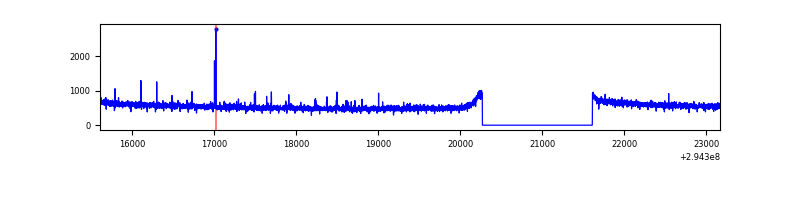 |
| C | 7553 | 6213 | 0 | 0 | 0.00% | 0.00% | 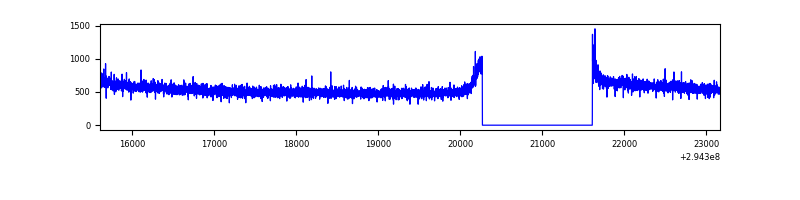 |
| D | 7552 | 6212 | 1358 | 1358 | 17.98% | 21.86% | 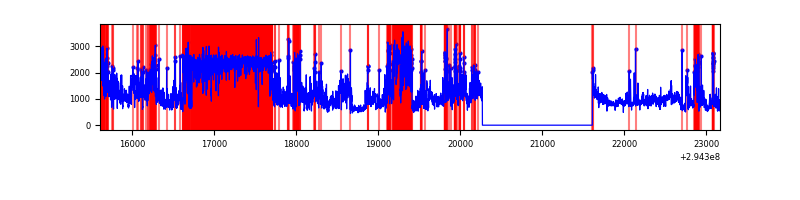 |
Top three noisy pixels from each quadrant. If the there are fewer than three noisy pixels in the level2.evt file, extra rows are filled as -1
| Pixel properties | Quadrant properties | ||||||
|---|---|---|---|---|---|---|---|
| Quadrant | DetID | PixID | Counts | Sigma | Mean | Median | Sigma |
| A | 5 | 16 | 25233 | 141.7 | 876 | 861 | 172.0 |
| A | 12 | 96 | 14072 | 76.81 | 876 | 861 | 172.0 |
| A | 13 | 254 | 8981 | 47.21 | 876 | 861 | 172.0 |
| B | 12 | 111 | 18222 | 109.45 | 858 | 841 | 158.8 |
| B | 3 | 64 | 16811 | 100.56 | 858 | 841 | 158.8 |
| B | 11 | 111 | 16670 | 99.67 | 858 | 841 | 158.8 |
| C | 14 | 238 | 131468 | 692.19 | 822 | 831 | 188.7 |
| C | 3 | 233 | 12598 | 62.35 | 822 | 831 | 188.7 |
| C | 0 | 10 | 6077 | 27.8 | 822 | 831 | 188.7 |
| D | 10 | 66 | 2092676 | 11563.02 | 758 | 739 | 180.9 |
| D | 1 | 52 | 1967587 | 10871.6 | 758 | 739 | 180.9 |
| D | 7 | 238 | 1524610 | 8423.08 | 758 | 739 | 180.9 |
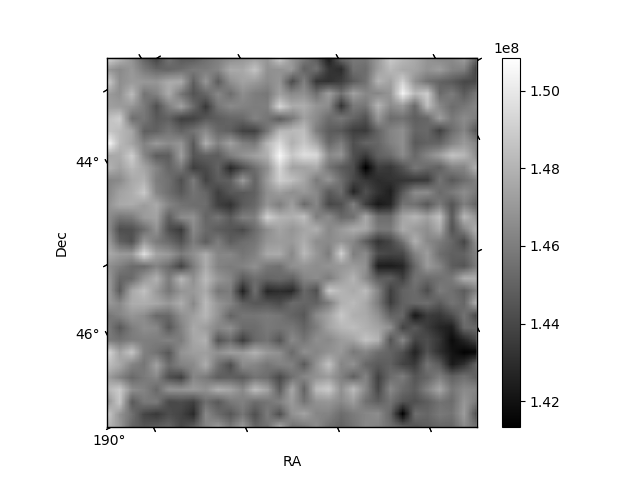
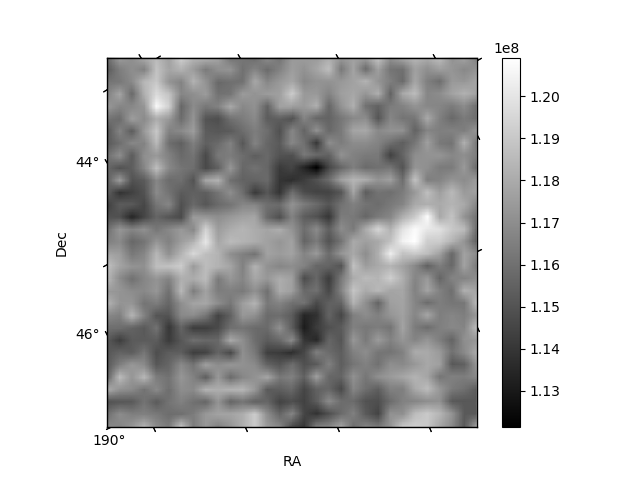
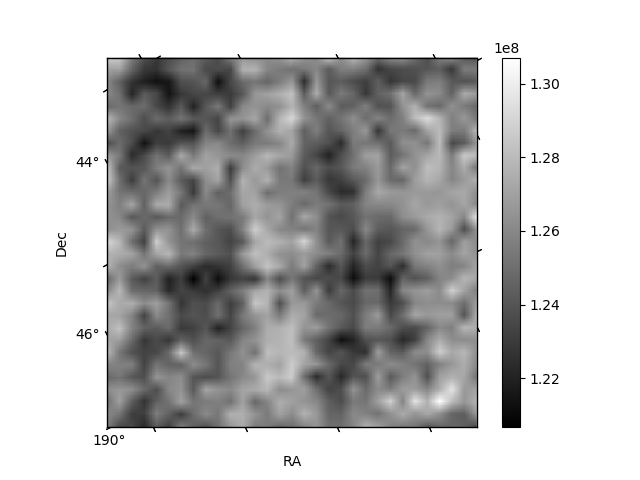
Histogram calculated using DETX and DETY for each event in the final _common_clean file
| Quadrant A |  |
 |
Quadrant B |
|---|---|---|---|
| Quadrant D | 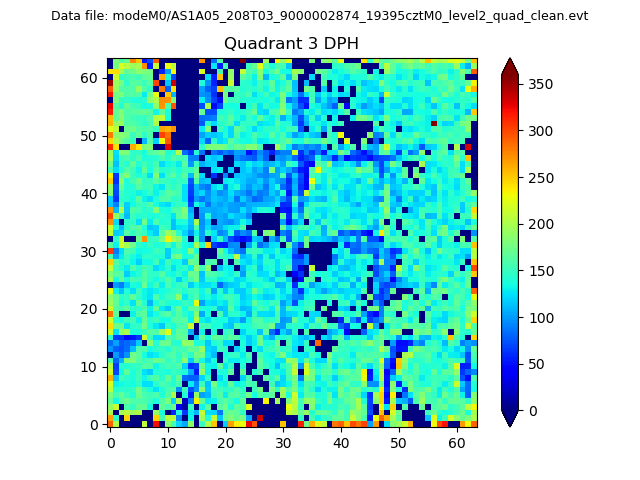 |
 |
Quadrant C |
| Plot type | Count rate plots | Images |
|---|---|---|
| Comparison with Poisson distribution Blue bars denote a histogram of data divided into 1 sec bins. Red curve is a Poisson curve with rate = median count rate of data. |
 |
 |
| Quadrant-wise count rates Data is divided into 100 sec bins |
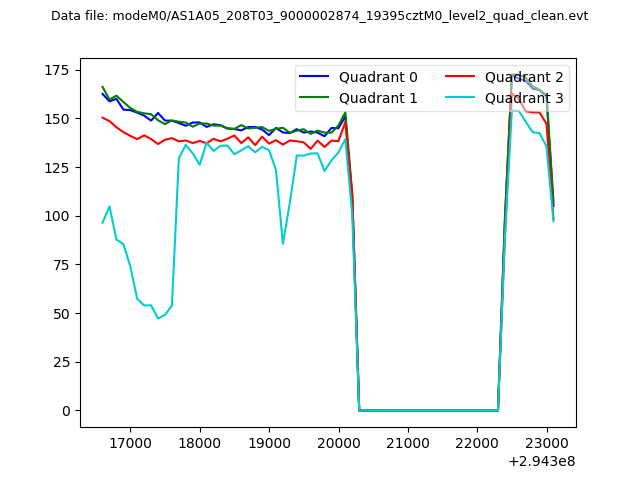 |
|
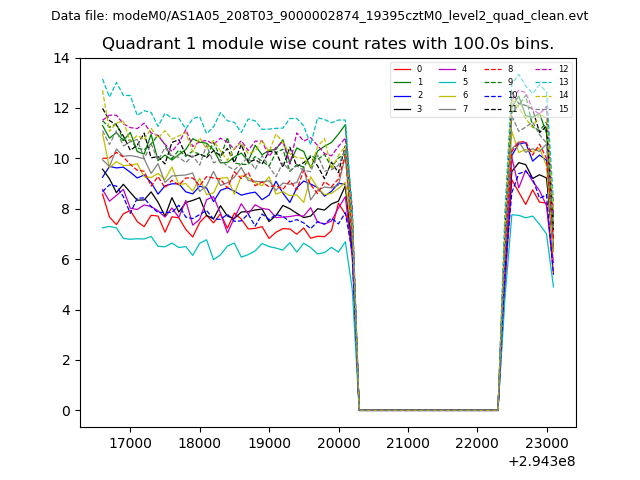
| Module-wise count rates for Quadrant A Data is divided into 100 sec bins |
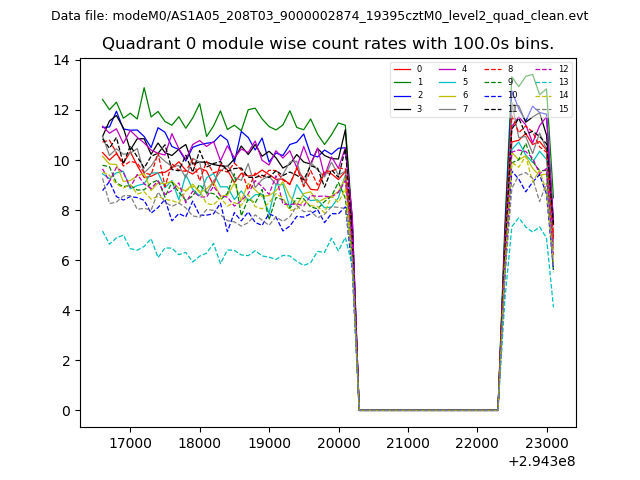 |
 |
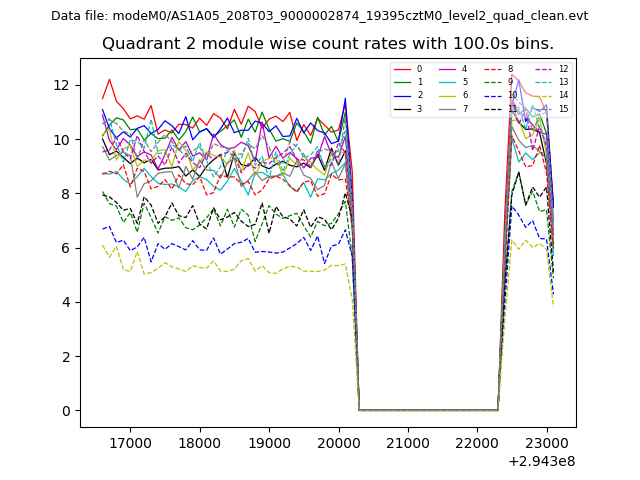
| Module-wise count rates for Quadrant B Data is divided into 100 sec bins |
 |
 |
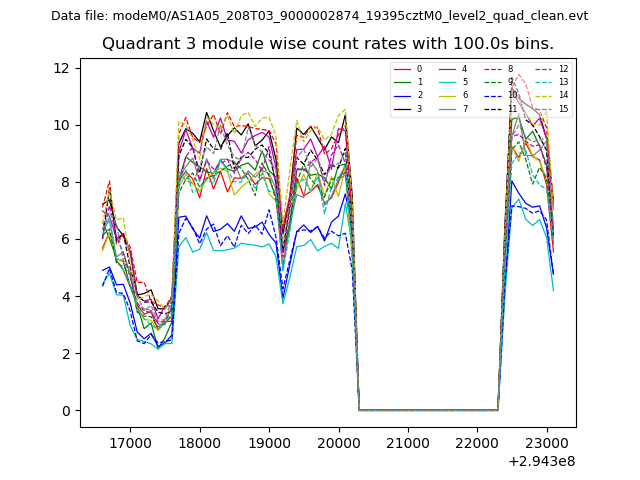
| Module-wise count rates for Quadrant C Data is divided into 100 sec bins |
 |
 |
| Module-wise count rates for Quadrant D Data is divided into 100 sec bins |
 |
 |
| Parameter | Plot |
|---|---|
| CZT HV Monitor | 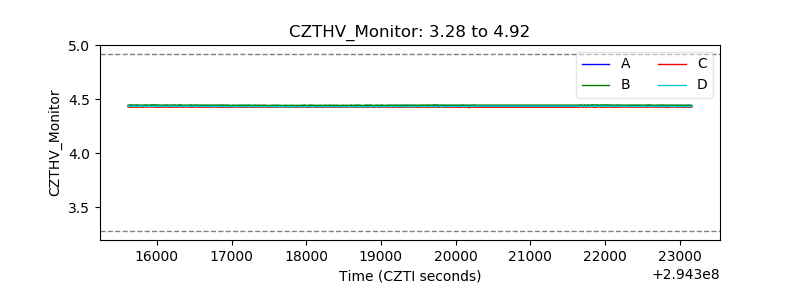 |
| D_VDD | 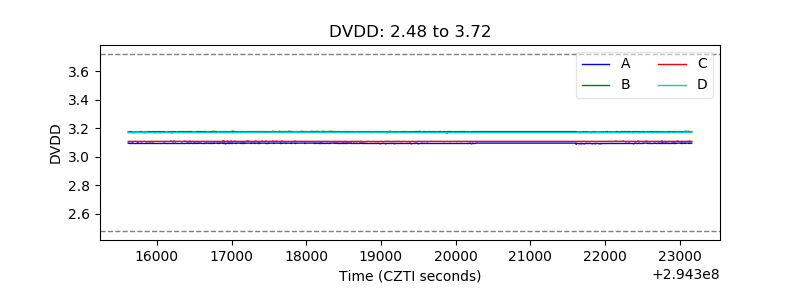 |
| Temperature 1 | 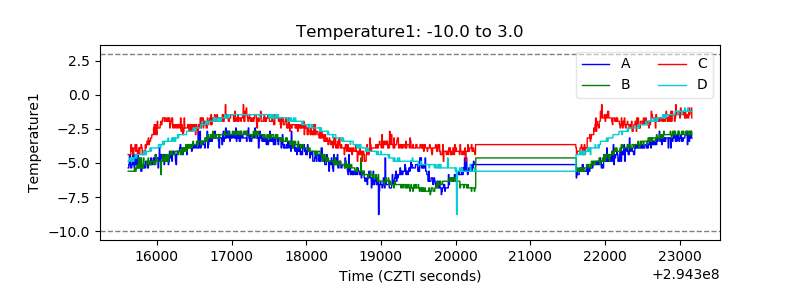 |
| Veto HV Monitor | 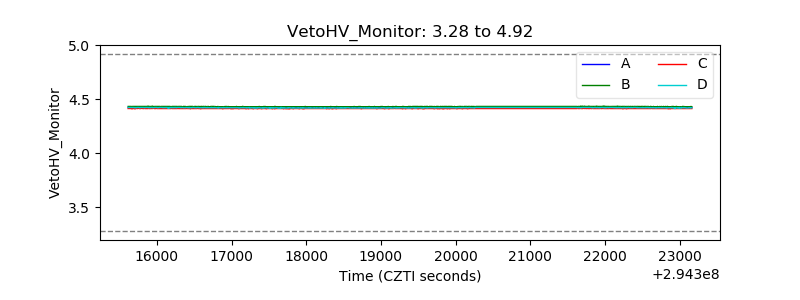 |
| Veto LLD | 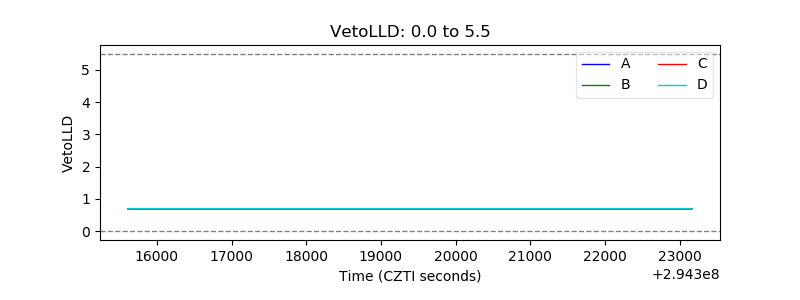 |
| Alpha Counter | 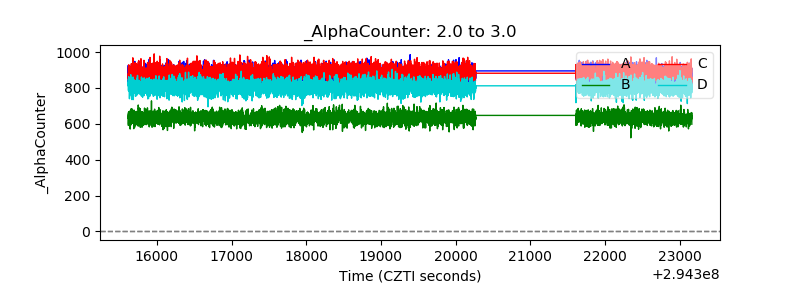 |
| _CPM_Rate | 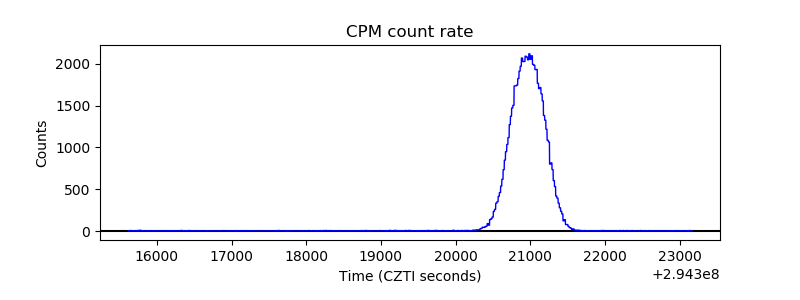 |
| CZT Counter |  |
| +2.5 Volts monitor |  |
| +5 Volts monitor | 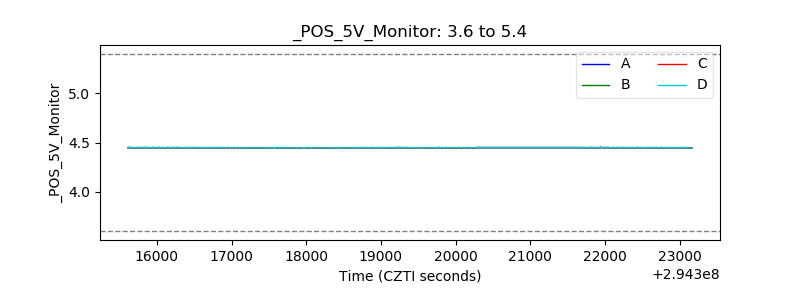 |
| _ROLL_ROT |  |
| _Roll_DEC | 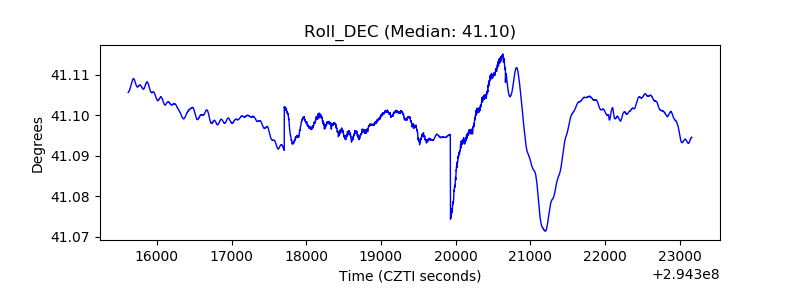 |
| _Roll_RA |  |
| Veto Counter | 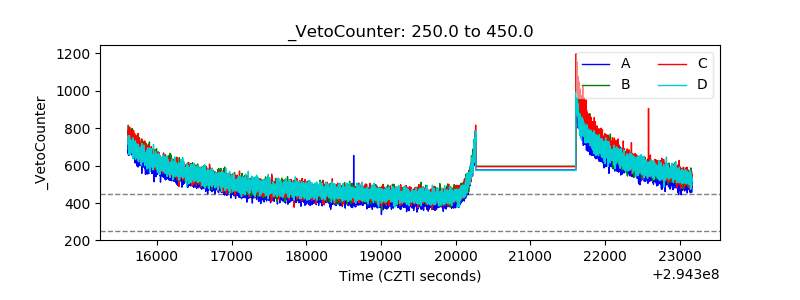 |