| Param | Original file | Final file |
|---|---|---|
| Filename | modeM0/AS1A05_208T03_9000002874_19396cztM0_level2.evt | modeM0/AS1A05_208T03_9000002874_19396cztM0_level2_quad_clean.evt |
| Size (bytes) | 581,276,160 | 105,822,720 |
| Size | 554.3 MB | 100.9 MB |
| Events in quadrant A | 3,189,759 | 746,136 |
| Events in quadrant B | 3,076,998 | 749,187 |
| Events in quadrant C | 3,092,779 | 708,866 |
| Events in quadrant D | 7,852,095 | 595,570 |
| Mode M9 | |||
|---|---|---|---|
| Quadrant | BADHDUFLAG | Total packets | Discarded packets |
| A | 0 | 13 | 0 |
| B | 0 | 13 | 0 |
| C | 0 | 13 | 0 |
| D | 0 | 13 | 0 |
| Mode M0 | |||
|---|---|---|---|
| Quadrant | BADHDUFLAG | Total packets | Discarded packets |
| A | 0 | 13018 | 1 |
| B | 0 | 12603 | 1 |
| C | 0 | 12553 | 1 |
| D | 0 | 27335 | 5 |
| Mode SS | |||
|---|---|---|---|
| Quadrant | BADHDUFLAG | Total packets | Discarded packets |
| A | 0 | 118 | 0 |
| B | 0 | 118 | 0 |
| C | 0 | 118 | 0 |
| D | 0 | 118 | 0 |
| Quadrant | Total seconds | Saturated seconds | Saturation percentage |
|---|---|---|---|
| A | 5785 | 119 | 2.057044% |
| B | 5785 | 100 | 1.728608% |
| C | 5785 | 139 | 2.402766% |
| D | 5784 | 1987 | 34.353389% |
Noise dominated data is calculated using 1-second bins in cleaned event files. If a bin has >2000 counts, and if more than 50% of those come from <1% of pixels, then it is considered to be noise-dominated and hence unusable.
| Quadrant | # 1 sec bins | Bins with >0 counts | Bins with >2000 counts | High rate bins dominated by noise | Noise dominated (total time) | Noise dominated (detector-on time) | Marked lightcurve |
|---|---|---|---|---|---|---|---|
| A | 7110 | 5785 | 15 | 15 | 0.21% | 0.26% | 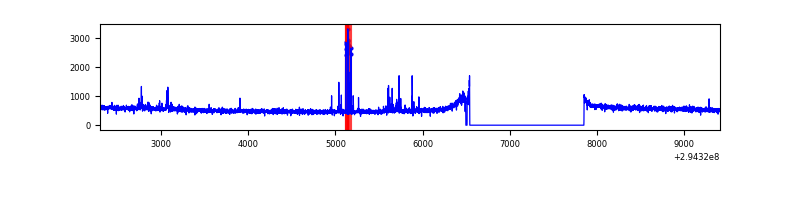 |
| B | 7110 | 5785 | 0 | 0 | 0.00% | 0.00% | 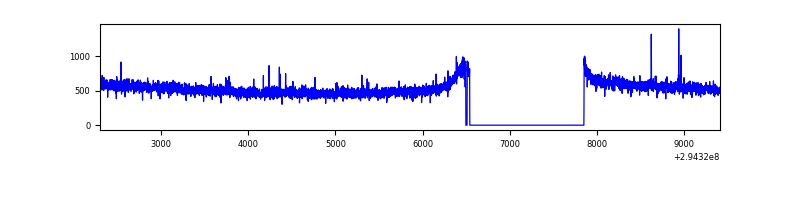 |
| C | 7110 | 5785 | 0 | 0 | 0.00% | 0.00% | 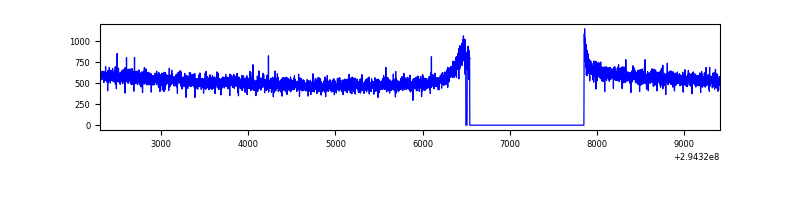 |
| D | 7108 | 5783 | 1571 | 1571 | 22.10% | 27.17% | 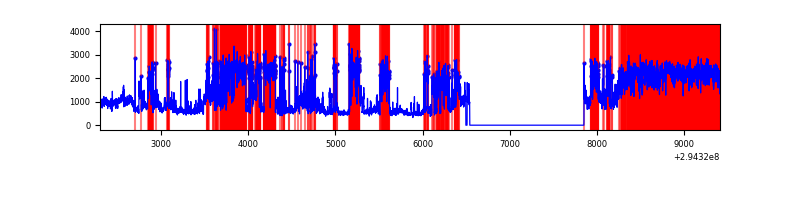 |
Top three noisy pixels from each quadrant. If the there are fewer than three noisy pixels in the level2.evt file, extra rows are filled as -1
| Pixel properties | Quadrant properties | ||||||
|---|---|---|---|---|---|---|---|
| Quadrant | DetID | PixID | Counts | Sigma | Mean | Median | Sigma |
| A | 5 | 16 | 61075 | 379.53 | 797 | 784 | 158.9 |
| A | 12 | 96 | 58555 | 363.66 | 797 | 784 | 158.9 |
| A | 13 | 254 | 7192 | 40.34 | 797 | 784 | 158.9 |
| B | 12 | 111 | 16967 | 110.95 | 780 | 762 | 146.1 |
| B | 11 | 111 | 15005 | 97.51 | 780 | 762 | 146.1 |
| B | 14 | 111 | 13154 | 84.84 | 780 | 762 | 146.1 |
| C | 14 | 238 | 118818 | 671.91 | 758 | 764 | 175.7 |
| C | 3 | 233 | 10792 | 57.08 | 758 | 764 | 175.7 |
| C | 7 | 247 | 5422 | 26.51 | 758 | 764 | 175.7 |
| D | 10 | 66 | 4273243 | 25680.78 | 690 | 673 | 166.4 |
| D | 1 | 52 | 608159 | 3651.37 | 690 | 673 | 166.4 |
| D | 7 | 238 | 288735 | 1731.43 | 690 | 673 | 166.4 |
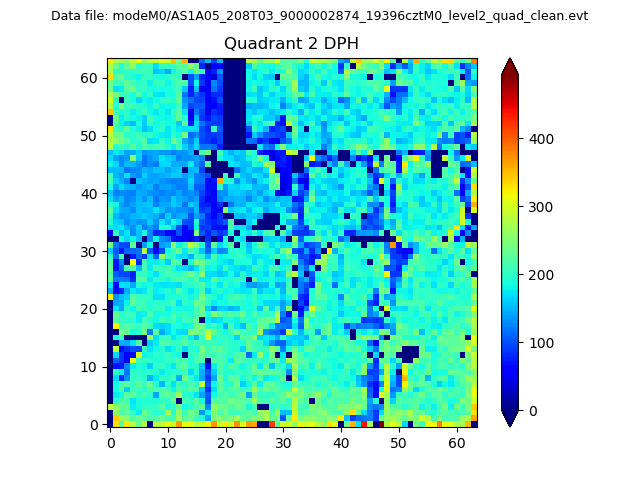
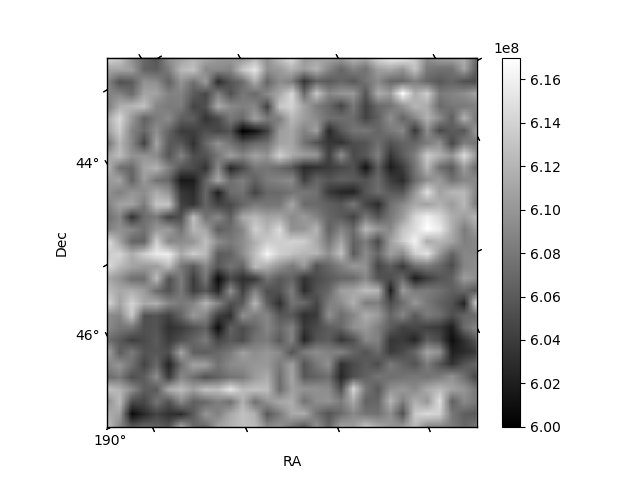
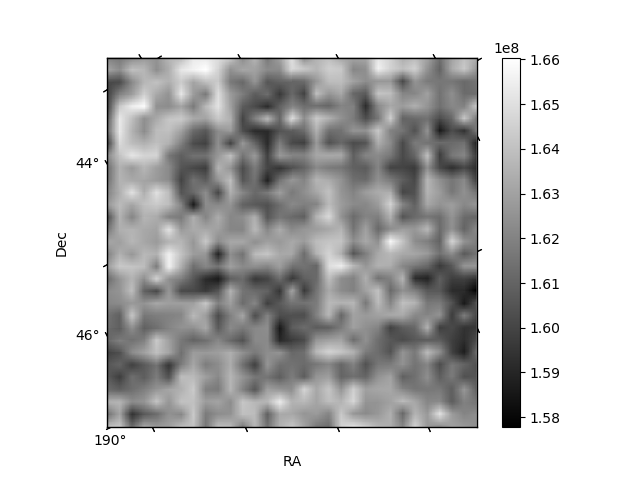
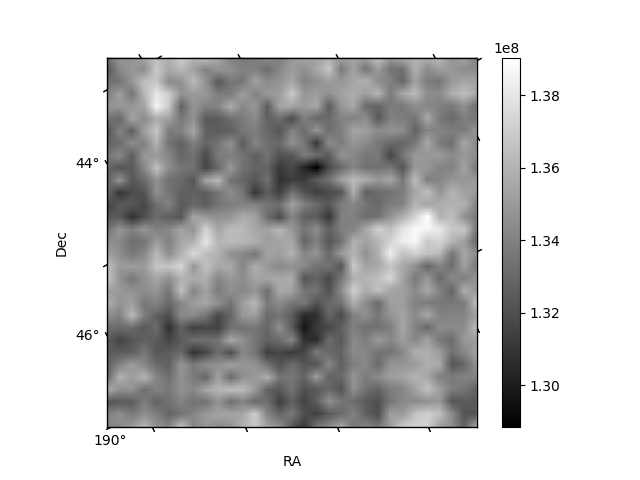
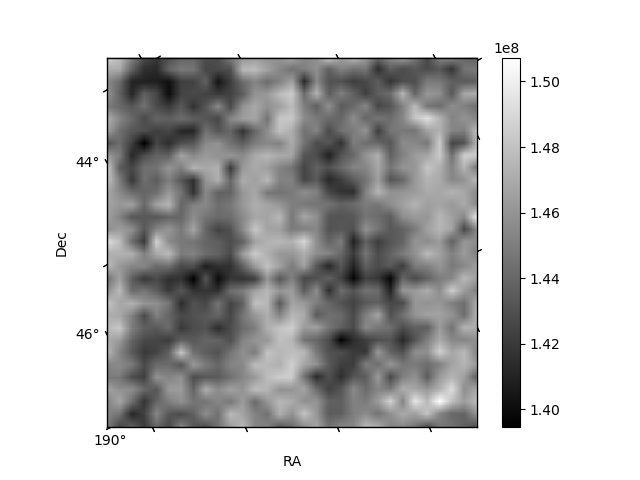
Histogram calculated using DETX and DETY for each event in the final _common_clean file
| Quadrant A | 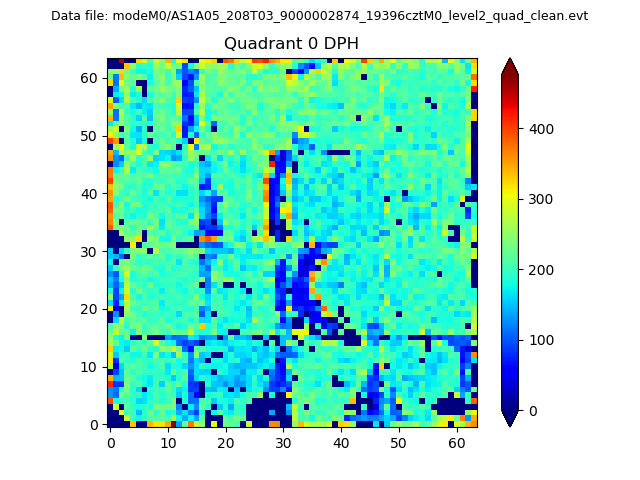 |
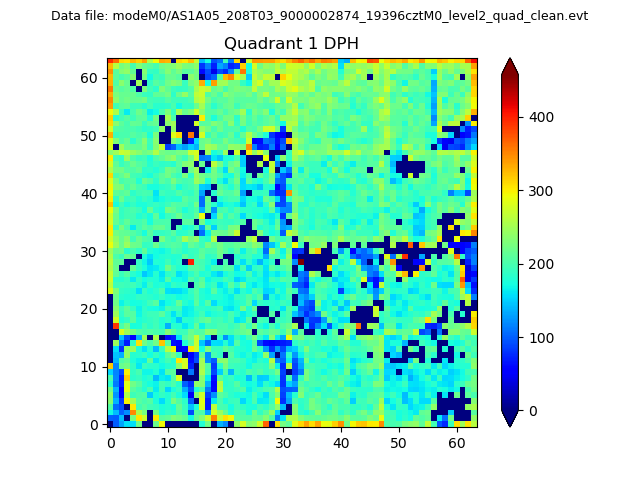 |
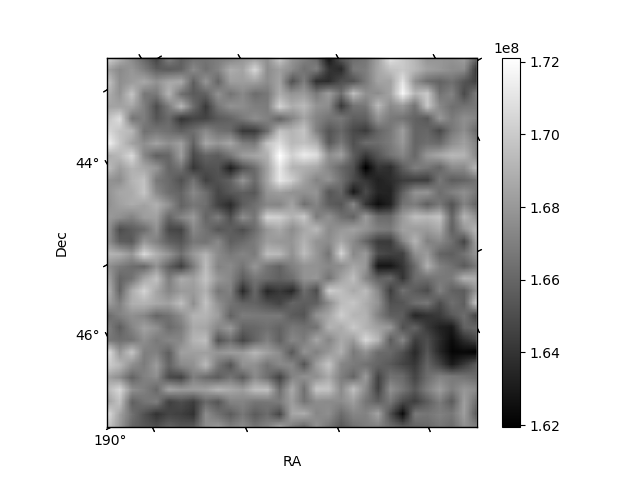
Quadrant B |
|---|---|---|---|
| Quadrant D | 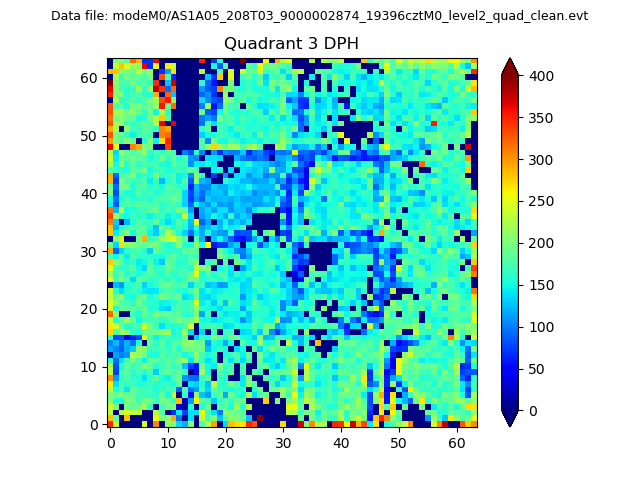 |
 |
Quadrant C |
| Plot type | Count rate plots | Images |
|---|---|---|
| Comparison with Poisson distribution Blue bars denote a histogram of data divided into 1 sec bins. Red curve is a Poisson curve with rate = median count rate of data. |
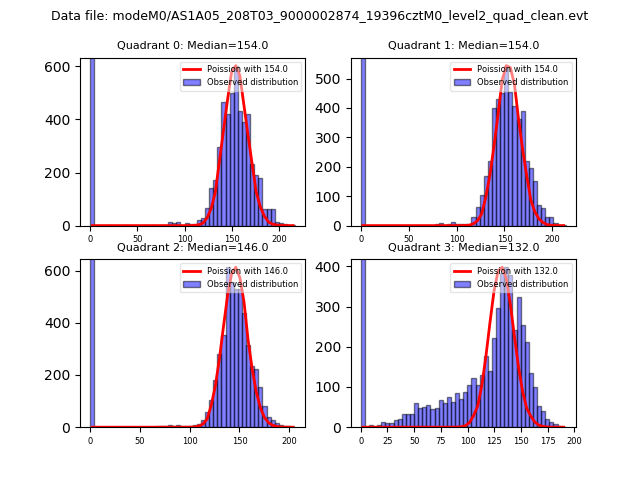 |
 |
| Quadrant-wise count rates Data is divided into 100 sec bins |
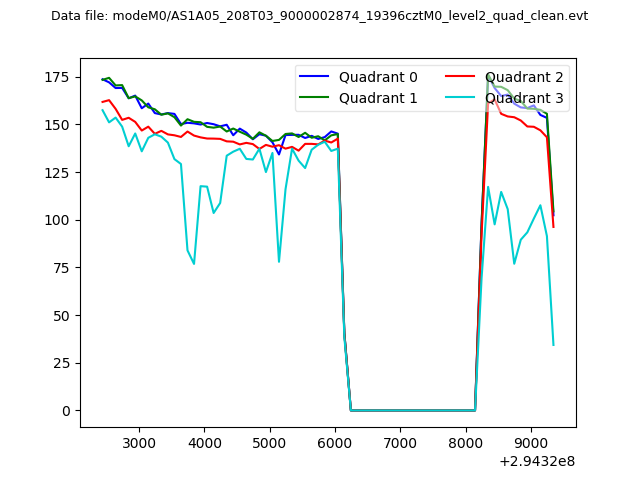 |
|
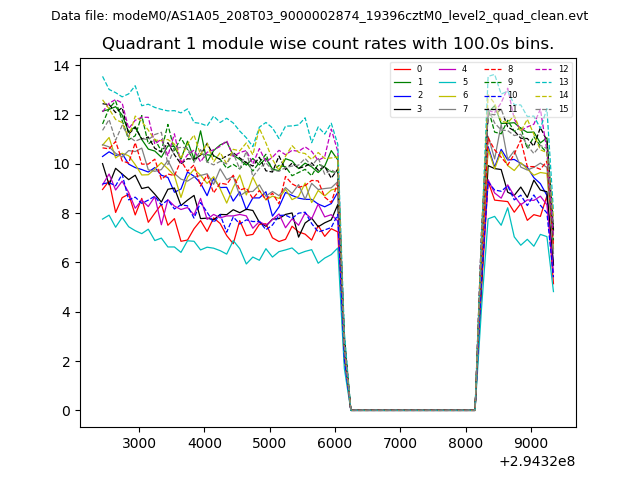
| Module-wise count rates for Quadrant A Data is divided into 100 sec bins |
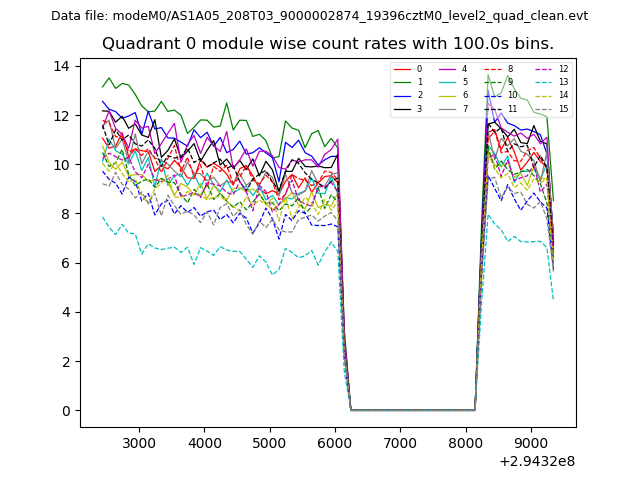 |
 |
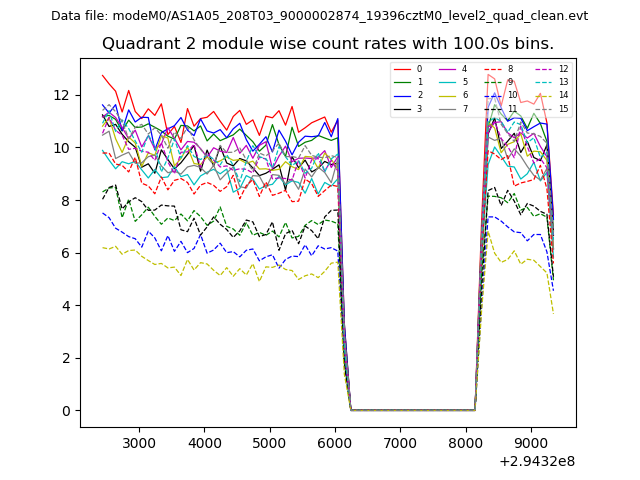
| Module-wise count rates for Quadrant B Data is divided into 100 sec bins |
 |
 |
| Module-wise count rates for Quadrant C Data is divided into 100 sec bins |
 |
 |
| Module-wise count rates for Quadrant D Data is divided into 100 sec bins |
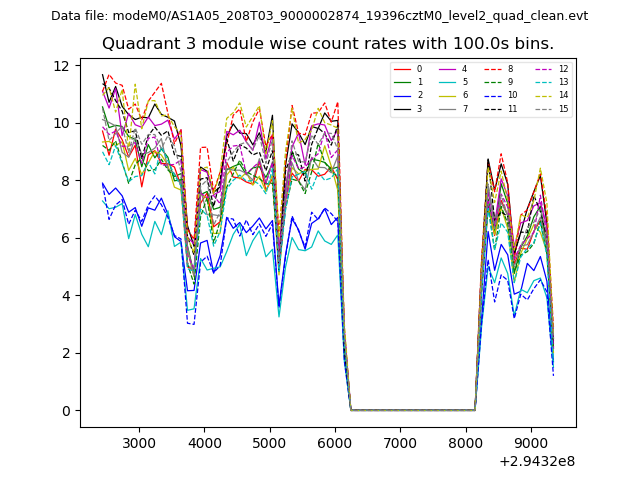 |
 |
| Parameter | Plot |
|---|---|
| CZT HV Monitor | 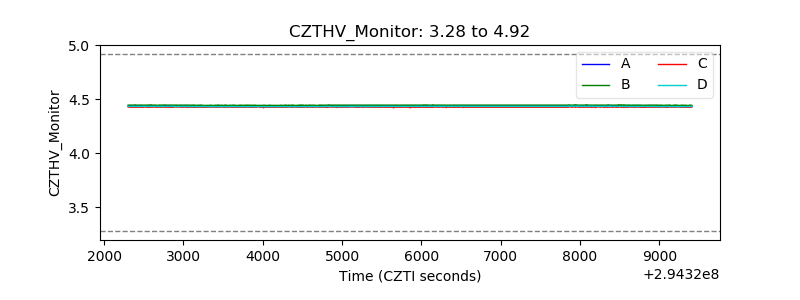 |
| D_VDD | 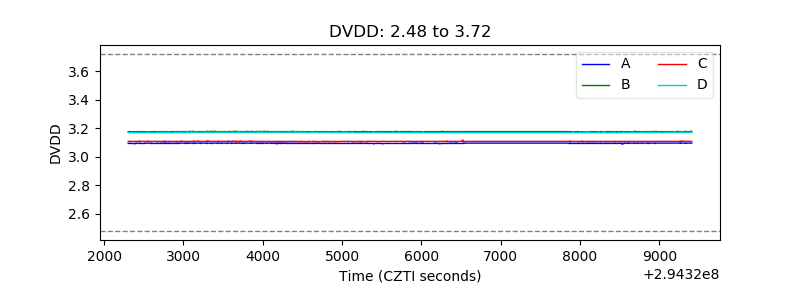 |
| Temperature 1 | 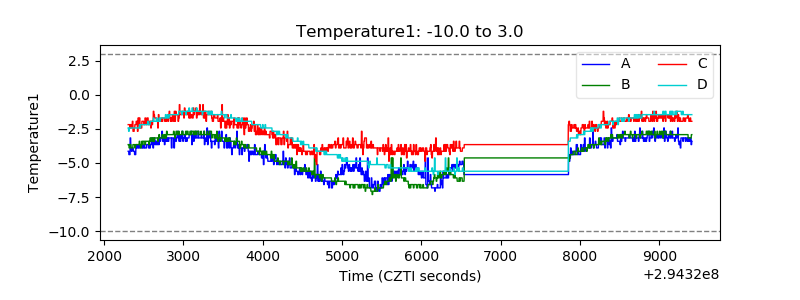 |
| Veto HV Monitor | 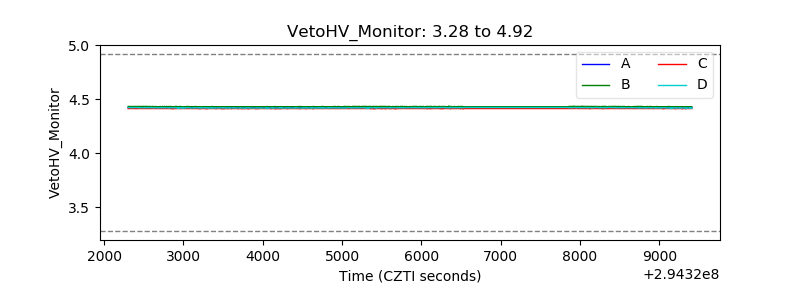 |
| Veto LLD | 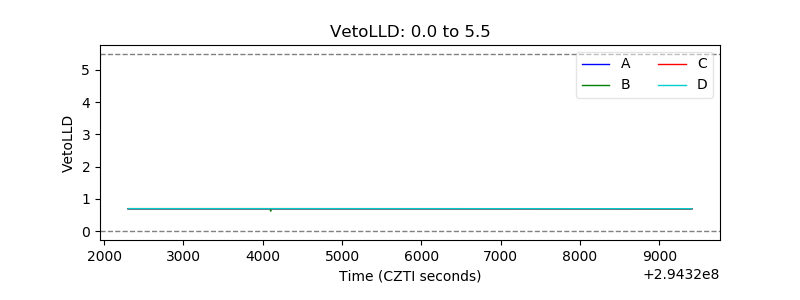 |
| Alpha Counter | 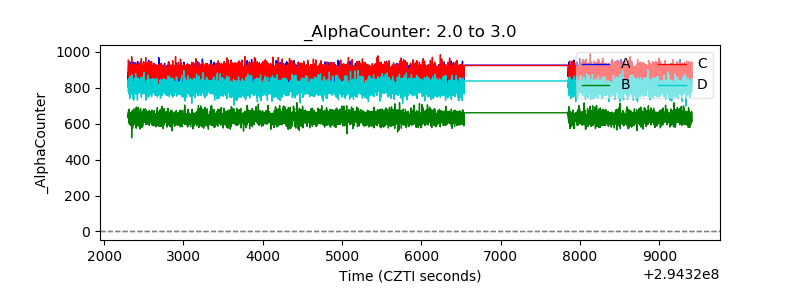 |
| _CPM_Rate | 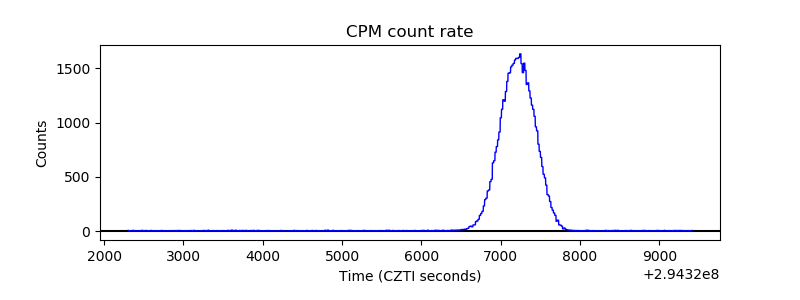 |
| CZT Counter | 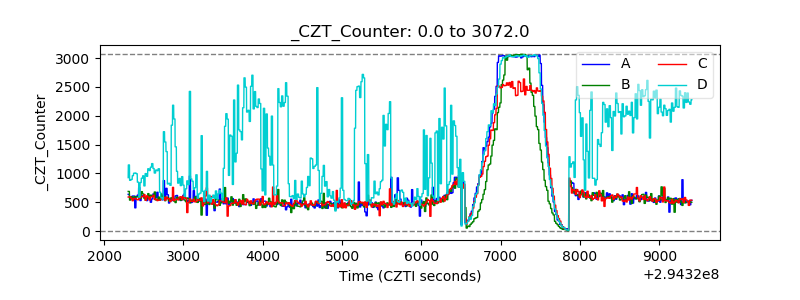 |
| +2.5 Volts monitor | 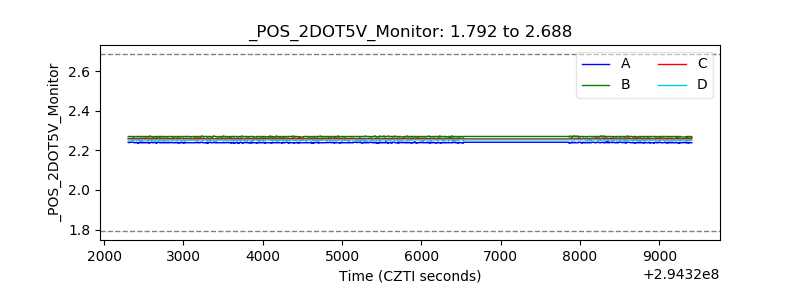 |
| +5 Volts monitor |  |
| _ROLL_ROT | 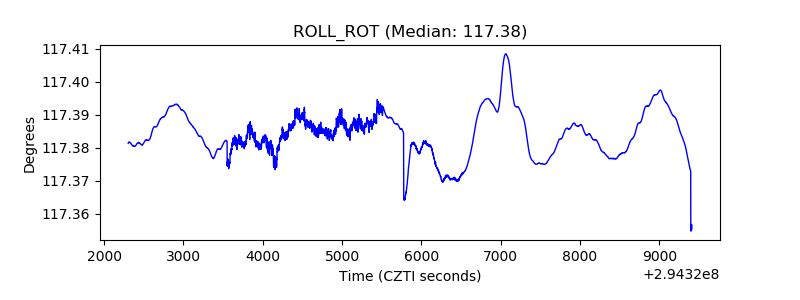 |
| _Roll_DEC | 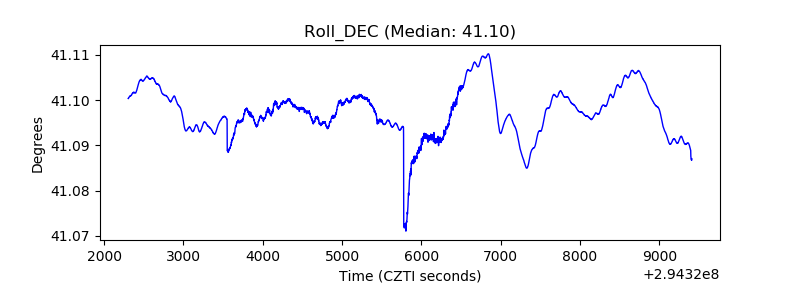 |
| _Roll_RA | 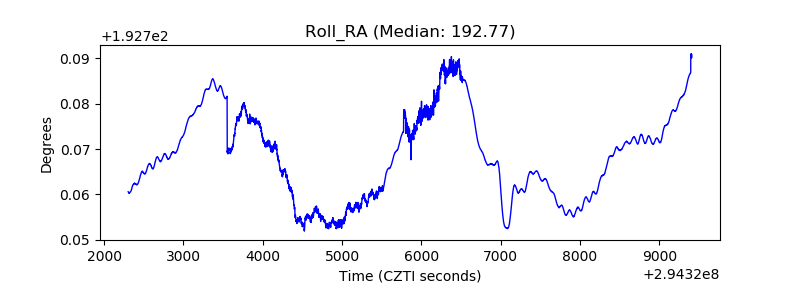 |
| Veto Counter | 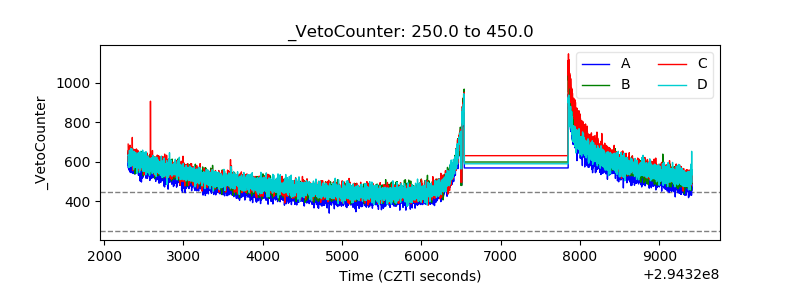 |