| Param | Original file | Final file |
|---|---|---|
| Filename | modeM0/AS1A05_208T03_9000002874_19397cztM0_level2.evt | modeM0/AS1A05_208T03_9000002874_19397cztM0_level2_quad_clean.evt |
| Size (bytes) | 682,352,640 | 95,633,280 |
| Size | 650.7 MB | 91.2 MB |
| Events in quadrant A | 2,856,769 | 700,523 |
| Events in quadrant B | 2,877,052 | 701,429 |
| Events in quadrant C | 2,914,191 | 670,232 |
| Events in quadrant D | 11,636,529 | 429,792 |
| Mode M9 | |||
|---|---|---|---|
| Quadrant | BADHDUFLAG | Total packets | Discarded packets |
| A | 0 | 12 | 0 |
| B | 0 | 12 | 0 |
| C | 0 | 12 | 0 |
| D | 0 | 12 | 0 |
| Mode M0 | |||
|---|---|---|---|
| Quadrant | BADHDUFLAG | Total packets | Discarded packets |
| A | 0 | 11858 | 1 |
| B | 0 | 11946 | 1 |
| C | 0 | 11924 | 2 |
| D | 0 | 38410 | 1 |
| Mode SS | |||
|---|---|---|---|
| Quadrant | BADHDUFLAG | Total packets | Discarded packets |
| A | 0 | 116 | 0 |
| B | 0 | 116 | 0 |
| C | 0 | 116 | 0 |
| D | 0 | 116 | 0 |
| Quadrant | Total seconds | Saturated seconds | Saturation percentage |
|---|---|---|---|
| A | 5605 | 78 | 1.391615% |
| B | 5606 | 93 | 1.658937% |
| C | 5605 | 119 | 2.123104% |
| D | 5605 | 4169 | 74.380018% |
Noise dominated data is calculated using 1-second bins in cleaned event files. If a bin has >2000 counts, and if more than 50% of those come from <1% of pixels, then it is considered to be noise-dominated and hence unusable.
| Quadrant | # 1 sec bins | Bins with >0 counts | Bins with >2000 counts | High rate bins dominated by noise | Noise dominated (total time) | Noise dominated (detector-on time) | Marked lightcurve |
|---|---|---|---|---|---|---|---|
| A | 6860 | 5606 | 3 | 3 | 0.04% | 0.05% | 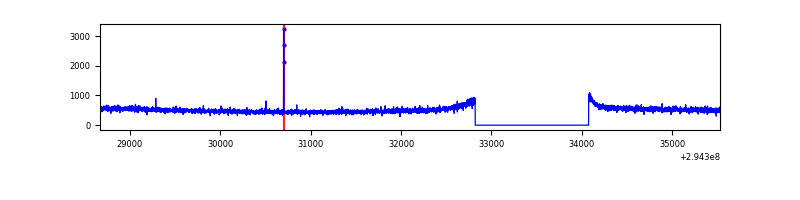 |
| B | 6861 | 5607 | 0 | 0 | 0.00% | 0.00% | 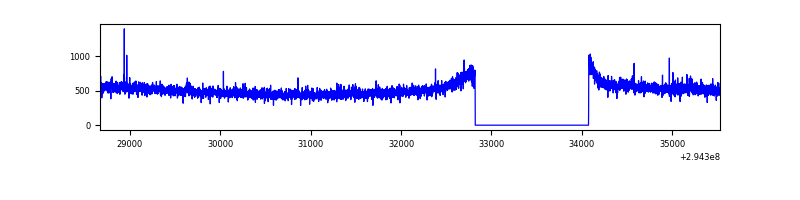 |
| C | 6860 | 5605 | 0 | 0 | 0.00% | 0.00% | 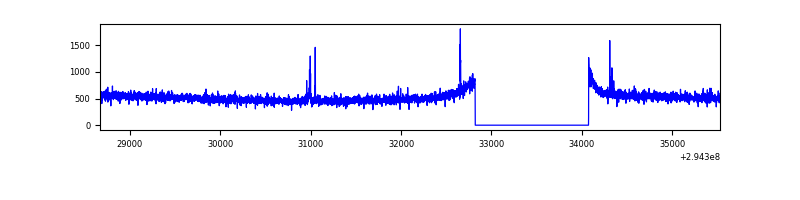 |
| D | 6859 | 5604 | 3536 | 3536 | 51.55% | 63.10% | 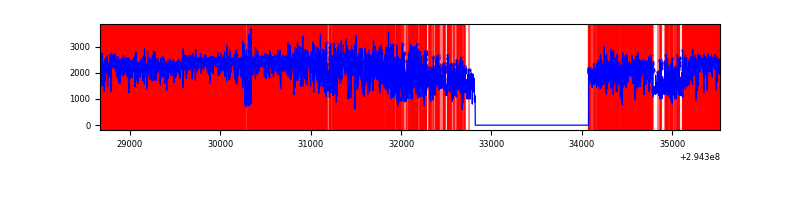 |
Top three noisy pixels from each quadrant. If the there are fewer than three noisy pixels in the level2.evt file, extra rows are filled as -1
| Pixel properties | Quadrant properties | ||||||
|---|---|---|---|---|---|---|---|
| Quadrant | DetID | PixID | Counts | Sigma | Mean | Median | Sigma |
| A | 5 | 16 | 9661 | 60.25 | 738 | 723 | 148.4 |
| A | 13 | 254 | 7333 | 44.56 | 738 | 723 | 148.4 |
| A | 0 | 226 | 6377 | 38.11 | 738 | 723 | 148.4 |
| B | 12 | 111 | 15788 | 110.63 | 725 | 709 | 136.3 |
| B | 11 | 111 | 14338 | 99.99 | 725 | 709 | 136.3 |
| B | 0 | 229 | 13519 | 93.98 | 725 | 709 | 136.3 |
| C | 14 | 238 | 111024 | 673.44 | 708 | 713 | 163.8 |
| C | 3 | 233 | 14458 | 83.91 | 708 | 713 | 163.8 |
| C | 14 | 225 | 12789 | 73.72 | 708 | 713 | 163.8 |
| D | 10 | 66 | 9028831 | 69949.05 | 528 | 513 | 129.1 |
| D | 7 | 238 | 251104 | 1941.51 | 528 | 513 | 129.1 |
| D | 12 | 218 | 93472 | 720.22 | 528 | 513 | 129.1 |
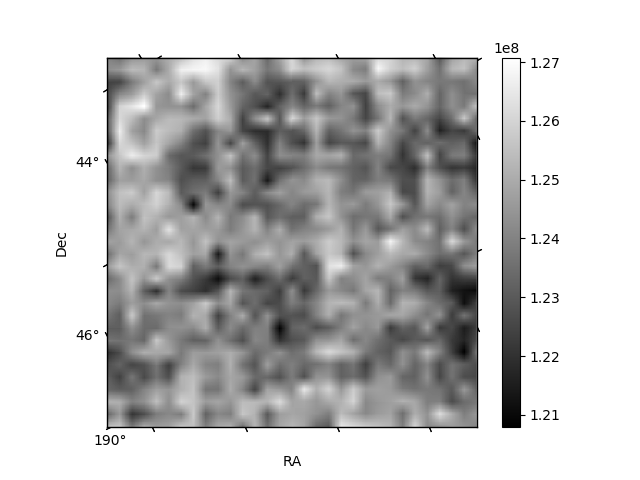
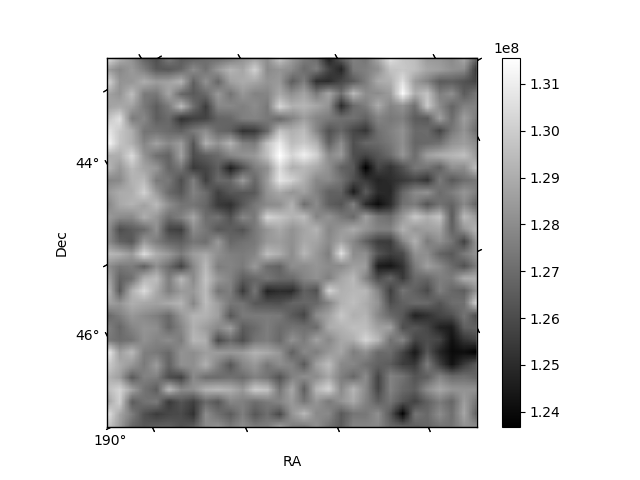
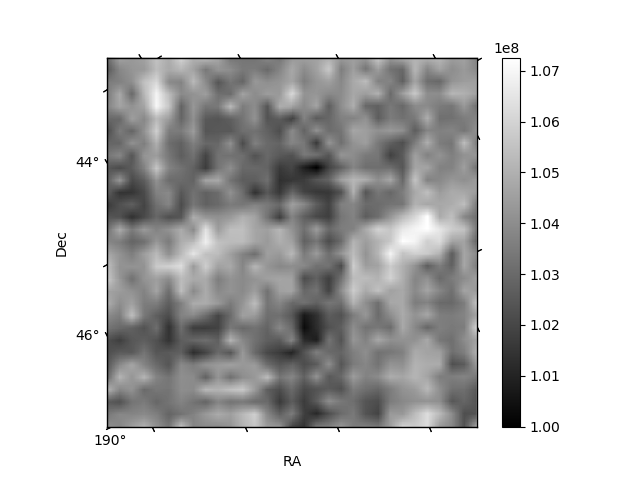
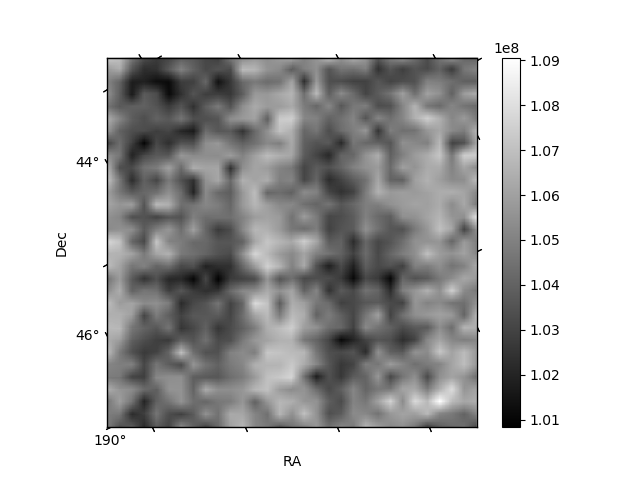
Histogram calculated using DETX and DETY for each event in the final _common_clean file
| Quadrant A | 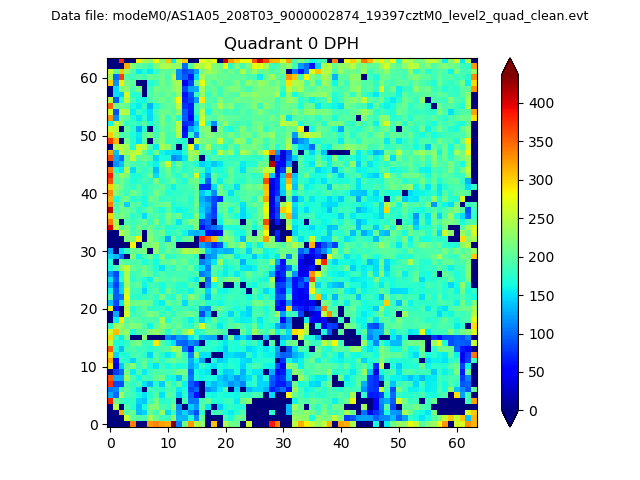 |
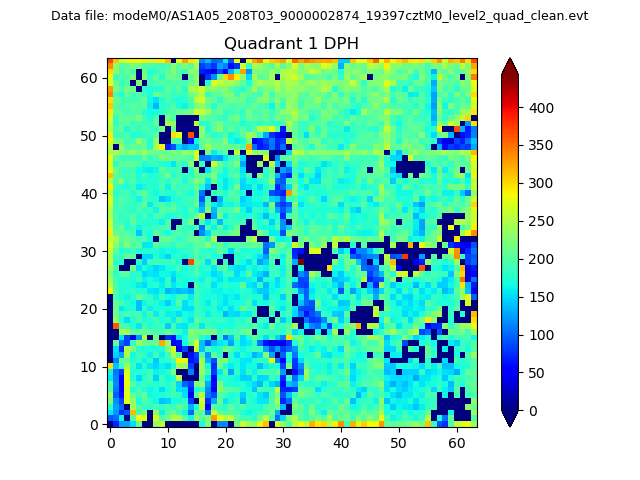 |
Quadrant B |
|---|---|---|---|
| Quadrant D | 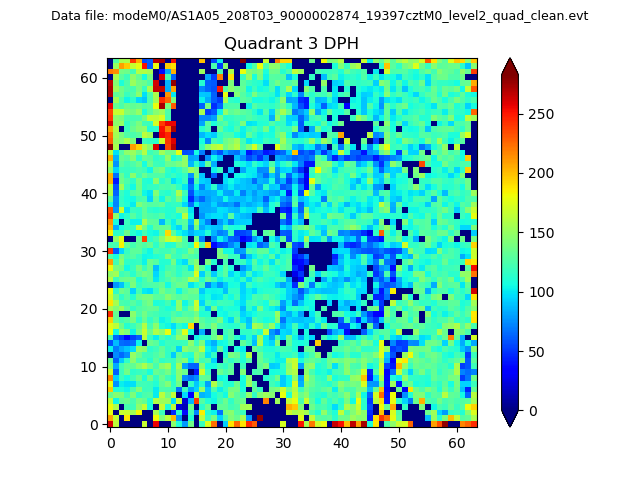 |
 |
Quadrant C |
| Plot type | Count rate plots | Images |
|---|---|---|
| Comparison with Poisson distribution Blue bars denote a histogram of data divided into 1 sec bins. Red curve is a Poisson curve with rate = median count rate of data. |
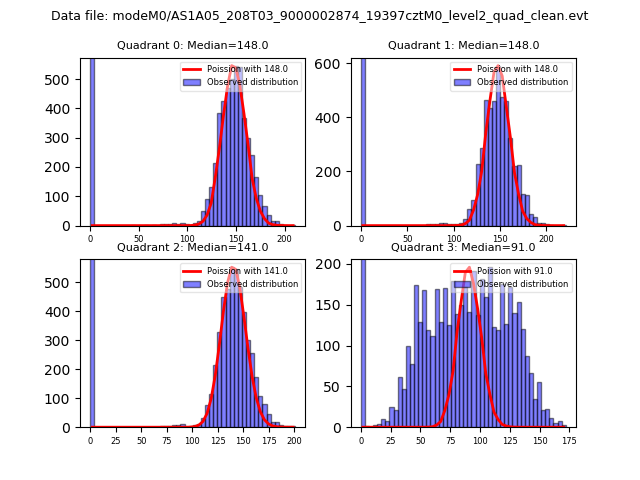 |
 |
| Quadrant-wise count rates Data is divided into 100 sec bins |
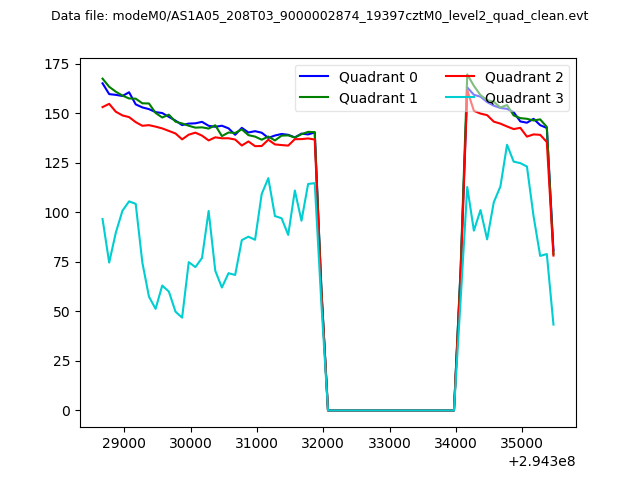 |
|
| Module-wise count rates for Quadrant A Data is divided into 100 sec bins |
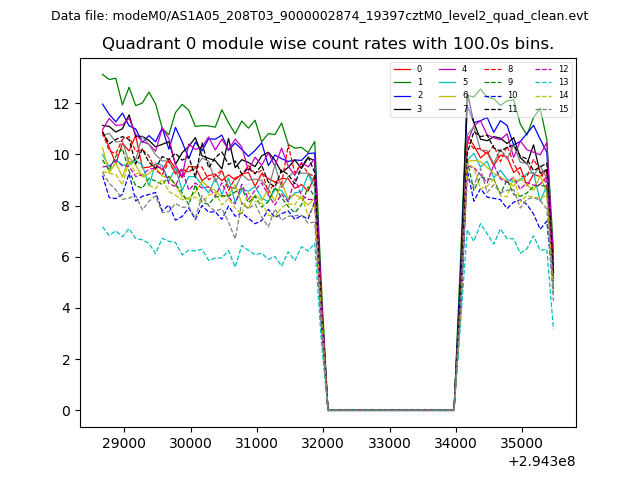 |
 |
| Module-wise count rates for Quadrant B Data is divided into 100 sec bins |
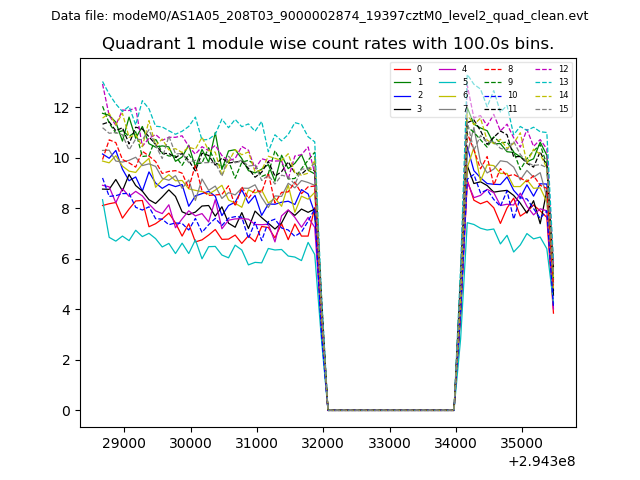 |
 |
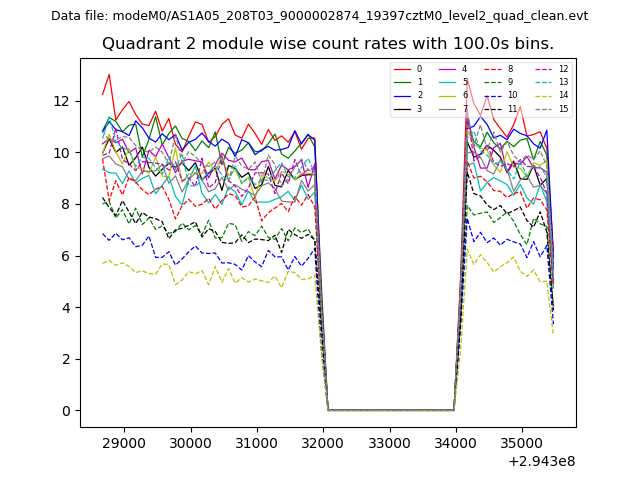
| Module-wise count rates for Quadrant C Data is divided into 100 sec bins |
 |
 |
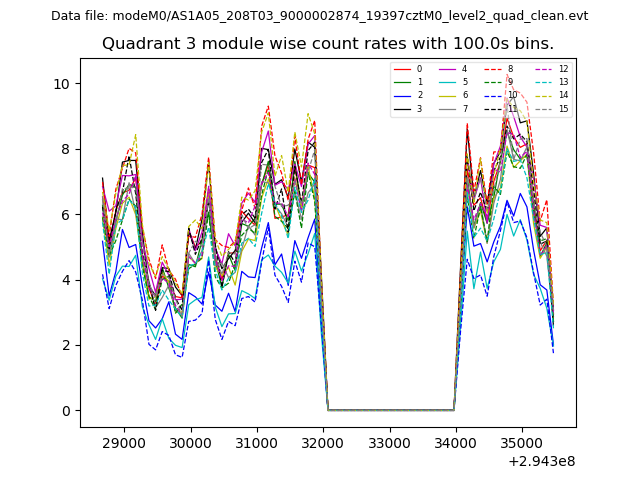
| Module-wise count rates for Quadrant D Data is divided into 100 sec bins |
 |
 |
| Parameter | Plot |
|---|---|
| CZT HV Monitor | 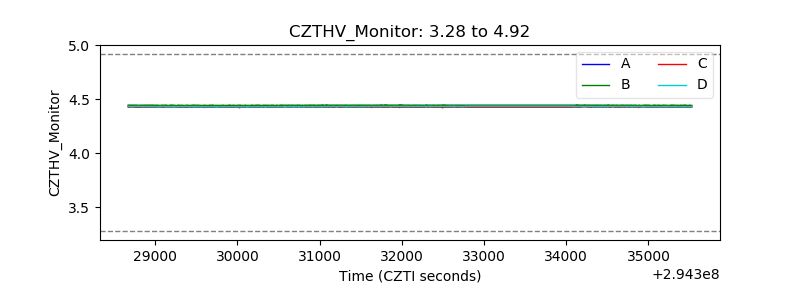 |
| D_VDD | 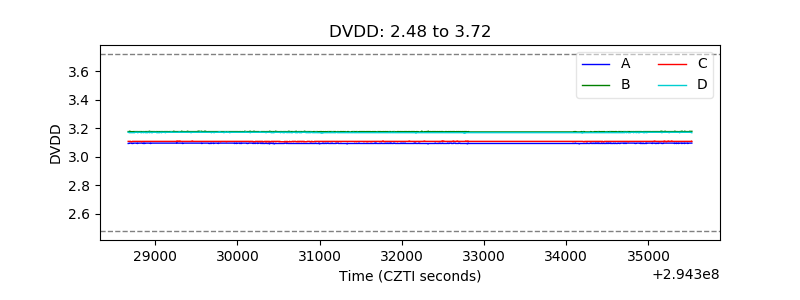 |
| Temperature 1 |  |
| Veto HV Monitor | 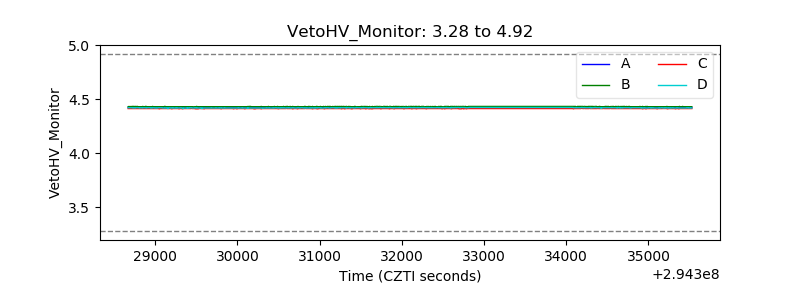 |
| Veto LLD | 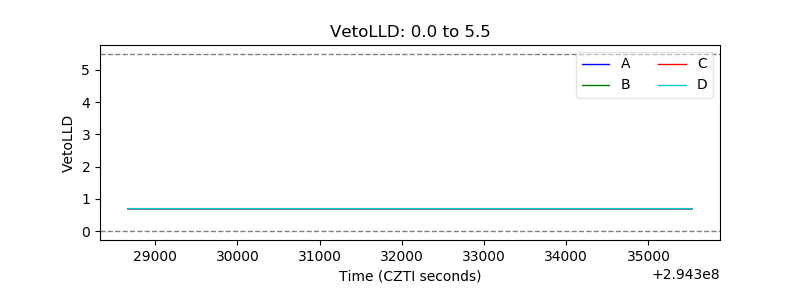 |
| Alpha Counter | 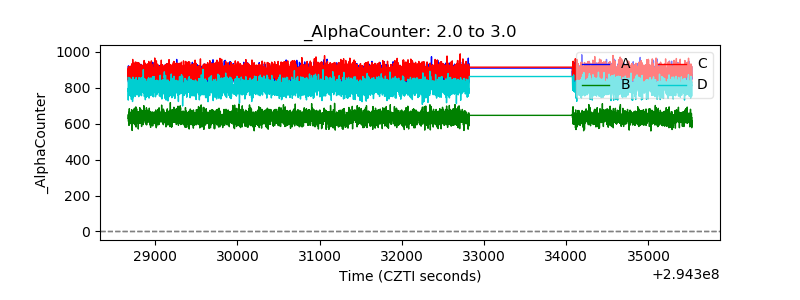 |
| _CPM_Rate | 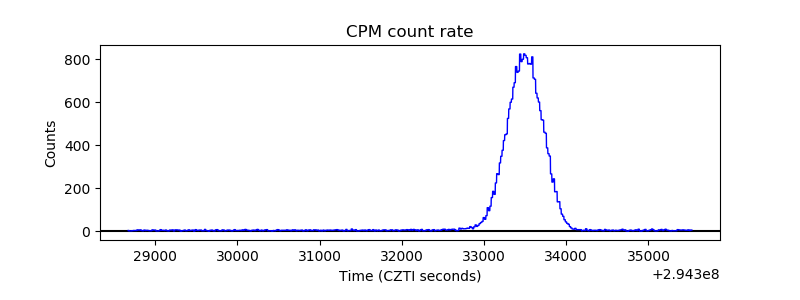 |
| CZT Counter | 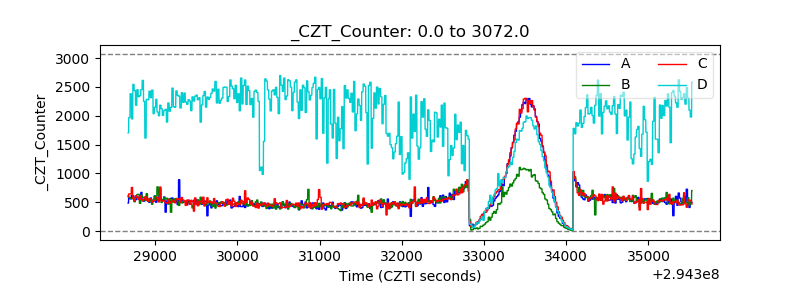 |
| +2.5 Volts monitor |  |
| +5 Volts monitor |  |
| _ROLL_ROT | 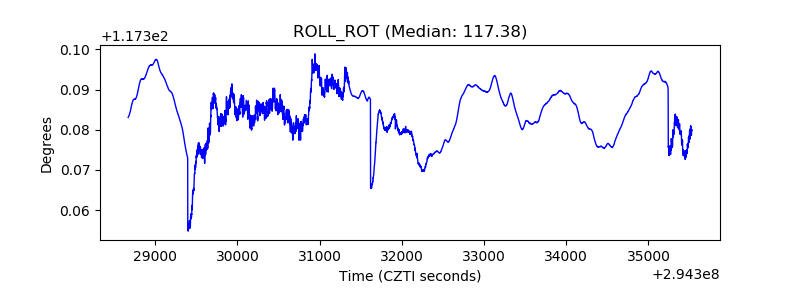 |
| _Roll_DEC | 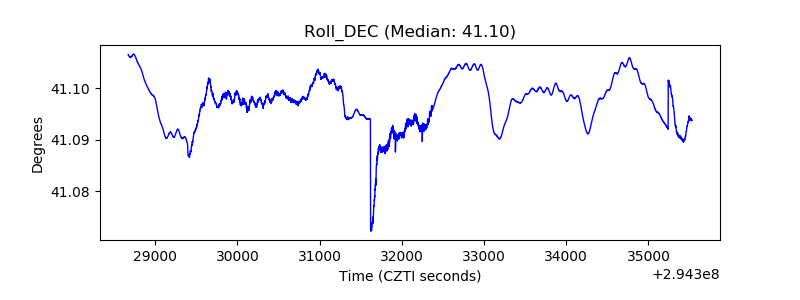 |
| _Roll_RA |  |
| Veto Counter | 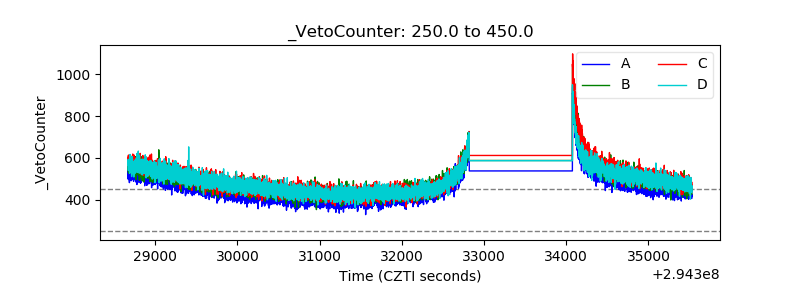 |