| Param | Original file | Final file |
|---|---|---|
| Filename | modeM0/AS1A05_208T03_9000002874_19399cztM0_level2.evt | modeM0/AS1A05_208T03_9000002874_19399cztM0_level2_quad_clean.evt |
| Size (bytes) | 184,248,000 | 25,176,960 |
| Size | 175.7 MB | 24.0 MB |
| Events in quadrant A | 676,381 | 192,032 |
| Events in quadrant B | 712,130 | 192,520 |
| Events in quadrant C | 709,404 | 185,100 |
| Events in quadrant D | 3,381,986 | 85,104 |
| Mode M0 | |||
|---|---|---|---|
| Quadrant | BADHDUFLAG | Total packets | Discarded packets |
| A | 0 | 2881 | 0 |
| B | 0 | 2966 | 0 |
| C | 0 | 2937 | 0 |
| D | 0 | 11003 | 0 |
| Mode SS | |||
|---|---|---|---|
| Quadrant | BADHDUFLAG | Total packets | Discarded packets |
| A | 0 | 28 | 0 |
| B | 0 | 28 | 0 |
| C | 0 | 28 | 0 |
| D | 0 | 28 | 0 |
| Quadrant | Total seconds | Saturated seconds | Saturation percentage |
|---|---|---|---|
| A | 1434 | 0 | 0.000000% |
| B | 1435 | 0 | 0.000000% |
| C | 1435 | 7 | 0.487805% |
| D | 1435 | 1404 | 97.839721% |
Noise dominated data is calculated using 1-second bins in cleaned event files. If a bin has >2000 counts, and if more than 50% of those come from <1% of pixels, then it is considered to be noise-dominated and hence unusable.
| Quadrant | # 1 sec bins | Bins with >0 counts | Bins with >2000 counts | High rate bins dominated by noise | Noise dominated (total time) | Noise dominated (detector-on time) | Marked lightcurve |
|---|---|---|---|---|---|---|---|
| A | 1434 | 1434 | 0 | 0 | 0.00% | 0.00% | 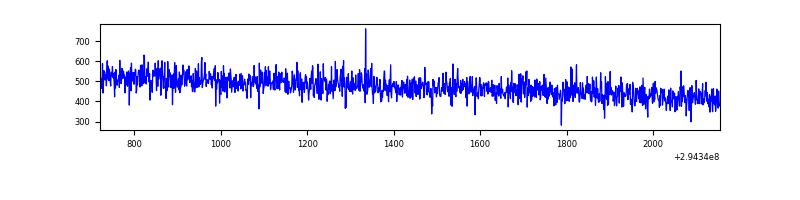 |
| B | 1435 | 1435 | 0 | 0 | 0.00% | 0.00% | 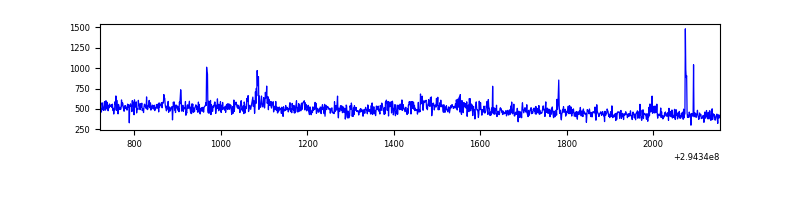 |
| C | 1435 | 1435 | 0 | 0 | 0.00% | 0.00% | 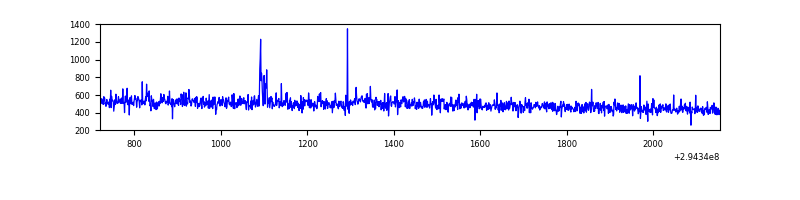 |
| D | 1434 | 1434 | 1335 | 1335 | 93.10% | 93.10% | 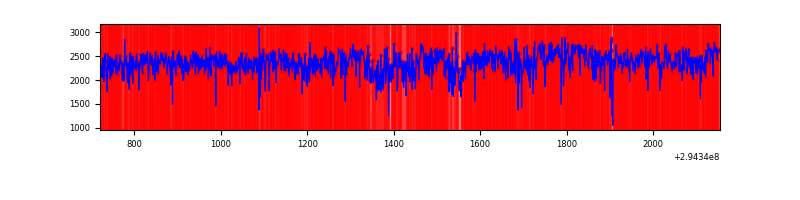 |
Top three noisy pixels from each quadrant. If the there are fewer than three noisy pixels in the level2.evt file, extra rows are filled as -1
| Pixel properties | Quadrant properties | ||||||
|---|---|---|---|---|---|---|---|
| Quadrant | DetID | PixID | Counts | Sigma | Mean | Median | Sigma |
| A | 13 | 254 | 2306 | 55.85 | 175 | 170 | 38.2 |
| A | 0 | 226 | 1528 | 35.51 | 175 | 170 | 38.2 |
| A | 3 | 137 | 1327 | 30.25 | 175 | 170 | 38.2 |
| B | 0 | 198 | 21382 | 612.84 | 172 | 168 | 34.6 |
| B | 0 | 190 | 11060 | 314.65 | 172 | 168 | 34.6 |
| B | 12 | 111 | 3810 | 105.21 | 172 | 168 | 34.6 |
| C | 14 | 238 | 26141 | 625.93 | 171 | 172 | 41.5 |
| C | 7 | 247 | 7737 | 182.34 | 171 | 172 | 41.5 |
| C | 3 | 233 | 4846 | 112.66 | 171 | 172 | 41.5 |
| D | 10 | 66 | 1891090 | 78072.91 | 93 | 90 | 24.2 |
| D | 7 | 238 | 970548 | 40066.89 | 93 | 90 | 24.2 |
| D | 2 | 16 | 141349 | 5832.1 | 93 | 90 | 24.2 |
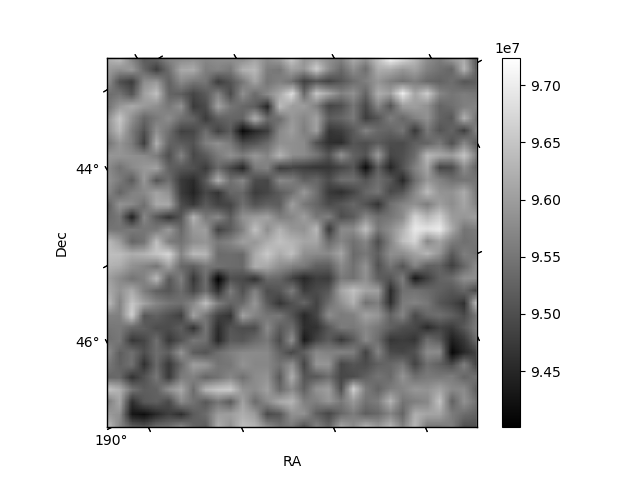
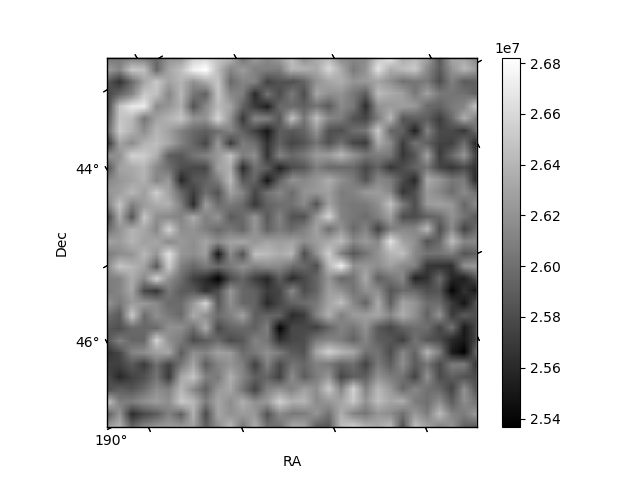
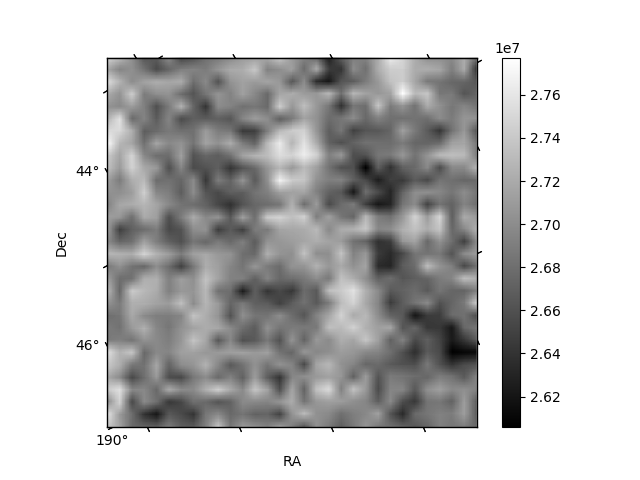
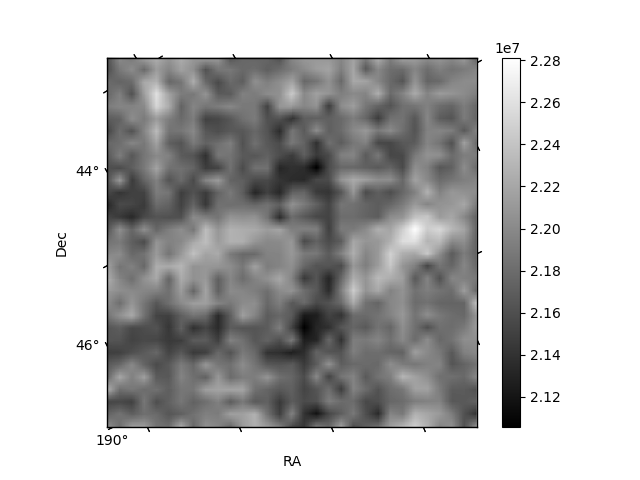
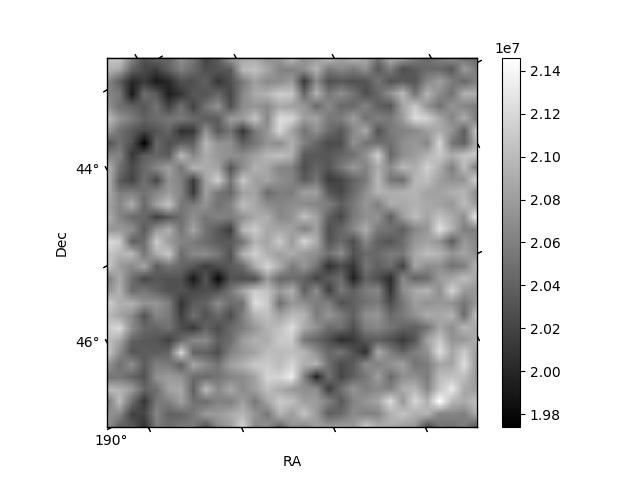
Histogram calculated using DETX and DETY for each event in the final _common_clean file
| Quadrant A | 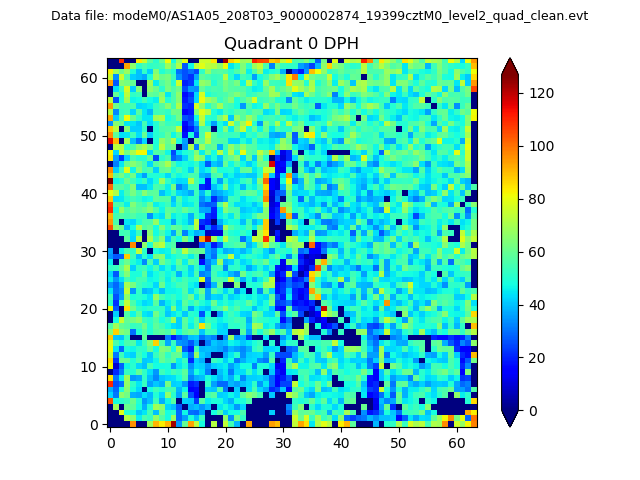 |
 |
Quadrant B |
|---|---|---|---|
| Quadrant D | 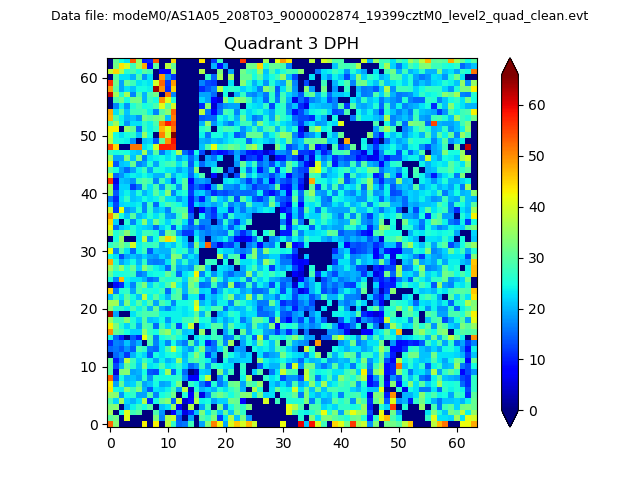 |
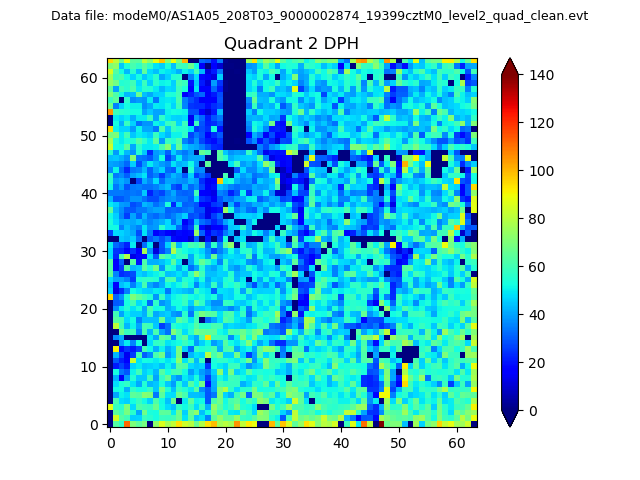 |
Quadrant C |
| Plot type | Count rate plots | Images |
|---|---|---|
| Comparison with Poisson distribution Blue bars denote a histogram of data divided into 1 sec bins. Red curve is a Poisson curve with rate = median count rate of data. |
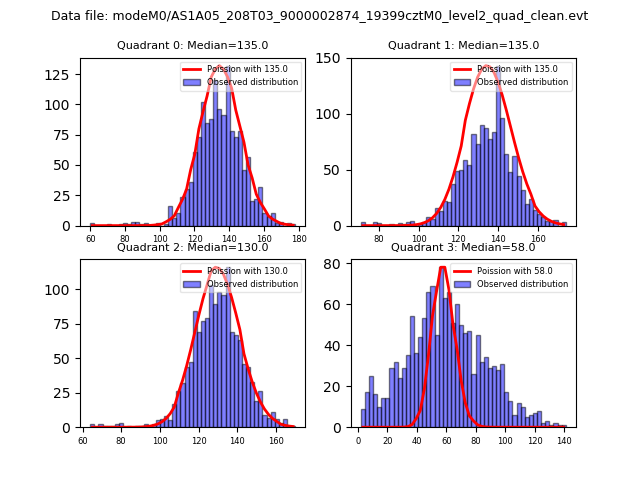 |
 |
| Quadrant-wise count rates Data is divided into 100 sec bins |
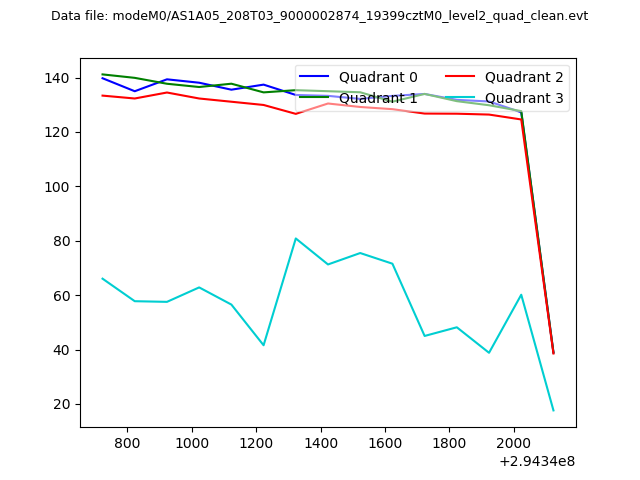 |
|
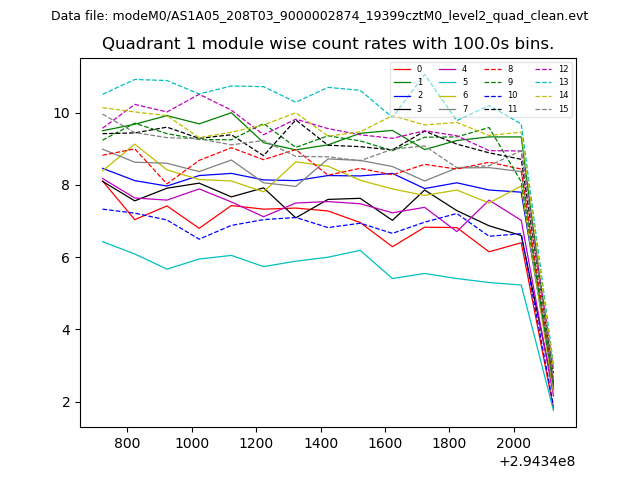
| Module-wise count rates for Quadrant A Data is divided into 100 sec bins |
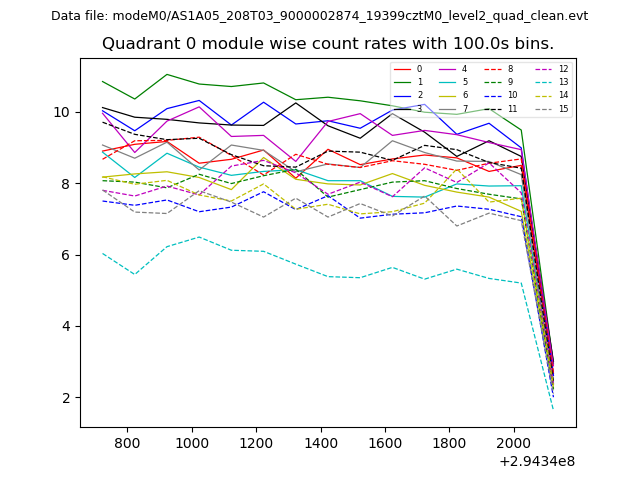 |
 |
| Module-wise count rates for Quadrant B Data is divided into 100 sec bins |
 |
 |
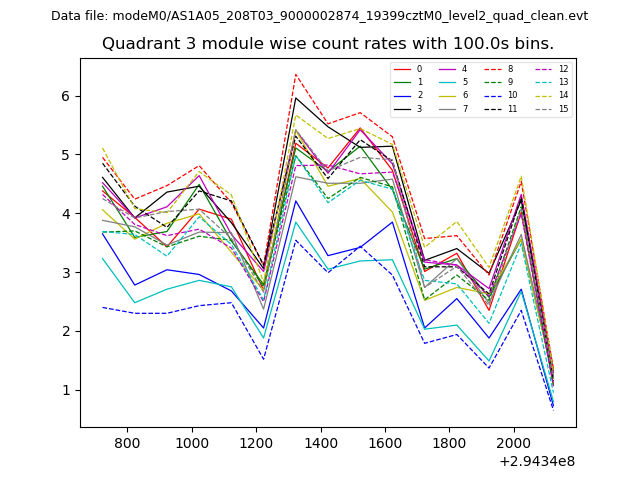
| Module-wise count rates for Quadrant C Data is divided into 100 sec bins |
 |
 |
| Module-wise count rates for Quadrant D Data is divided into 100 sec bins |
 |
 |
| Parameter | Plot |
|---|---|
| CZT HV Monitor | 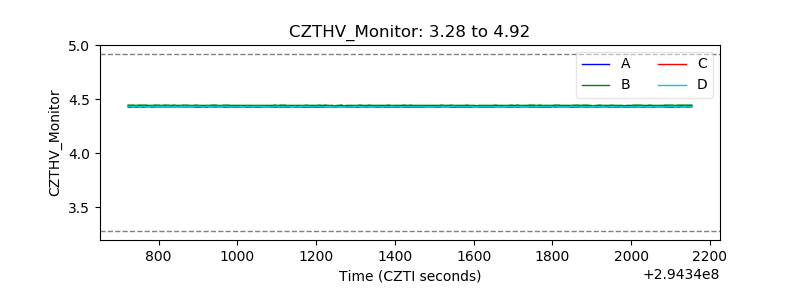 |
| D_VDD | 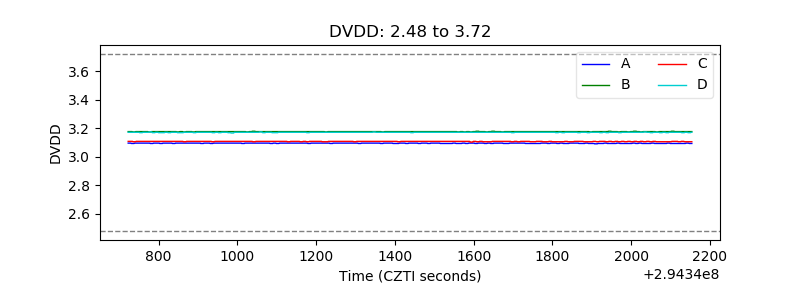 |
| Temperature 1 | 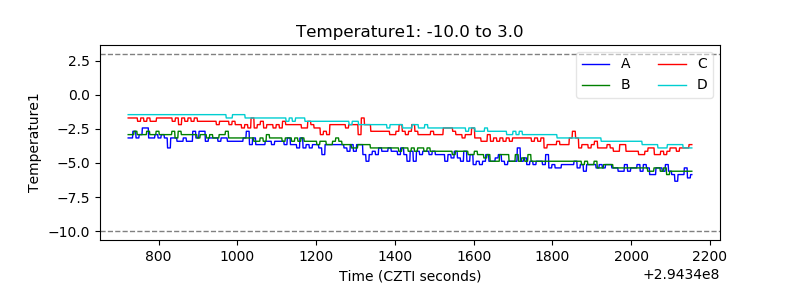 |
| Veto HV Monitor | 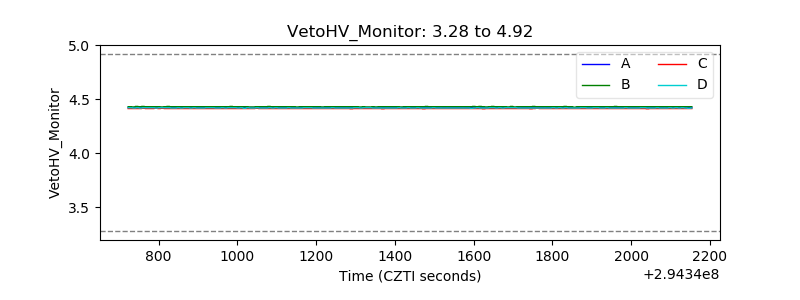 |
| Veto LLD | 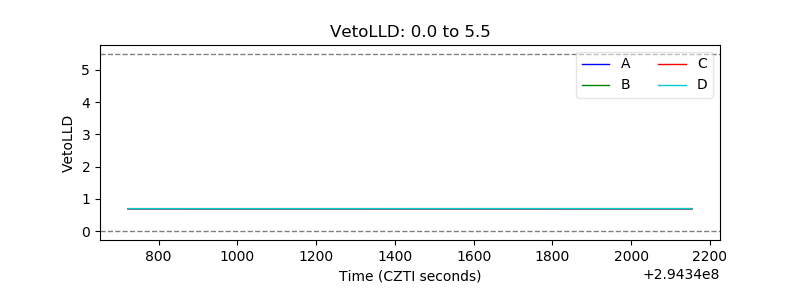 |
| Alpha Counter | 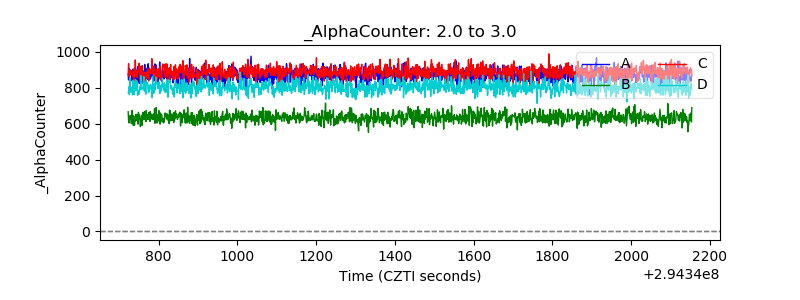 |
| _CPM_Rate | 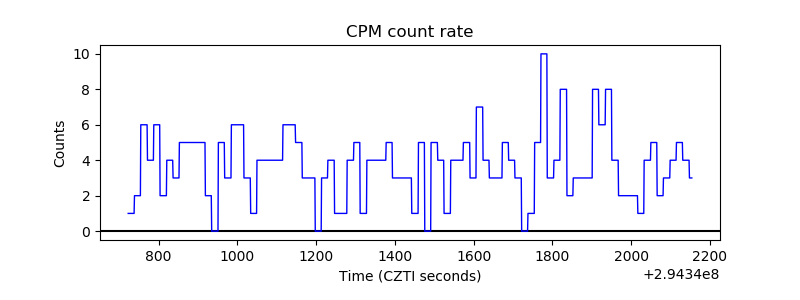 |
| CZT Counter | 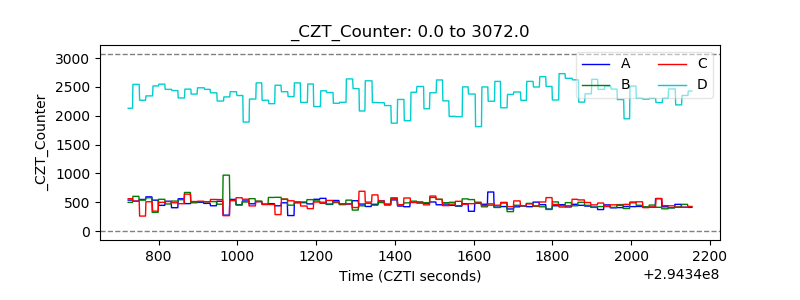 |
| +2.5 Volts monitor |  |
| +5 Volts monitor | 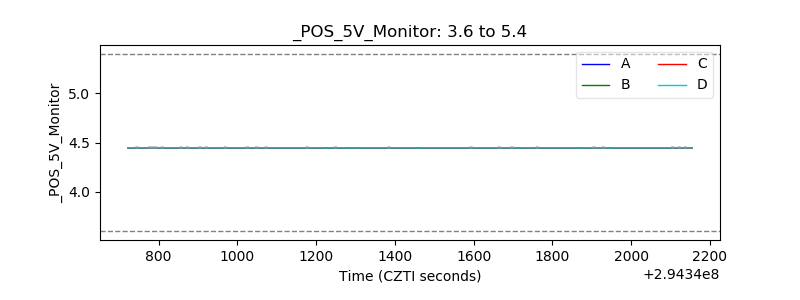 |
| _ROLL_ROT | 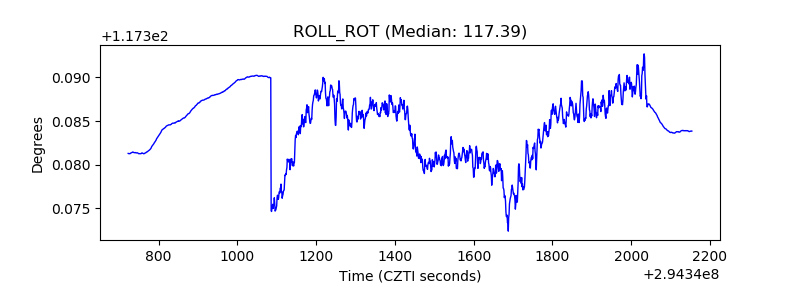 |
| _Roll_DEC | 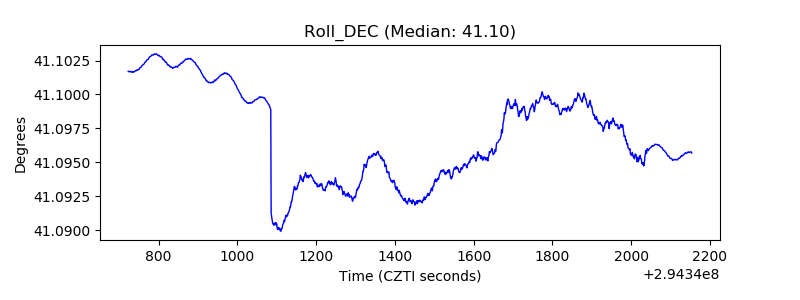 |
| _Roll_RA | 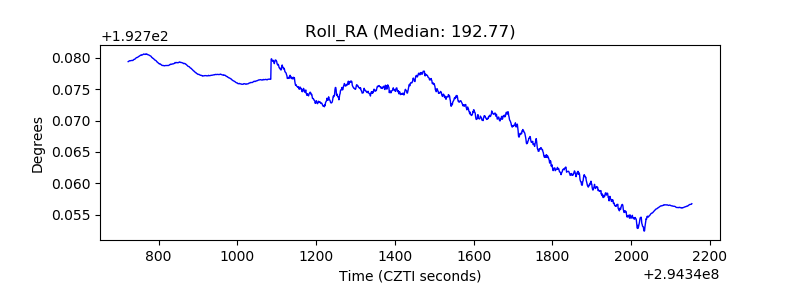 |
| Veto Counter |  |