| Param | Original file | Final file |
|---|---|---|
| Filename | modeM0/AS1A05_227T03_9000002872cztM0_level2.fits | modeM0/AS1A05_227T03_9000002872cztM0_level2_quad_clean.evt |
| Size (bytes) | 40,334,400 | 18,794,880 |
| Size | 38.5 MB | 17.9 MB |
| Events in quadrant A | 266,308 | 84,100 |
| Events in quadrant B | 253,736 | 84,206 |
| Events in quadrant C | 256,194 | 78,711 |
| Events in quadrant D | 125,114 | 2,463 |
| Mode SS | |||
|---|---|---|---|
| Quadrant | BADHDUFLAG | Total packets | Discarded packets |
| A | 0 | 94 | 0 |
| B | 0 | 94 | 0 |
| C | 0 | 94 | 0 |
| D | 0 | 94 | 0 |
| Mode M9 | |||
|---|---|---|---|
| Quadrant | BADHDUFLAG | Total packets | Discarded packets |
| A | 0 | 1 | 0 |
| B | 0 | 1 | 0 |
| C | 0 | 1 | 0 |
| D | 0 | 1 | 0 |
| Mode M0 | |||
|---|---|---|---|
| Quadrant | BADHDUFLAG | Total packets | Discarded packets |
| A | 0 | 9392 | 0 |
| B | 0 | 9776 | 0 |
| C | 0 | 9348 | 0 |
| D | 0 | 34095 | 0 |
| Quadrant | Total seconds | Saturated seconds | Saturation percentage |
|---|---|---|---|
| A | 4523 | 57 | 1.260226% |
| B | 4523 | 110 | 2.432014% |
| C | 4523 | 104 | 2.299359% |
| D | 4523 | 4045 | 89.431793% |
Noise dominated data is calculated using 1-second bins in cleaned event files. If a bin has >2000 counts, and if more than 50% of those come from <1% of pixels, then it is considered to be noise-dominated and hence unusable.
| Quadrant | # 1 sec bins | Bins with >0 counts | Bins with >2000 counts | High rate bins dominated by noise | Noise dominated (total time) | Noise dominated (detector-on time) | Marked lightcurve |
|---|---|---|---|---|---|---|---|
| A | 4633 | 4523 | 0 | 0 | 0.00% | 0.00% |  |
| B | 4633 | 4522 | 0 | 0 | 0.00% | 0.00% |  |
| C | 4633 | 4523 | 0 | 0 | 0.00% | 0.00% |  |
| D | 4633 | 4486 | 0 | 0 | 0.00% | 0.00% | 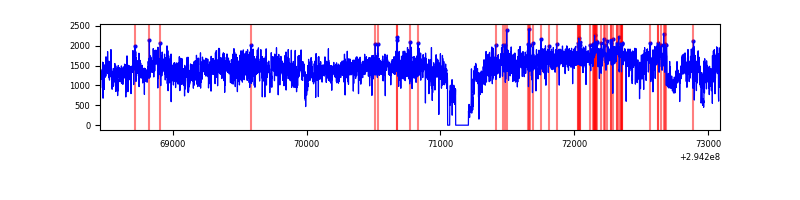 |
Top three noisy pixels from each quadrant. If the there are fewer than three noisy pixels in the level2.evt file, extra rows are filled as -1
| Pixel properties | Quadrant properties | ||||||
|---|---|---|---|---|---|---|---|
| Quadrant | DetID | PixID | Counts | Sigma | Mean | Median | Sigma |
| A | 0 | 29 | 279 | 11.5 | 69 | 65 | 18.6 |
| A | 0 | 30 | 221 | 8.38 | 69 | 65 | 18.6 |
| A | 9 | 19 | 208 | 7.68 | 69 | 65 | 18.6 |
| B | 2 | 9 | 213 | 9.62 | 67 | 64 | 15.5 |
| B | 3 | 17 | 189 | 8.07 | 67 | 64 | 15.5 |
| B | 5 | 128 | 182 | 7.62 | 67 | 64 | 15.5 |
| C | 2 | 191 | 188 | 6.62 | 67 | 63 | 18.9 |
| C | 3 | 158 | 183 | 6.36 | 67 | 63 | 18.9 |
| C | 9 | 233 | 179 | 6.15 | 67 | 63 | 18.9 |
| D | 7 | 5 | 106 | 6.67 | 35 | 32 | 11.1 |
| D | 4 | 246 | 101 | 6.22 | 35 | 32 | 11.1 |
| D | 15 | 46 | 98 | 5.95 | 35 | 32 | 11.1 |
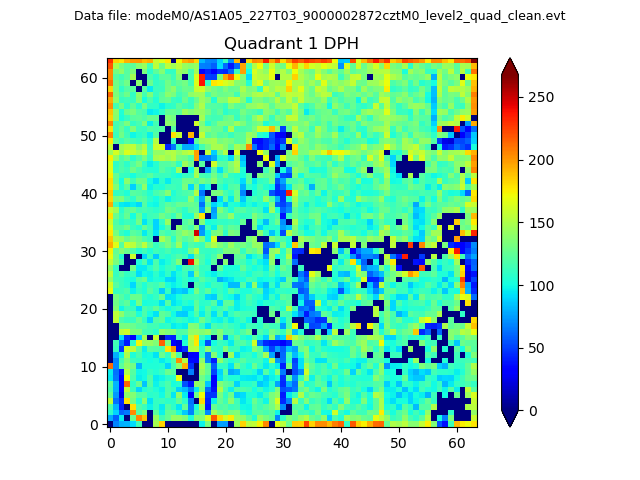
Histogram calculated using DETX and DETY for each event in the final _common_clean file
| Quadrant A |  |
 |
Quadrant B |
|---|---|---|---|
| Quadrant D | 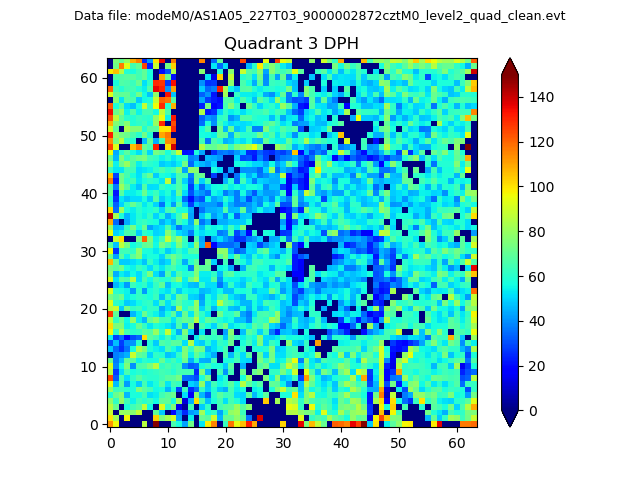 |
 |
Quadrant C |
| Plot type | Count rate plots | Images |
|---|---|---|
| Comparison with Poisson distribution Blue bars denote a histogram of data divided into 1 sec bins. Red curve is a Poisson curve with rate = median count rate of data. |
 |
 |
| Quadrant-wise count rates Data is divided into 100 sec bins |
 |
|
| Module-wise count rates for Quadrant A Data is divided into 100 sec bins |
 |
 |
| Module-wise count rates for Quadrant B Data is divided into 100 sec bins |
 |
 |
| Module-wise count rates for Quadrant C Data is divided into 100 sec bins |
 |
 |
| Module-wise count rates for Quadrant D Data is divided into 100 sec bins |
 |
 |
| Parameter | Plot |
|---|---|
| CZT HV Monitor |  |
| D_VDD |  |
| Temperature 1 |  |
| Veto HV Monitor |  |
| Veto LLD |  |
| Alpha Counter |  |
| _CPM_Rate |  |
| CZT Counter |  |
| +2.5 Volts monitor |  |
| +5 Volts monitor |  |
| _ROLL_ROT | 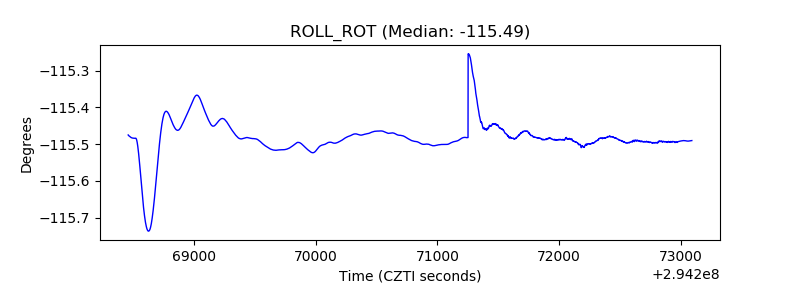 |
| _Roll_DEC |  |
| _Roll_RA |  |
| Veto Counter |  |