| Param | Original file | Final file |
|---|---|---|
| Filename | modeM0/AS1A05_227T03_9000002872_19386cztM0_level2.evt | modeM0/AS1A05_227T03_9000002872_19386cztM0_level2_quad_clean.evt |
| Size (bytes) | 545,999,040 | 56,908,800 |
| Size | 520.7 MB | 54.3 MB |
| Events in quadrant A | 2,075,965 | 411,936 |
| Events in quadrant B | 2,219,889 | 417,762 |
| Events in quadrant C | 2,060,739 | 398,046 |
| Events in quadrant D | 9,888,018 | 192,946 |
| Mode SS | |||
|---|---|---|---|
| Quadrant | BADHDUFLAG | Total packets | Discarded packets |
| A | 0 | 88 | 0 |
| B | 0 | 88 | 0 |
| C | 0 | 88 | 0 |
| D | 0 | 88 | 0 |
| Mode M9 | |||
|---|---|---|---|
| Quadrant | BADHDUFLAG | Total packets | Discarded packets |
| A | 0 | 1 | 0 |
| B | 0 | 1 | 0 |
| C | 0 | 1 | 0 |
| D | 0 | 1 | 0 |
| Mode M0 | |||
|---|---|---|---|
| Quadrant | BADHDUFLAG | Total packets | Discarded packets |
| A | 0 | 8894 | 2 |
| B | 0 | 9278 | 2 |
| C | 0 | 8849 | 3 |
| D | 0 | 32268 | 2 |
| Quadrant | Total seconds | Saturated seconds | Saturation percentage |
|---|---|---|---|
| A | 4273 | 57 | 1.333957% |
| B | 4273 | 110 | 2.574304% |
| C | 4272 | 104 | 2.434457% |
| D | 4272 | 3862 | 90.402622% |
Noise dominated data is calculated using 1-second bins in cleaned event files. If a bin has >2000 counts, and if more than 50% of those come from <1% of pixels, then it is considered to be noise-dominated and hence unusable.
| Quadrant | # 1 sec bins | Bins with >0 counts | Bins with >2000 counts | High rate bins dominated by noise | Noise dominated (total time) | Noise dominated (detector-on time) | Marked lightcurve |
|---|---|---|---|---|---|---|---|
| A | 4383 | 4275 | 0 | 0 | 0.00% | 0.00% | 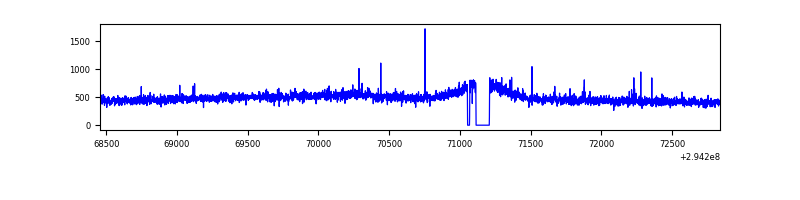 |
| B | 4383 | 4274 | 4 | 4 | 0.09% | 0.09% | 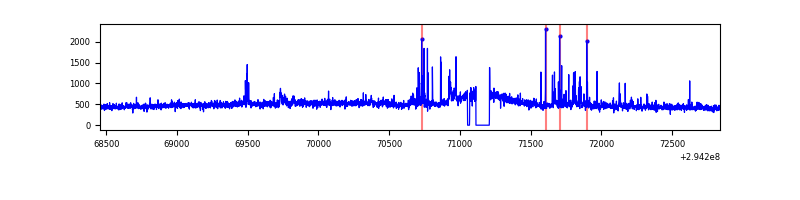 |
| C | 4382 | 4274 | 0 | 0 | 0.00% | 0.00% | 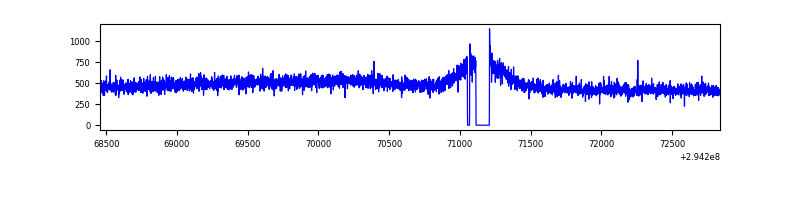 |
| D | 4381 | 4271 | 3515 | 3515 | 80.23% | 82.30% | 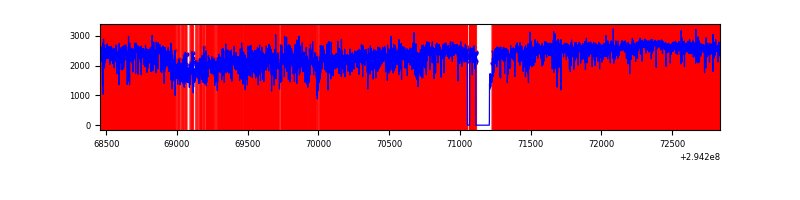 |
Top three noisy pixels from each quadrant. If the there are fewer than three noisy pixels in the level2.evt file, extra rows are filled as -1
| Pixel properties | Quadrant properties | ||||||
|---|---|---|---|---|---|---|---|
| Quadrant | DetID | PixID | Counts | Sigma | Mean | Median | Sigma |
| A | 5 | 16 | 10697 | 92.67 | 534 | 521 | 109.8 |
| A | 13 | 254 | 5253 | 43.09 | 534 | 521 | 109.8 |
| A | 11 | 29 | 4929 | 40.14 | 534 | 521 | 109.8 |
| B | 15 | 32 | 47183 | 452.96 | 532 | 518 | 103.0 |
| B | 7 | 220 | 22958 | 217.82 | 532 | 518 | 103.0 |
| B | 4 | 216 | 17256 | 162.47 | 532 | 518 | 103.0 |
| C | 14 | 238 | 78136 | 651.64 | 506 | 509 | 119.1 |
| C | 3 | 233 | 7294 | 56.96 | 506 | 509 | 119.1 |
| C | 13 | 61 | 3595 | 25.91 | 506 | 509 | 119.1 |
| D | 10 | 66 | 6521099 | 81240.66 | 320 | 309 | 80.3 |
| D | 7 | 238 | 1915792 | 23864.45 | 320 | 309 | 80.3 |
| D | 1 | 52 | 162545 | 2021.25 | 320 | 309 | 80.3 |
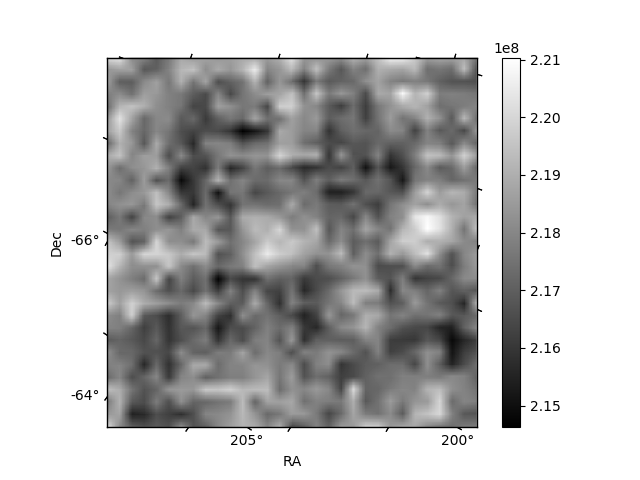
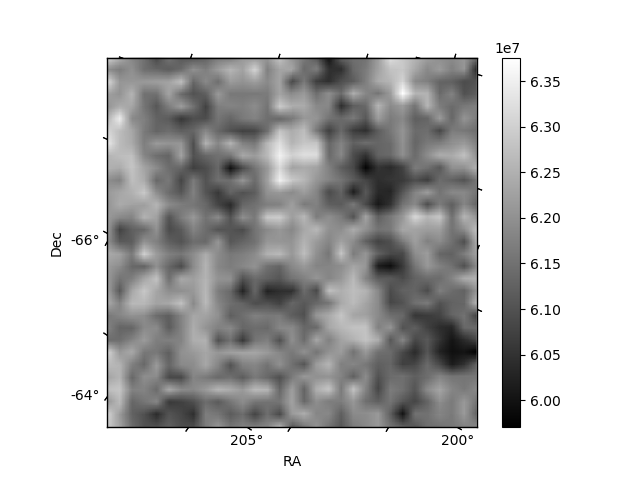
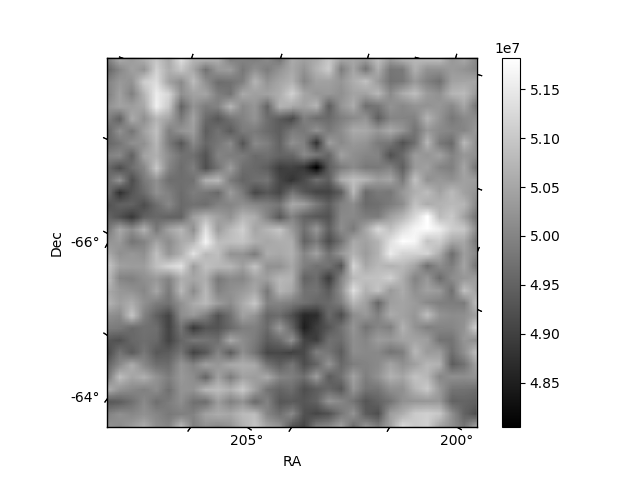
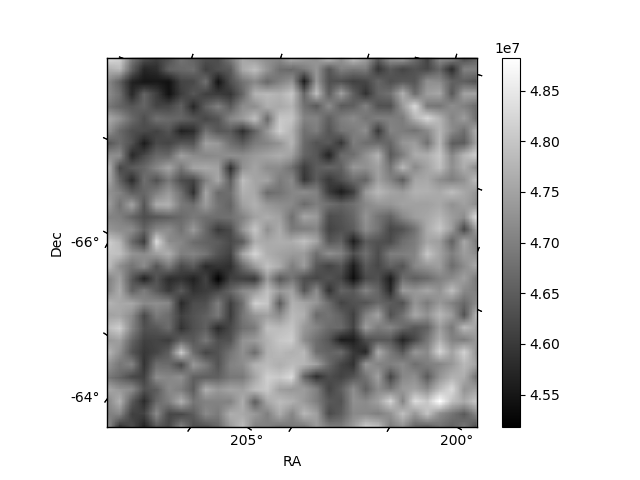
Histogram calculated using DETX and DETY for each event in the final _common_clean file
| Quadrant A | 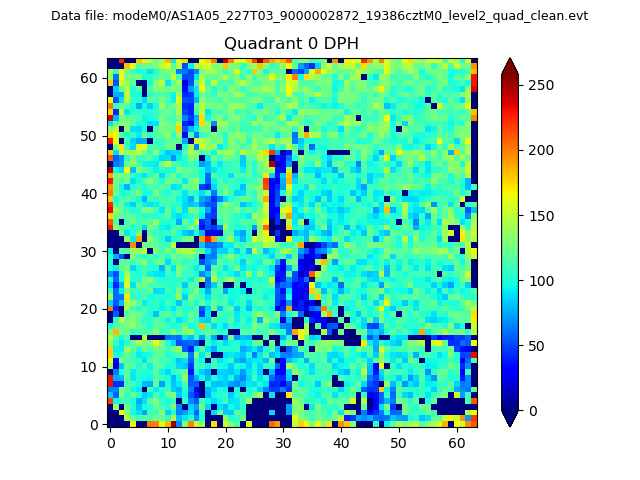 |
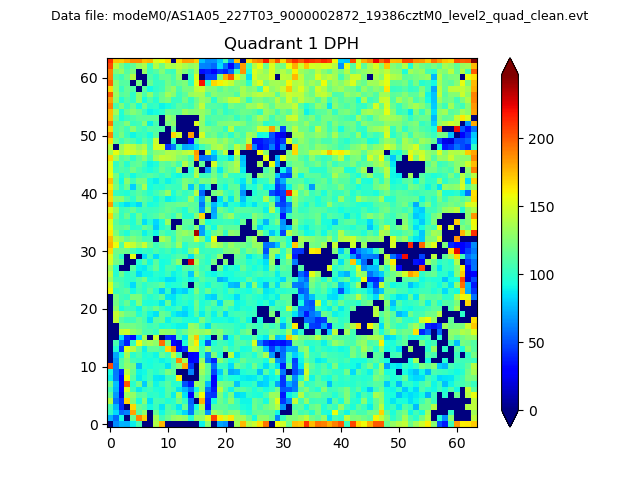 |
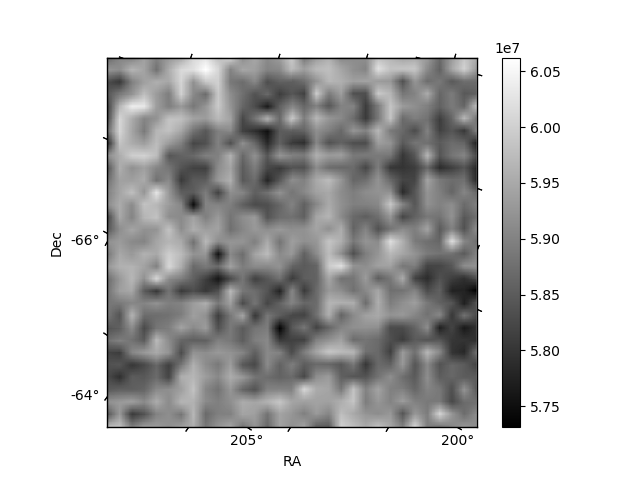
Quadrant B |
|---|---|---|---|
| Quadrant D | 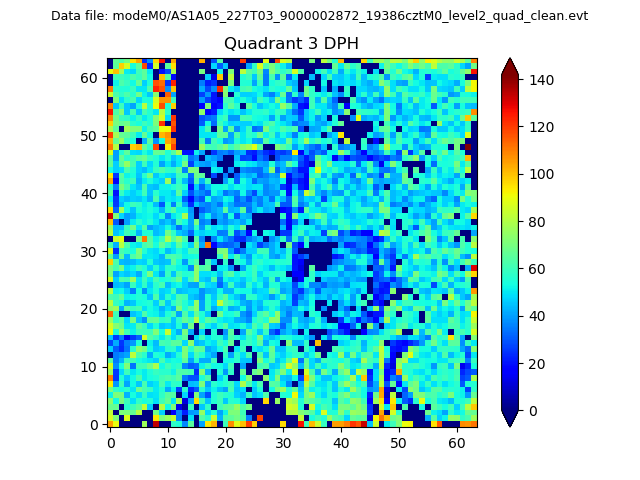 |
 |
Quadrant C |
| Plot type | Count rate plots | Images |
|---|---|---|
| Comparison with Poisson distribution Blue bars denote a histogram of data divided into 1 sec bins. Red curve is a Poisson curve with rate = median count rate of data. |
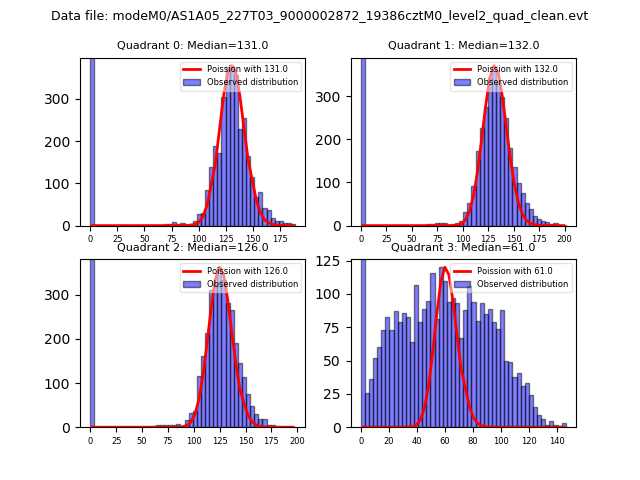 |
 |
| Quadrant-wise count rates Data is divided into 100 sec bins |
 |
|
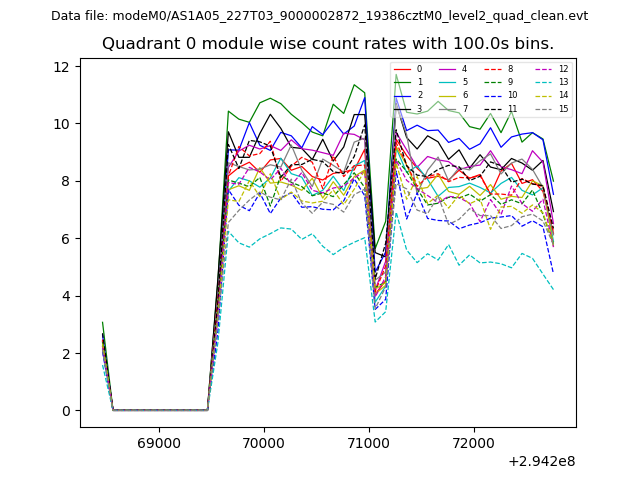
| Module-wise count rates for Quadrant A Data is divided into 100 sec bins |
 |
 |
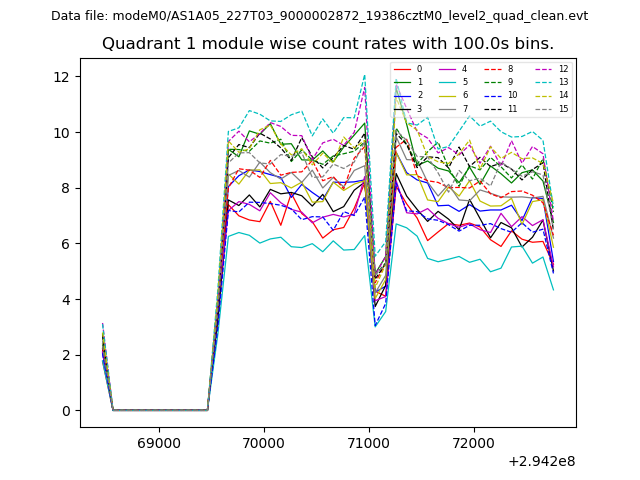
| Module-wise count rates for Quadrant B Data is divided into 100 sec bins |
 |
 |
| Module-wise count rates for Quadrant C Data is divided into 100 sec bins |
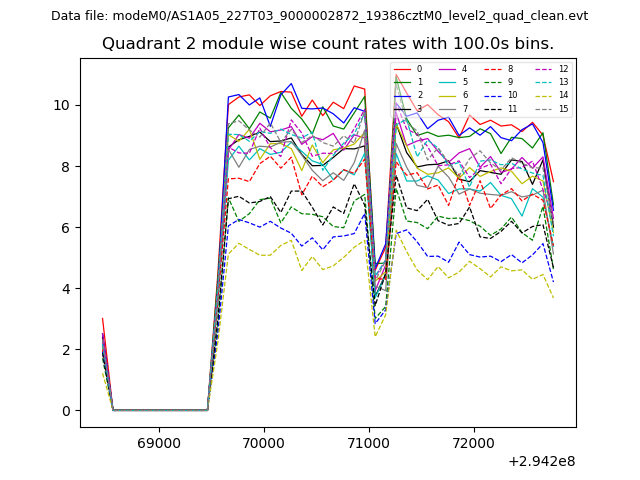 |
 |
| Module-wise count rates for Quadrant D Data is divided into 100 sec bins |
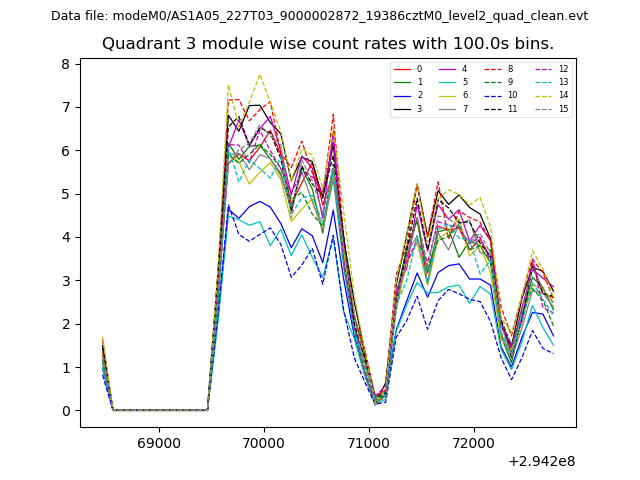 |
 |
| Parameter | Plot |
|---|---|
| CZT HV Monitor | 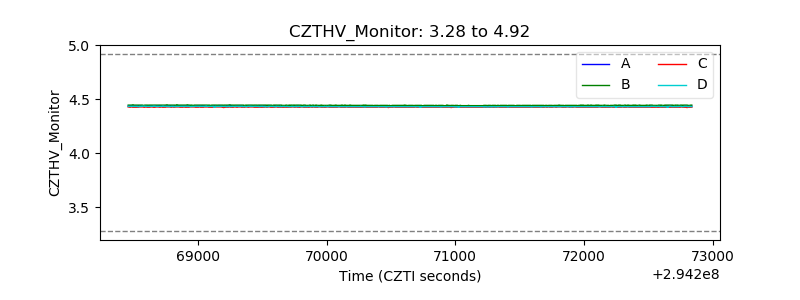 |
| D_VDD | 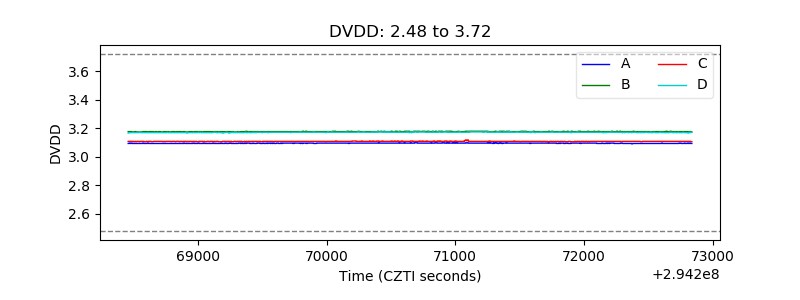 |
| Temperature 1 | 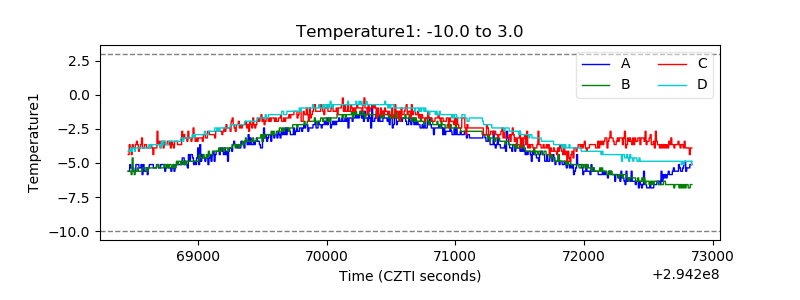 |
| Veto HV Monitor | 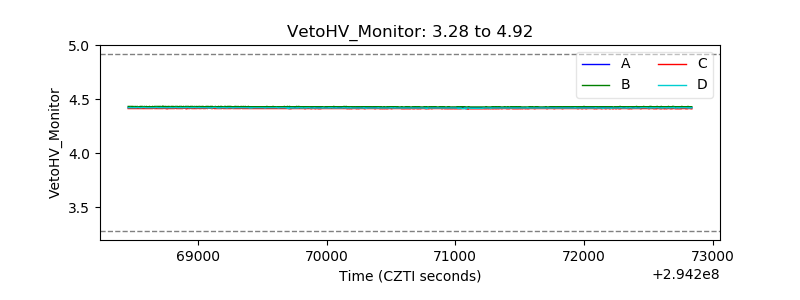 |
| Veto LLD | 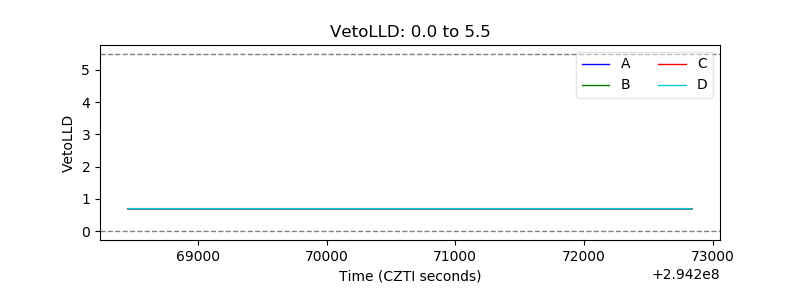 |
| Alpha Counter | 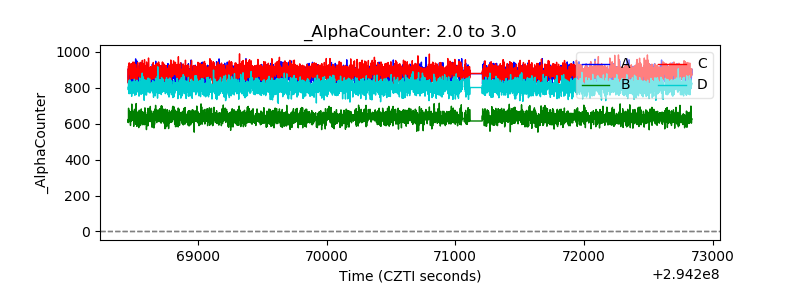 |
| _CPM_Rate |  |
| CZT Counter |  |
| +2.5 Volts monitor |  |
| +5 Volts monitor |  |
| _ROLL_ROT | 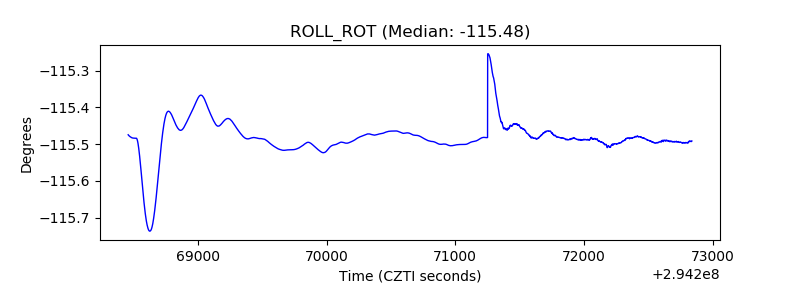 |
| _Roll_DEC | 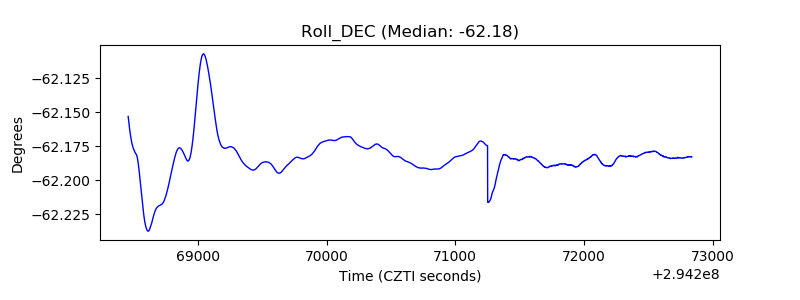 |
| _Roll_RA |  |
| Veto Counter | 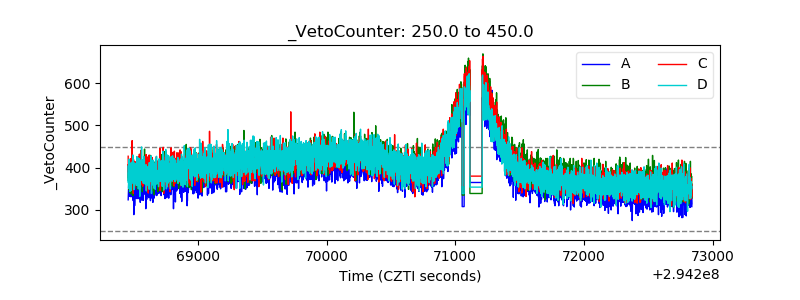 |