| Param | Original file | Final file |
|---|---|---|
| Filename | modeM0/AS1A05_227T03_9000002872_19387cztM0_level2.evt | modeM0/AS1A05_227T03_9000002872_19387cztM0_level2_quad_clean.evt |
| Size (bytes) | 233,038,080 | 29,813,760 |
| Size | 222.2 MB | 28.4 MB |
| Events in quadrant A | 795,155 | 226,879 |
| Events in quadrant B | 871,284 | 229,048 |
| Events in quadrant C | 777,362 | 215,403 |
| Events in quadrant D | 4,488,873 | 98,467 |
| Mode SS | |||
|---|---|---|---|
| Quadrant | BADHDUFLAG | Total packets | Discarded packets |
| A | 0 | 36 | 0 |
| B | 0 | 36 | 0 |
| C | 0 | 36 | 0 |
| D | 0 | 36 | 0 |
| Mode M0 | |||
|---|---|---|---|
| Quadrant | BADHDUFLAG | Total packets | Discarded packets |
| A | 0 | 3669 | 0 |
| B | 0 | 3831 | 0 |
| C | 0 | 3649 | 0 |
| D | 0 | 14541 | 0 |
| Quadrant | Total seconds | Saturated seconds | Saturation percentage |
|---|---|---|---|
| A | 1799 | 6 | 0.333519% |
| B | 1800 | 16 | 0.888889% |
| C | 1800 | 8 | 0.444444% |
| D | 1800 | 1713 | 95.166667% |
Noise dominated data is calculated using 1-second bins in cleaned event files. If a bin has >2000 counts, and if more than 50% of those come from <1% of pixels, then it is considered to be noise-dominated and hence unusable.
| Quadrant | # 1 sec bins | Bins with >0 counts | Bins with >2000 counts | High rate bins dominated by noise | Noise dominated (total time) | Noise dominated (detector-on time) | Marked lightcurve |
|---|---|---|---|---|---|---|---|
| A | 1799 | 1799 | 0 | 0 | 0.00% | 0.00% | 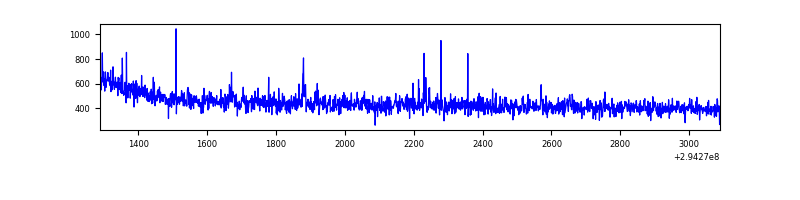 |
| B | 1800 | 1800 | 3 | 3 | 0.17% | 0.17% | 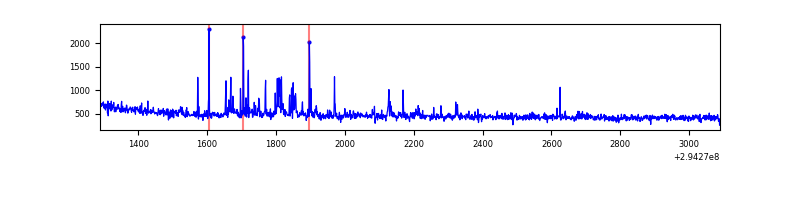 |
| C | 1800 | 1800 | 0 | 0 | 0.00% | 0.00% | 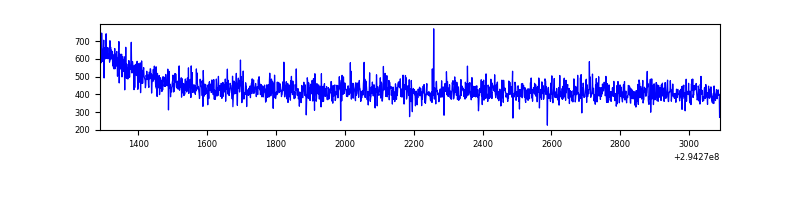 |
| D | 1800 | 1800 | 1691 | 1691 | 93.94% | 93.94% | 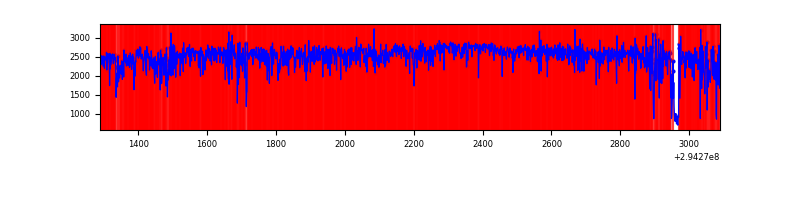 |
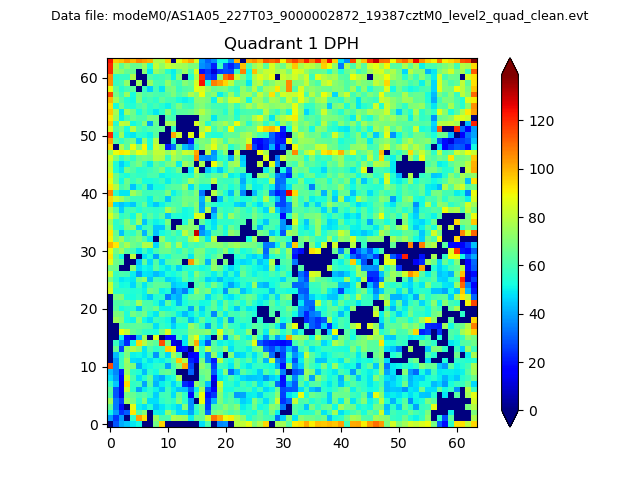
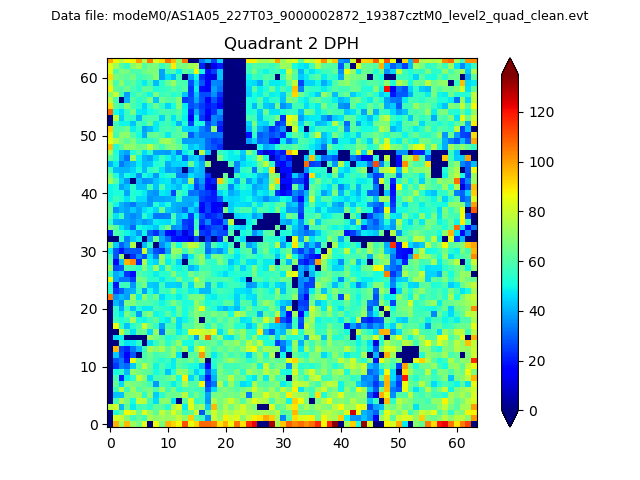
Top three noisy pixels from each quadrant. If the there are fewer than three noisy pixels in the level2.evt file, extra rows are filled as -1
| Pixel properties | Quadrant properties | ||||||
|---|---|---|---|---|---|---|---|
| Quadrant | DetID | PixID | Counts | Sigma | Mean | Median | Sigma |
| A | 5 | 16 | 5156 | 112.22 | 204 | 200 | 44.2 |
| A | 13 | 254 | 2648 | 55.43 | 204 | 200 | 44.2 |
| A | 0 | 226 | 1758 | 35.28 | 204 | 200 | 44.2 |
| B | 7 | 220 | 22313 | 533.73 | 206 | 201 | 41.4 |
| B | 15 | 32 | 10117 | 239.35 | 206 | 201 | 41.4 |
| B | 0 | 197 | 7796 | 183.33 | 206 | 201 | 41.4 |
| C | 14 | 238 | 29785 | 637.21 | 191 | 192 | 46.4 |
| C | 13 | 61 | 1405 | 26.12 | 191 | 192 | 46.4 |
| C | 3 | 233 | 1165 | 20.95 | 191 | 192 | 46.4 |
| D | 10 | 66 | 2727738 | 100934.41 | 102 | 98 | 27.0 |
| D | 7 | 238 | 1293187 | 47849.85 | 102 | 98 | 27.0 |
| D | 12 | 218 | 33826 | 1248.08 | 102 | 98 | 27.0 |
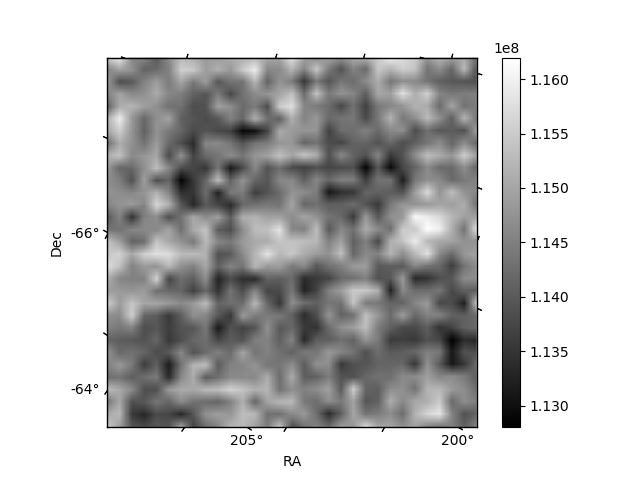
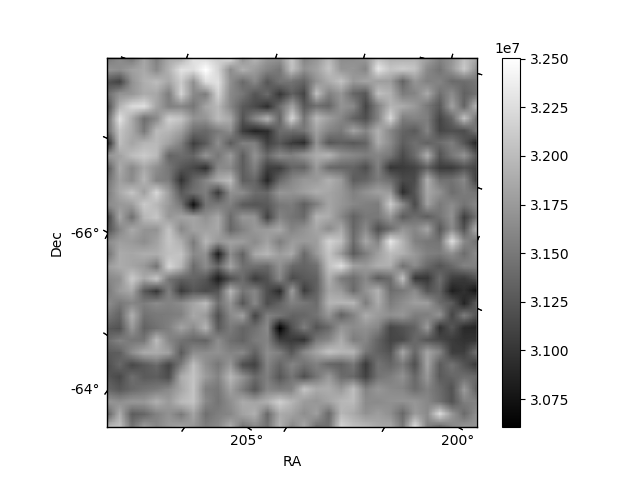
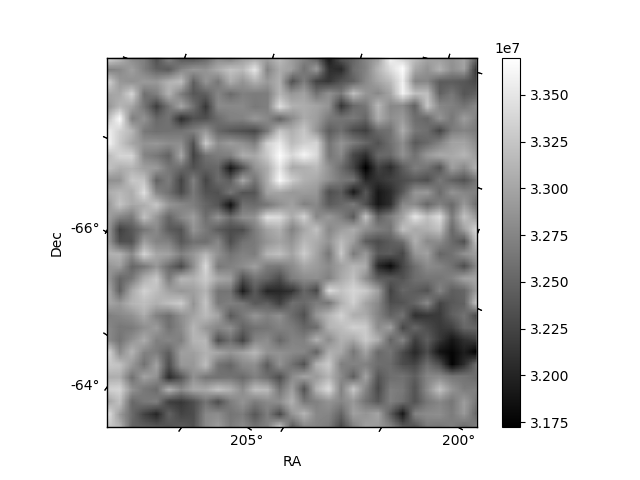
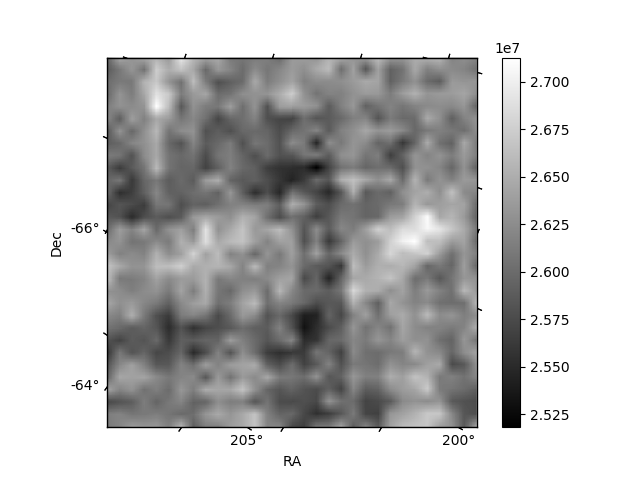
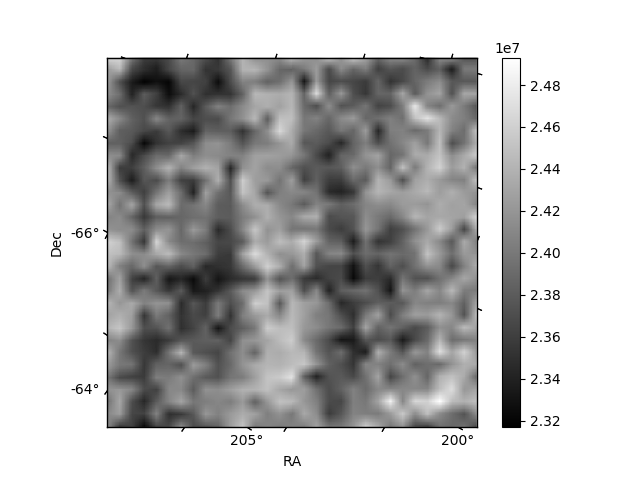
Histogram calculated using DETX and DETY for each event in the final _common_clean file
| Quadrant A | 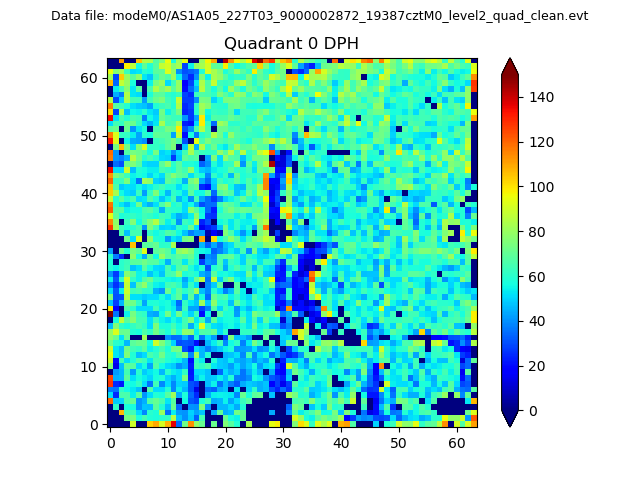 |
 |
Quadrant B |
|---|---|---|---|
| Quadrant D | 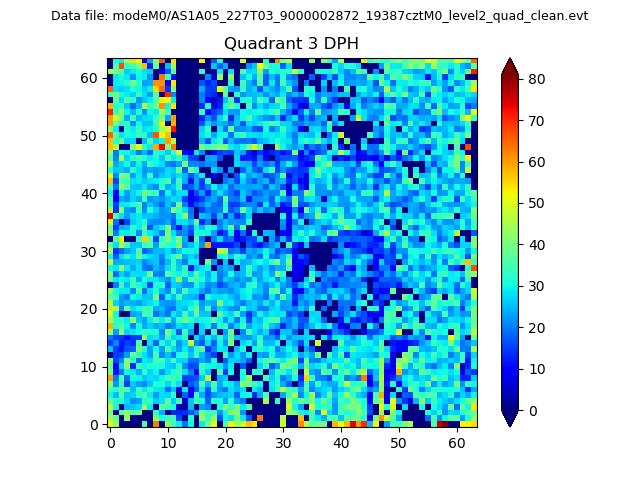 |
 |
Quadrant C |
| Plot type | Count rate plots | Images |
|---|---|---|
| Comparison with Poisson distribution Blue bars denote a histogram of data divided into 1 sec bins. Red curve is a Poisson curve with rate = median count rate of data. |
 |
 |
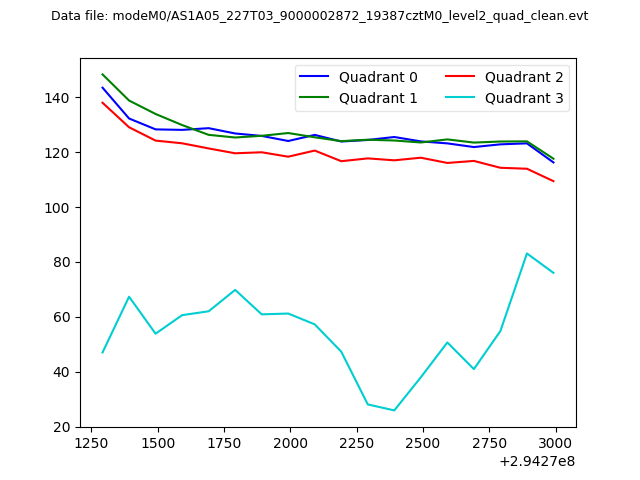
| Quadrant-wise count rates Data is divided into 100 sec bins |
 |
|
| Module-wise count rates for Quadrant A Data is divided into 100 sec bins |
 |
 |
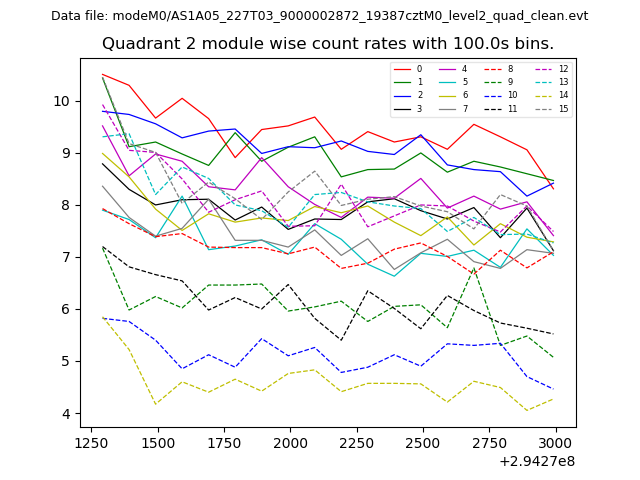
| Module-wise count rates for Quadrant B Data is divided into 100 sec bins |
 |
 |
| Module-wise count rates for Quadrant C Data is divided into 100 sec bins |
 |
 |
| Module-wise count rates for Quadrant D Data is divided into 100 sec bins |
 |
 |
| Parameter | Plot |
|---|---|
| CZT HV Monitor | 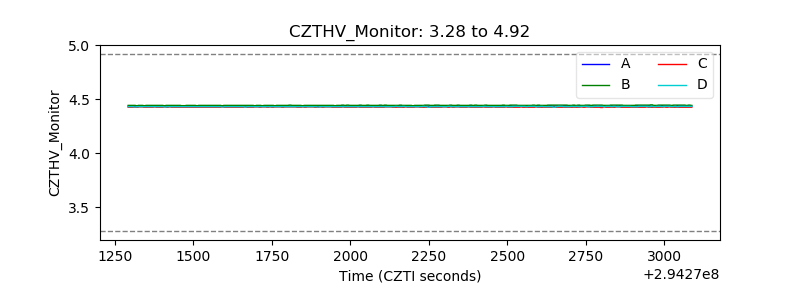 |
| D_VDD | 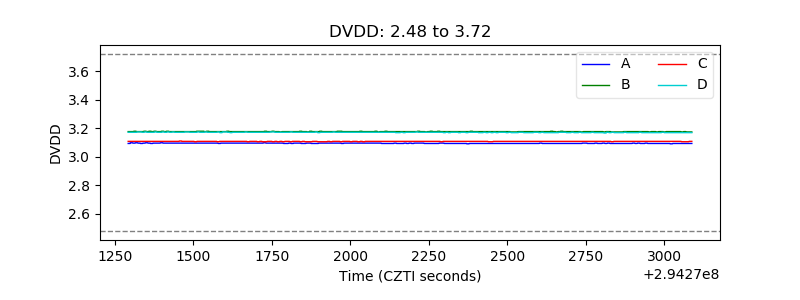 |
| Temperature 1 | 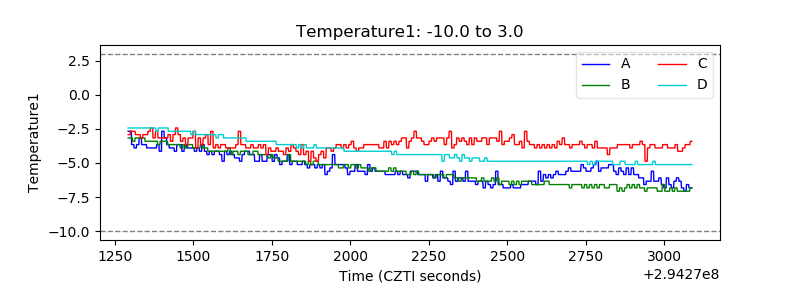 |
| Veto HV Monitor | 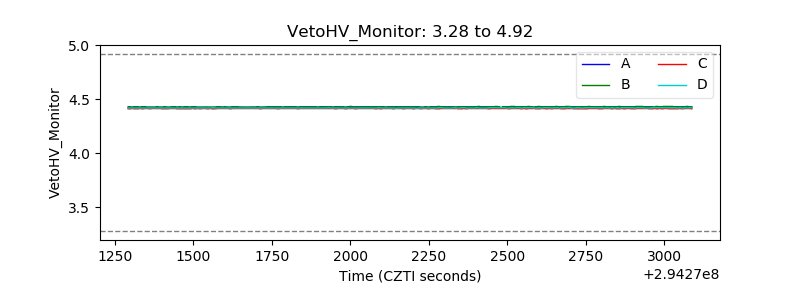 |
| Veto LLD | 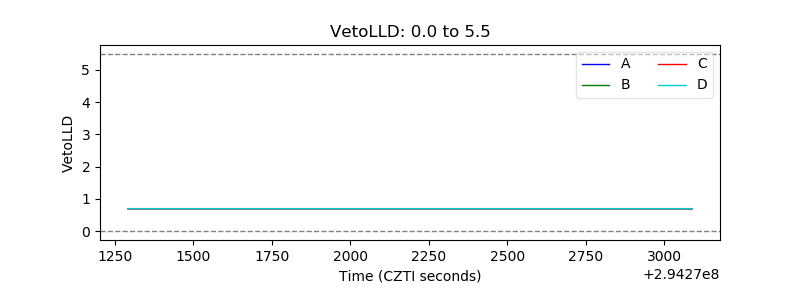 |
| Alpha Counter | 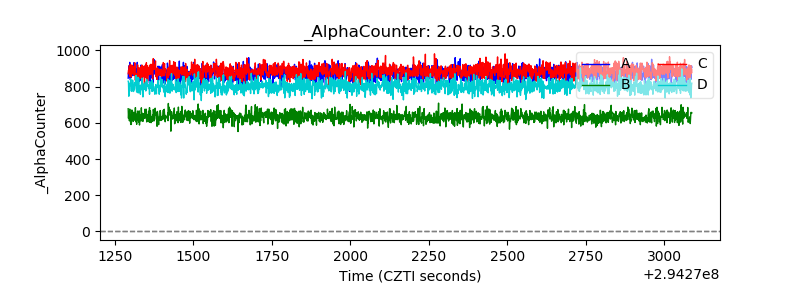 |
| _CPM_Rate | 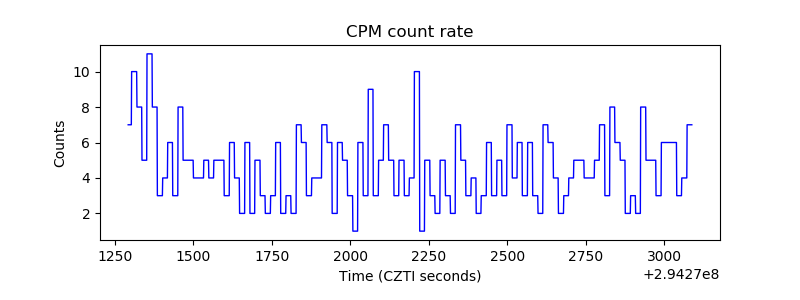 |
| CZT Counter | 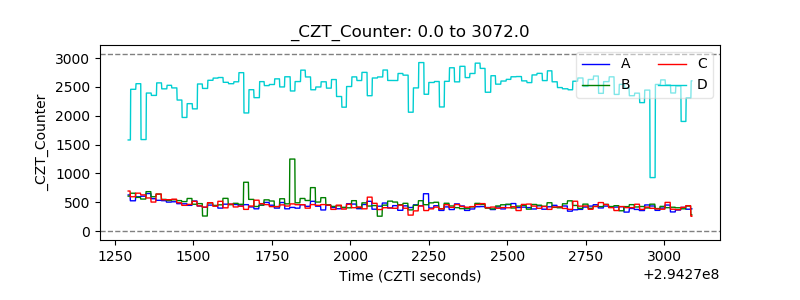 |
| +2.5 Volts monitor |  |
| +5 Volts monitor |  |
| _ROLL_ROT | 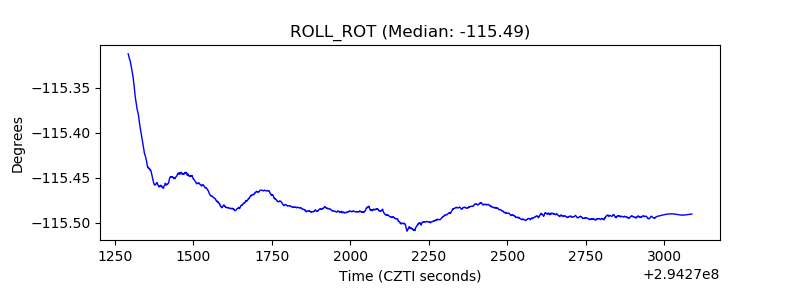 |
| _Roll_DEC |  |
| _Roll_RA | 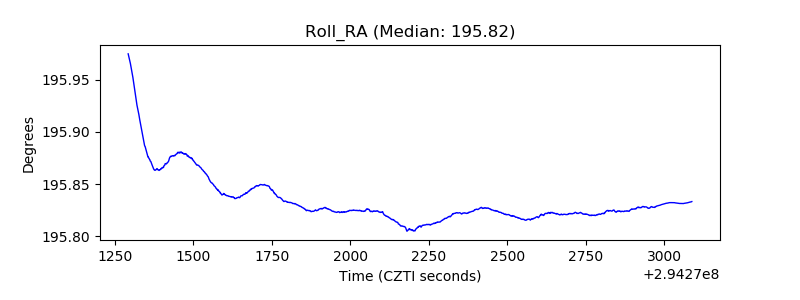 |
| Veto Counter |  |