| Param | Original file | Final file |
|---|---|---|
| Filename | modeM0/AS1C04_009T04_9000002866cztM0_level2.fits | modeM0/AS1C04_009T04_9000002866cztM0_level2_quad_clean.evt |
| Size (bytes) | 85,101,120 | 35,778,240 |
| Size | 81.2 MB | 34.1 MB |
| Events in quadrant A | 567,330 | 146,913 |
| Events in quadrant B | 530,242 | 145,032 |
| Events in quadrant C | 535,890 | 134,213 |
| Events in quadrant D | 342,672 | 56,831 |
| Mode SS | |||
|---|---|---|---|
| Quadrant | BADHDUFLAG | Total packets | Discarded packets |
| A | 0 | 176 | 0 |
| B | 0 | 176 | 0 |
| C | 0 | 176 | 0 |
| D | 0 | 176 | 0 |
| Mode M0 | |||
|---|---|---|---|
| Quadrant | BADHDUFLAG | Total packets | Discarded packets |
| A | 0 | 18034 | 0 |
| B | 0 | 18433 | 0 |
| C | 0 | 17773 | 0 |
| D | 0 | 57993 | 0 |
| Mode M9 | |||
|---|---|---|---|
| Quadrant | BADHDUFLAG | Total packets | Discarded packets |
| A | 0 | 23 | 0 |
| B | 0 | 23 | 0 |
| C | 0 | 23 | 0 |
| D | 0 | 23 | 0 |
| Quadrant | Total seconds | Saturated seconds | Saturation percentage |
|---|---|---|---|
| A | 8630 | 61 | 0.706837% |
| B | 8630 | 84 | 0.973349% |
| C | 8630 | 64 | 0.741599% |
| D | 8630 | 5511 | 63.858633% |
Noise dominated data is calculated using 1-second bins in cleaned event files. If a bin has >2000 counts, and if more than 50% of those come from <1% of pixels, then it is considered to be noise-dominated and hence unusable.
| Quadrant | # 1 sec bins | Bins with >0 counts | Bins with >2000 counts | High rate bins dominated by noise | Noise dominated (total time) | Noise dominated (detector-on time) | Marked lightcurve |
|---|---|---|---|---|---|---|---|
| A | 10930 | 8628 | 0 | 0 | 0.00% | 0.00% |  |
| B | 10930 | 8627 | 0 | 0 | 0.00% | 0.00% |  |
| C | 10930 | 8629 | 0 | 0 | 0.00% | 0.00% |  |
| D | 10929 | 8608 | 0 | 0 | 0.00% | 0.00% |  |
Top three noisy pixels from each quadrant. If the there are fewer than three noisy pixels in the level2.evt file, extra rows are filled as -1
| Pixel properties | Quadrant properties | ||||||
|---|---|---|---|---|---|---|---|
| Quadrant | DetID | PixID | Counts | Sigma | Mean | Median | Sigma |
| A | 0 | 29 | 490 | 9.45 | 147 | 140 | 37.0 |
| A | 7 | 110 | 437 | 8.02 | 147 | 140 | 37.0 |
| A | 9 | 19 | 430 | 7.83 | 147 | 140 | 37.0 |
| B | 2 | 9 | 413 | 9.38 | 140 | 135 | 29.6 |
| B | 5 | 128 | 371 | 7.97 | 140 | 135 | 29.6 |
| B | 12 | 226 | 353 | 7.36 | 140 | 135 | 29.6 |
| C | 1 | 81 | 442 | 8.06 | 141 | 133 | 38.4 |
| C | 1 | 80 | 432 | 7.79 | 141 | 133 | 38.4 |
| C | 12 | 241 | 385 | 6.57 | 141 | 133 | 38.4 |
| D | 6 | 67 | 262 | 6.35 | 98 | 90 | 27.1 |
| D | 7 | 3 | 254 | 6.06 | 98 | 90 | 27.1 |
| D | 6 | 38 | 250 | 5.91 | 98 | 90 | 27.1 |
Histogram calculated using DETX and DETY for each event in the final _common_clean file
| Quadrant A | 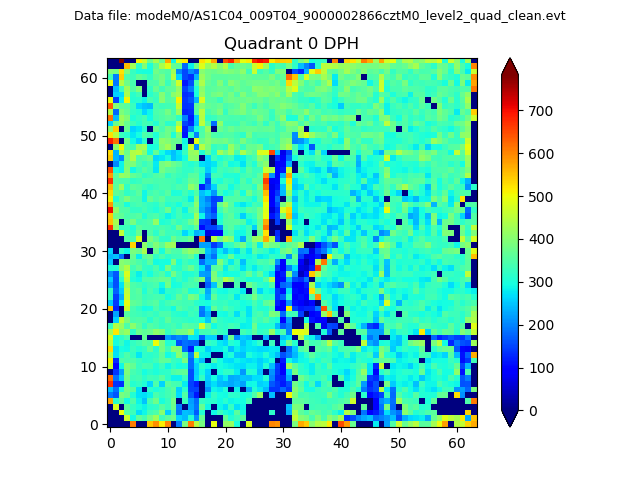 |
 |
Quadrant B |
|---|---|---|---|
| Quadrant D | 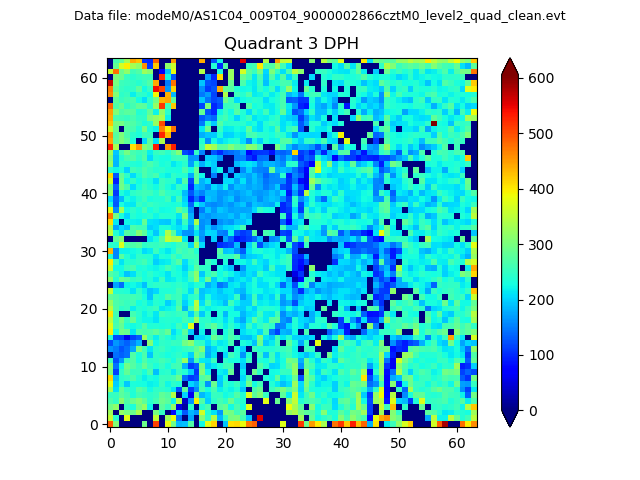 |
 |
Quadrant C |
| Plot type | Count rate plots | Images |
|---|---|---|
| Comparison with Poisson distribution Blue bars denote a histogram of data divided into 1 sec bins. Red curve is a Poisson curve with rate = median count rate of data. |
 |
 |
| Quadrant-wise count rates Data is divided into 100 sec bins |
 |
|
| Module-wise count rates for Quadrant A Data is divided into 100 sec bins |
 |
 |
| Module-wise count rates for Quadrant B Data is divided into 100 sec bins |
 |
 |
| Module-wise count rates for Quadrant C Data is divided into 100 sec bins |
 |
 |
| Module-wise count rates for Quadrant D Data is divided into 100 sec bins |
 |
 |
| Parameter | Plot |
|---|---|
| CZT HV Monitor |  |
| D_VDD | 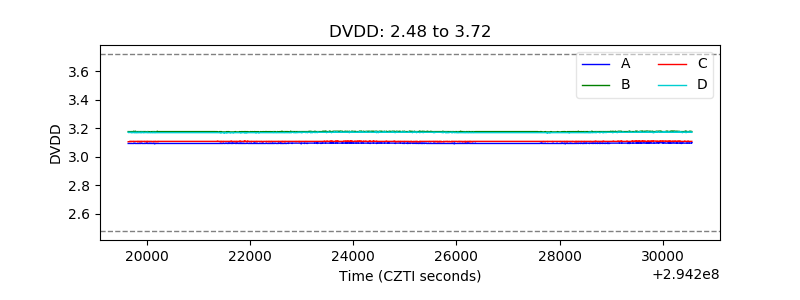 |
| Temperature 1 |  |
| Veto HV Monitor |  |
| Veto LLD |  |
| Alpha Counter |  |
| _CPM_Rate |  |
| CZT Counter |  |
| +2.5 Volts monitor |  |
| +5 Volts monitor |  |
| _ROLL_ROT |  |
| _Roll_DEC |  |
| _Roll_RA |  |
| Veto Counter |  |