| Param | Original file | Final file |
|---|---|---|
| Filename | modeM0/AS1C04_009T04_9000002866_19378cztM0_level2.evt | modeM0/AS1C04_009T04_9000002866_19378cztM0_level2_quad_clean.evt |
| Size (bytes) | 217,195,200 | 39,219,840 |
| Size | 207.1 MB | 37.4 MB |
| Events in quadrant A | 986,896 | 279,901 |
| Events in quadrant B | 995,688 | 283,163 |
| Events in quadrant C | 970,229 | 269,806 |
| Events in quadrant D | 3,492,953 | 214,692 |
| Mode SS | |||
|---|---|---|---|
| Quadrant | BADHDUFLAG | Total packets | Discarded packets |
| A | 0 | 40 | 0 |
| B | 0 | 40 | 0 |
| C | 0 | 40 | 0 |
| D | 0 | 40 | 0 |
| Mode M0 | |||
|---|---|---|---|
| Quadrant | BADHDUFLAG | Total packets | Discarded packets |
| A | 0 | 4081 | 1 |
| B | 0 | 4079 | 1 |
| C | 0 | 3987 | 1 |
| D | 0 | 11704 | 1 |
| Mode M9 | |||
|---|---|---|---|
| Quadrant | BADHDUFLAG | Total packets | Discarded packets |
| A | 0 | 11 | 0 |
| B | 0 | 11 | 0 |
| C | 0 | 11 | 0 |
| D | 0 | 11 | 0 |
| Quadrant | Total seconds | Saturated seconds | Saturation percentage |
|---|---|---|---|
| A | 1913 | 24 | 1.254574% |
| B | 1913 | 26 | 1.359122% |
| C | 1913 | 21 | 1.097752% |
| D | 1913 | 891 | 46.576059% |
Noise dominated data is calculated using 1-second bins in cleaned event files. If a bin has >2000 counts, and if more than 50% of those come from <1% of pixels, then it is considered to be noise-dominated and hence unusable.
| Quadrant | # 1 sec bins | Bins with >0 counts | Bins with >2000 counts | High rate bins dominated by noise | Noise dominated (total time) | Noise dominated (detector-on time) | Marked lightcurve |
|---|---|---|---|---|---|---|---|
| A | 3013 | 1914 | 0 | 0 | 0.00% | 0.00% | 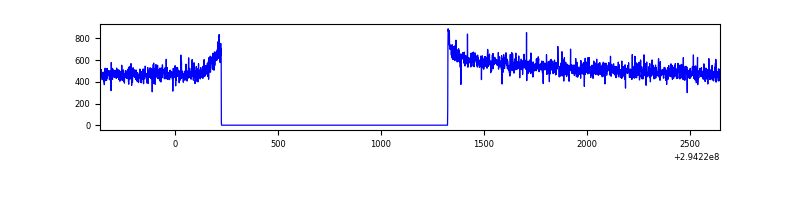 |
| B | 3013 | 1913 | 0 | 0 | 0.00% | 0.00% | 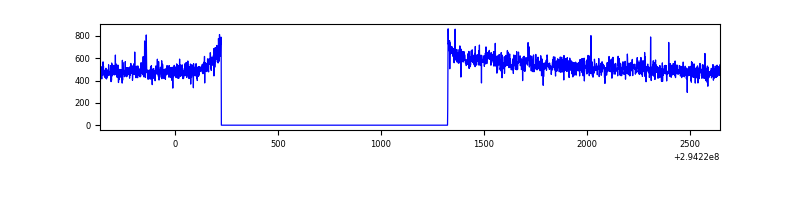 |
| C | 3013 | 1913 | 0 | 0 | 0.00% | 0.00% | 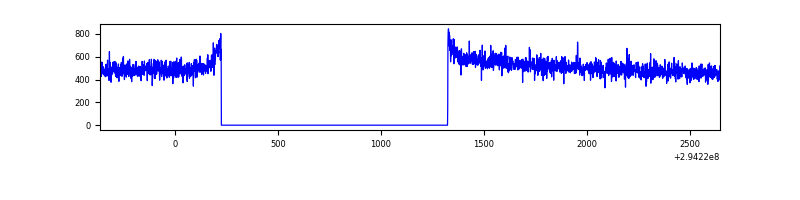 |
| D | 3012 | 1912 | 802 | 802 | 26.63% | 41.95% | 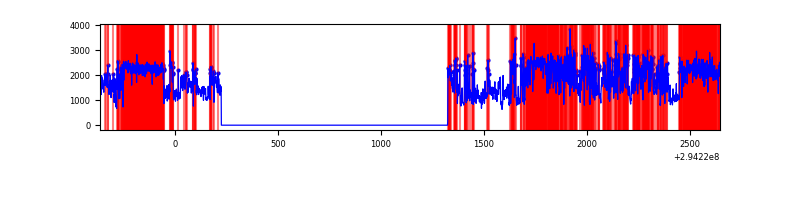 |
Top three noisy pixels from each quadrant. If the there are fewer than three noisy pixels in the level2.evt file, extra rows are filled as -1
| Pixel properties | Quadrant properties | ||||||
|---|---|---|---|---|---|---|---|
| Quadrant | DetID | PixID | Counts | Sigma | Mean | Median | Sigma |
| A | 13 | 254 | 2387 | 40.23 | 255 | 250 | 53.1 |
| A | 0 | 226 | 2232 | 37.31 | 255 | 250 | 53.1 |
| A | 3 | 137 | 2035 | 33.6 | 255 | 250 | 53.1 |
| B | 0 | 198 | 8034 | 158.69 | 251 | 244 | 49.1 |
| B | 12 | 111 | 5892 | 115.06 | 251 | 244 | 49.1 |
| B | 11 | 111 | 5026 | 97.42 | 251 | 244 | 49.1 |
| C | 14 | 238 | 38491 | 677.34 | 238 | 239 | 56.5 |
| C | 3 | 233 | 1797 | 27.59 | 238 | 239 | 56.5 |
| C | 13 | 61 | 1623 | 24.51 | 238 | 239 | 56.5 |
| D | 10 | 66 | 1696262 | 32894.43 | 206 | 200 | 51.6 |
| D | 7 | 238 | 772474 | 14977.94 | 206 | 200 | 51.6 |
| D | 1 | 52 | 160978 | 3118.22 | 206 | 200 | 51.6 |
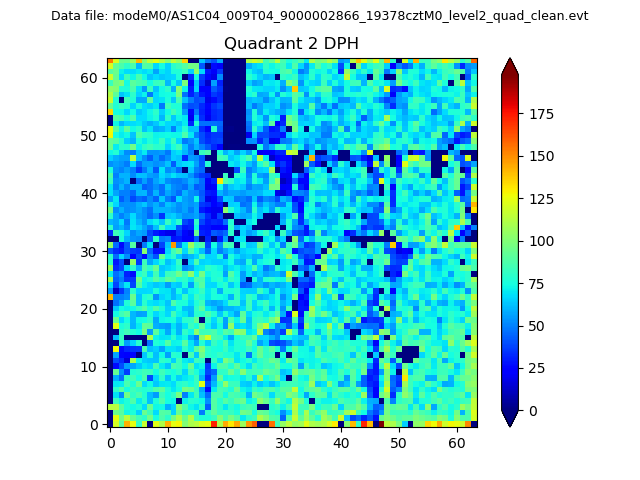
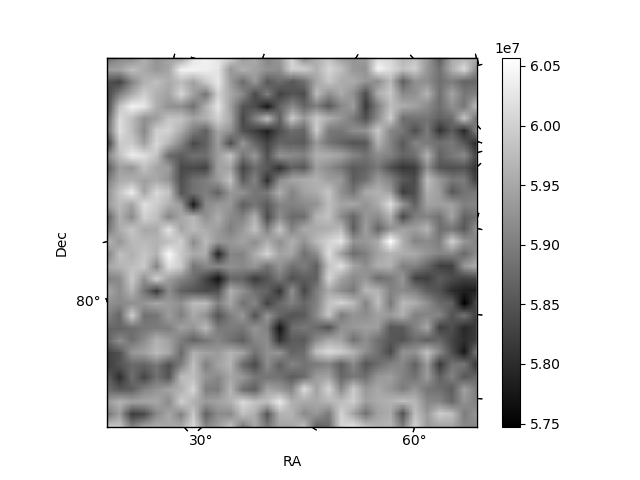
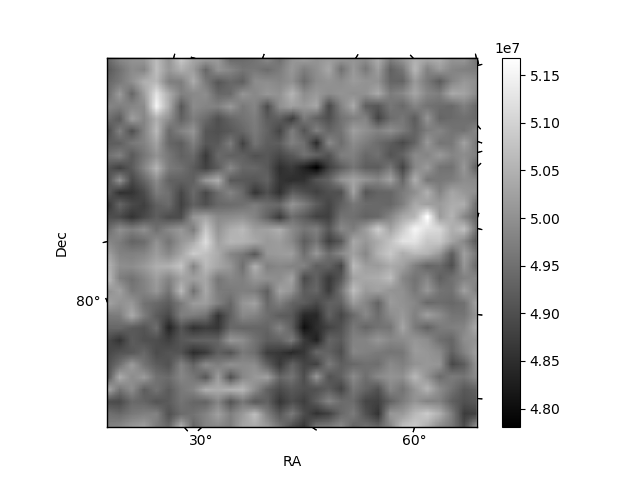
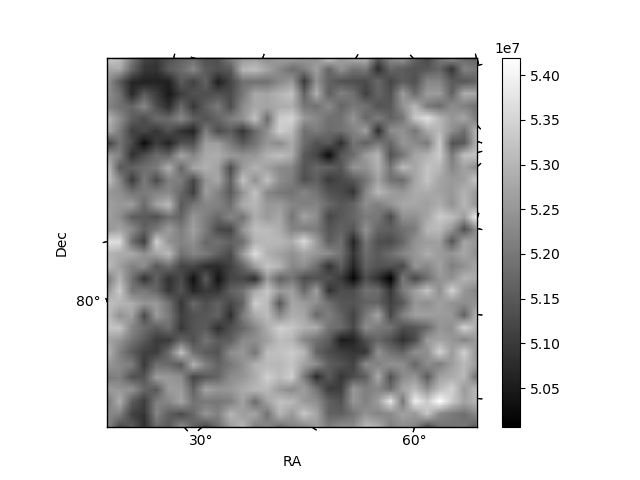
Histogram calculated using DETX and DETY for each event in the final _common_clean file
| Quadrant A | 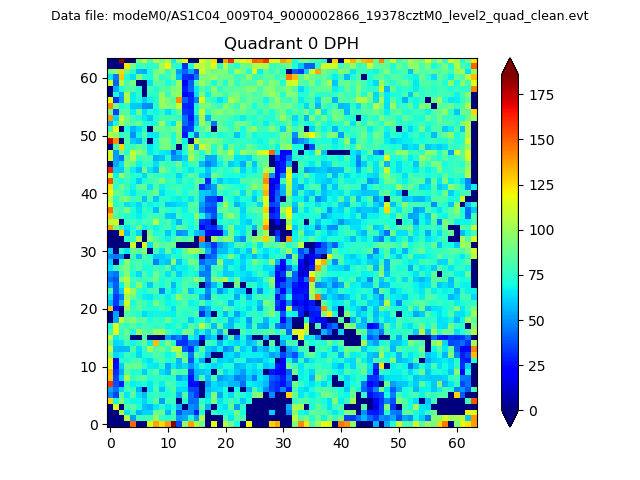 |
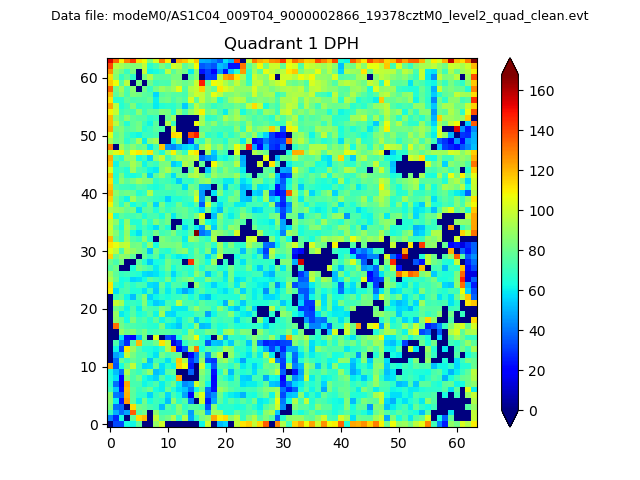 |
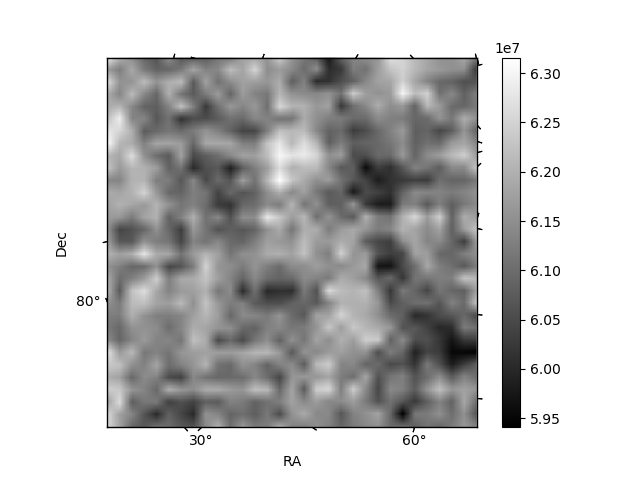
Quadrant B |
|---|---|---|---|
| Quadrant D | 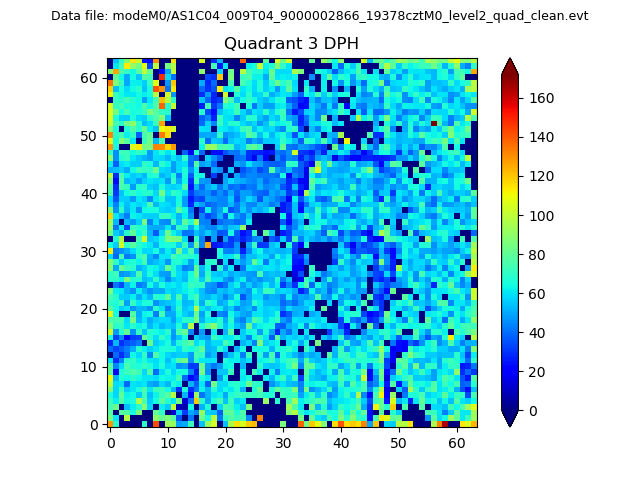 |
 |
Quadrant C |
| Plot type | Count rate plots | Images |
|---|---|---|
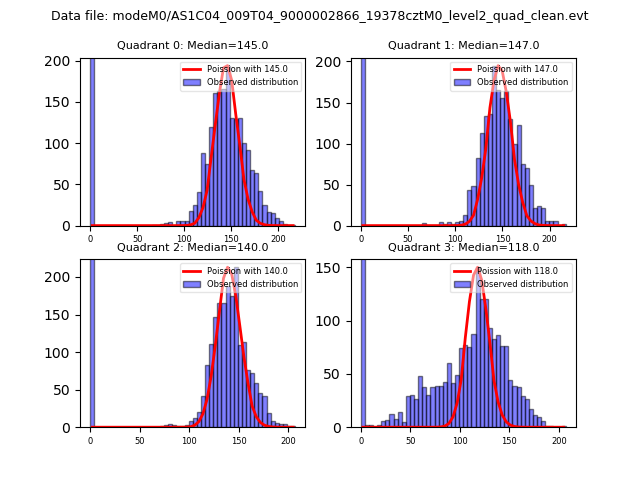
| Comparison with Poisson distribution Blue bars denote a histogram of data divided into 1 sec bins. Red curve is a Poisson curve with rate = median count rate of data. |
 |
 |
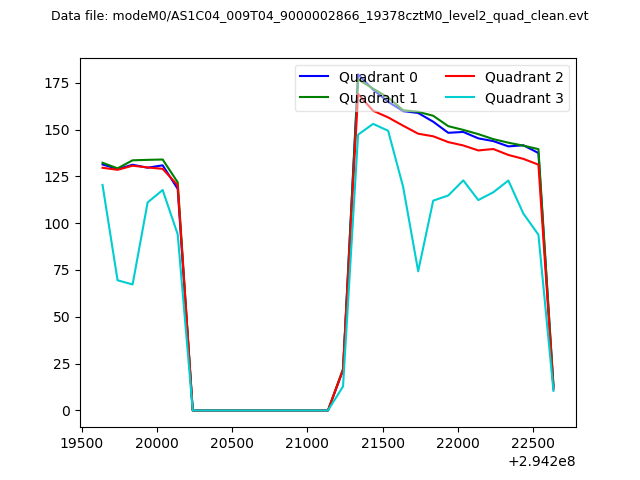
| Quadrant-wise count rates Data is divided into 100 sec bins |
 |
|
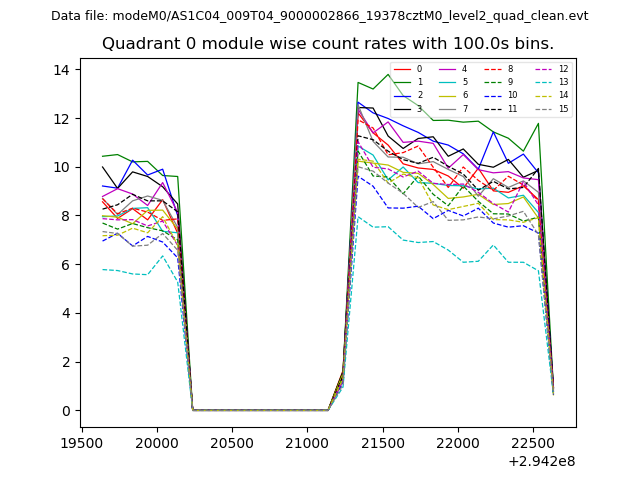
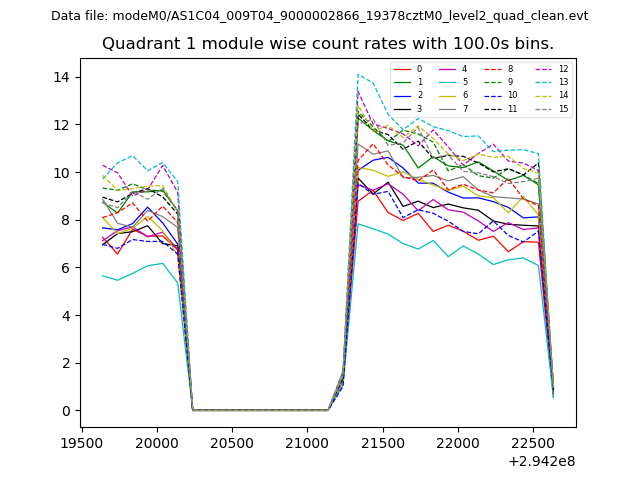
| Module-wise count rates for Quadrant A Data is divided into 100 sec bins |
 |
 |
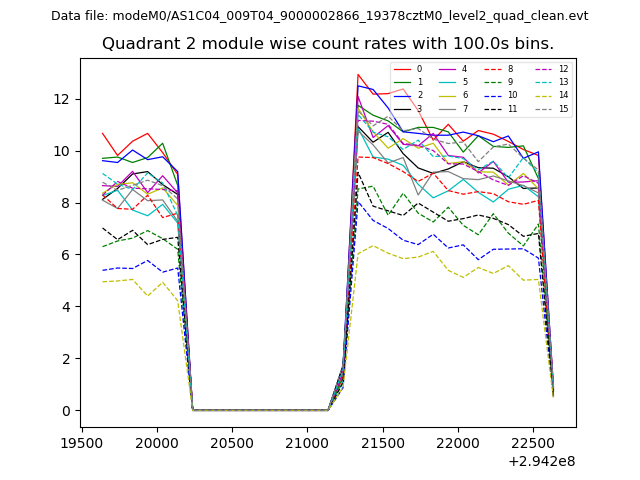
| Module-wise count rates for Quadrant B Data is divided into 100 sec bins |
 |
 |
| Module-wise count rates for Quadrant C Data is divided into 100 sec bins |
 |
 |
| Module-wise count rates for Quadrant D Data is divided into 100 sec bins |
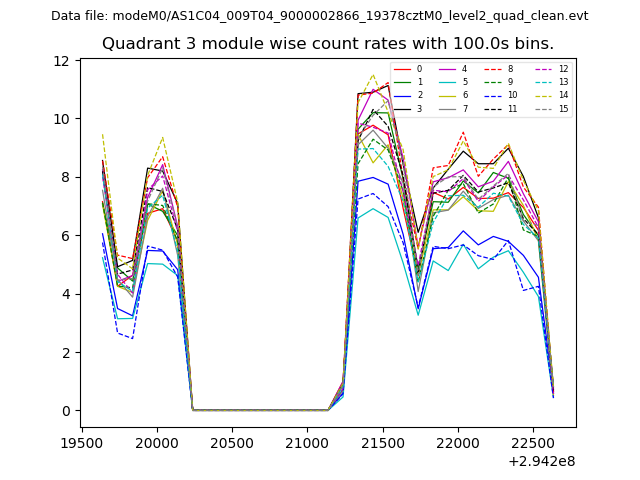 |
 |
| Parameter | Plot |
|---|---|
| CZT HV Monitor | 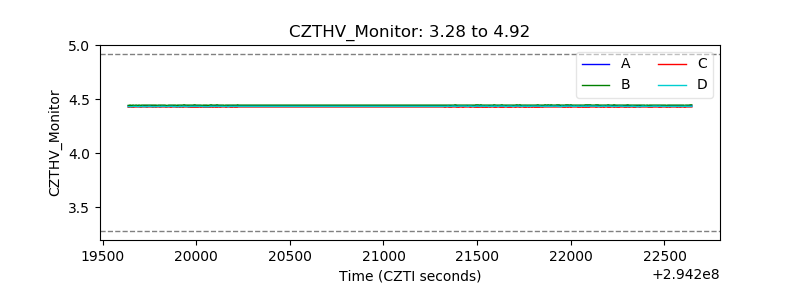 |
| D_VDD | 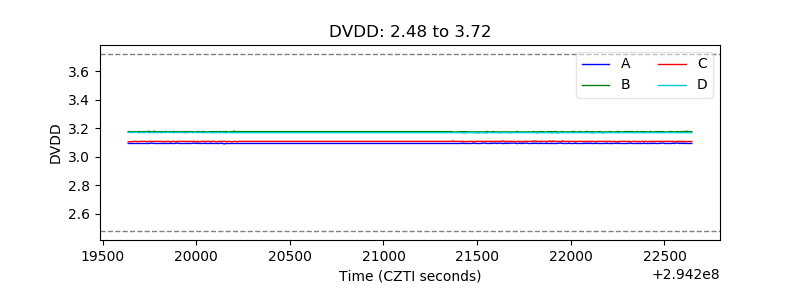 |
| Temperature 1 | 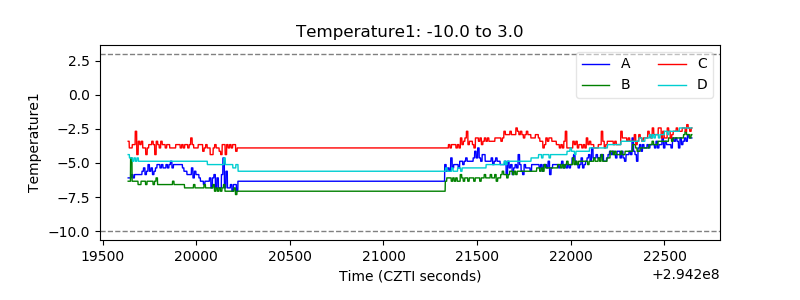 |
| Veto HV Monitor | 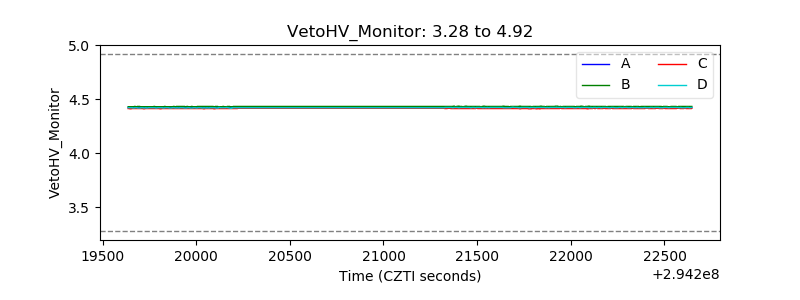 |
| Veto LLD | 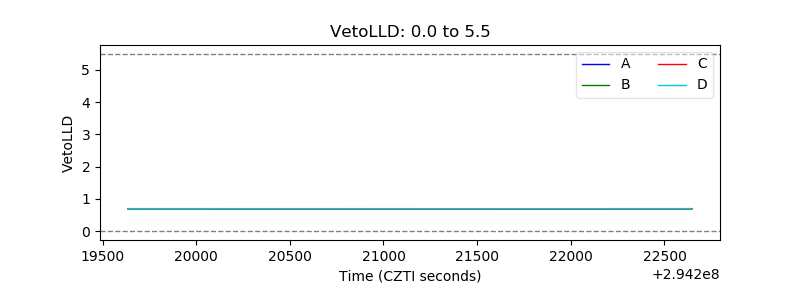 |
| Alpha Counter | 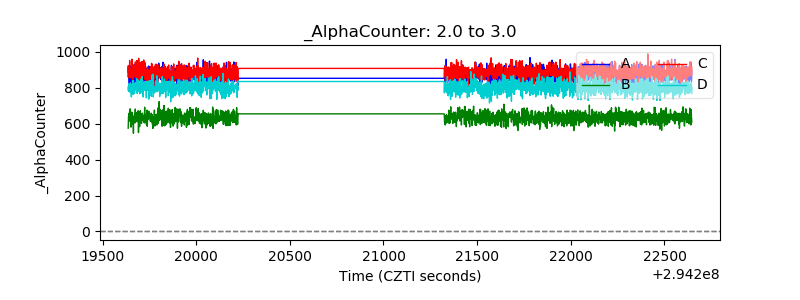 |
| _CPM_Rate | 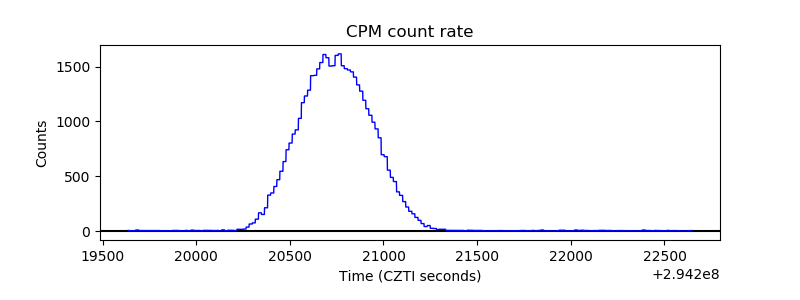 |
| CZT Counter | 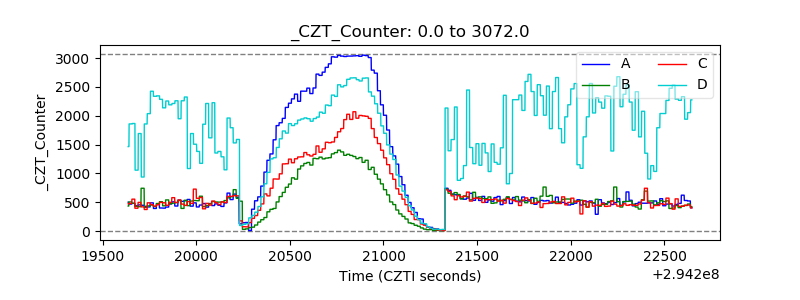 |
| +2.5 Volts monitor |  |
| +5 Volts monitor |  |
| _ROLL_ROT | 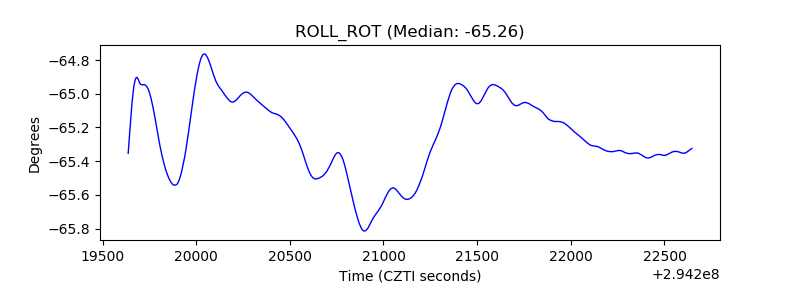 |
| _Roll_DEC | 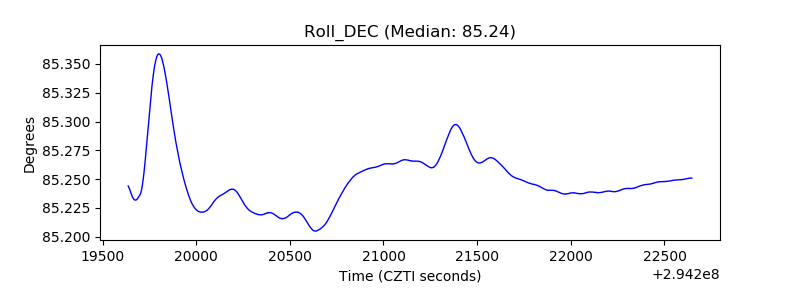 |
| _Roll_RA | 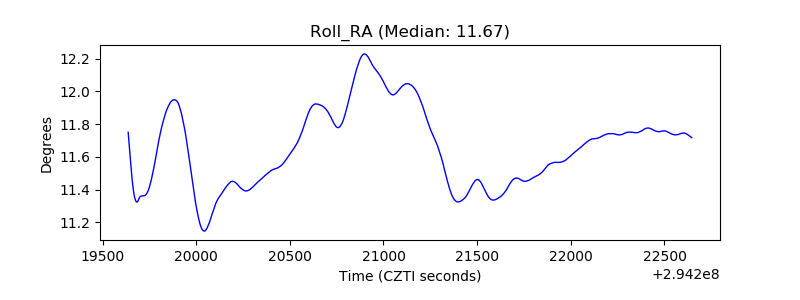 |
| Veto Counter | 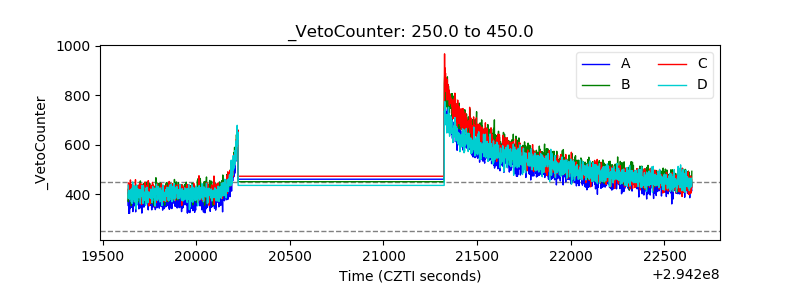 |