| Param | Original file | Final file |
|---|---|---|
| Filename | modeM0/AS1C04_009T04_9000002866_19379cztM0_level2.evt | modeM0/AS1C04_009T04_9000002866_19379cztM0_level2_quad_clean.evt |
| Size (bytes) | 680,014,080 | 111,464,640 |
| Size | 648.5 MB | 106.3 MB |
| Events in quadrant A | 2,794,266 | 819,973 |
| Events in quadrant B | 2,911,207 | 819,443 |
| Events in quadrant C | 2,744,257 | 776,886 |
| Events in quadrant D | 11,754,732 | 555,710 |
| Mode SS | |||
|---|---|---|---|
| Quadrant | BADHDUFLAG | Total packets | Discarded packets |
| A | 0 | 118 | 0 |
| B | 0 | 118 | 0 |
| C | 0 | 118 | 0 |
| D | 0 | 118 | 0 |
| Mode M0 | |||
|---|---|---|---|
| Quadrant | BADHDUFLAG | Total packets | Discarded packets |
| A | 0 | 12015 | 1 |
| B | 0 | 12289 | 1 |
| C | 0 | 11817 | 1 |
| D | 0 | 38874 | 1 |
| Mode M9 | |||
|---|---|---|---|
| Quadrant | BADHDUFLAG | Total packets | Discarded packets |
| A | 0 | 12 | 0 |
| B | 0 | 12 | 0 |
| C | 0 | 12 | 0 |
| D | 0 | 12 | 0 |
| Quadrant | Total seconds | Saturated seconds | Saturation percentage |
|---|---|---|---|
| A | 5751 | 39 | 0.678143% |
| B | 5752 | 56 | 0.973574% |
| C | 5752 | 42 | 0.730181% |
| D | 5752 | 3729 | 64.829624% |
Noise dominated data is calculated using 1-second bins in cleaned event files. If a bin has >2000 counts, and if more than 50% of those come from <1% of pixels, then it is considered to be noise-dominated and hence unusable.
| Quadrant | # 1 sec bins | Bins with >0 counts | Bins with >2000 counts | High rate bins dominated by noise | Noise dominated (total time) | Noise dominated (detector-on time) | Marked lightcurve |
|---|---|---|---|---|---|---|---|
| A | 6951 | 5751 | 0 | 0 | 0.00% | 0.00% | 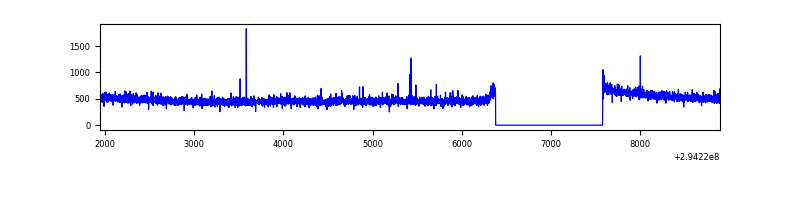 |
| B | 6952 | 5753 | 26 | 26 | 0.37% | 0.45% | 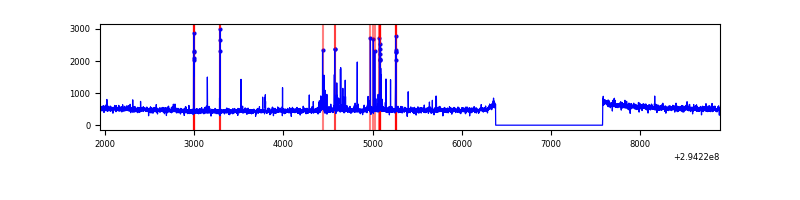 |
| C | 6952 | 5753 | 0 | 0 | 0.00% | 0.00% | 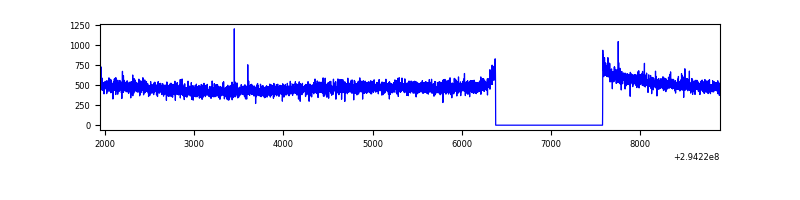 |
| D | 6951 | 5751 | 3485 | 3485 | 50.14% | 60.60% | 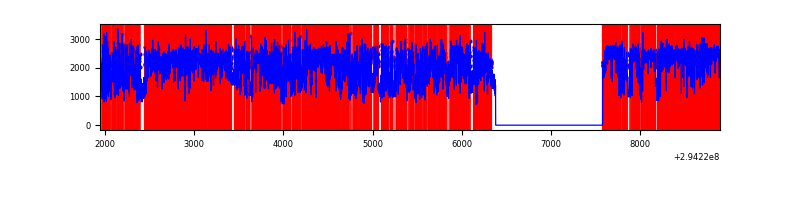 |
Top three noisy pixels from each quadrant. If the there are fewer than three noisy pixels in the level2.evt file, extra rows are filled as -1
| Pixel properties | Quadrant properties | ||||||
|---|---|---|---|---|---|---|---|
| Quadrant | DetID | PixID | Counts | Sigma | Mean | Median | Sigma |
| A | 12 | 96 | 7413 | 46.82 | 719 | 706 | 143.3 |
| A | 13 | 254 | 6399 | 39.74 | 719 | 706 | 143.3 |
| A | 0 | 226 | 6349 | 39.39 | 719 | 706 | 143.3 |
| B | 7 | 220 | 59976 | 450.3 | 705 | 691 | 131.7 |
| B | 15 | 32 | 36729 | 273.73 | 705 | 691 | 131.7 |
| B | 4 | 216 | 16366 | 119.06 | 705 | 691 | 131.7 |
| C | 14 | 238 | 108509 | 693.31 | 675 | 679 | 155.5 |
| C | 13 | 61 | 4628 | 25.39 | 675 | 679 | 155.5 |
| C | 3 | 233 | 2442 | 11.34 | 675 | 679 | 155.5 |
| D | 10 | 66 | 7620959 | 58186.17 | 538 | 520 | 131.0 |
| D | 7 | 238 | 1538453 | 11742.95 | 538 | 520 | 131.0 |
| D | 12 | 218 | 238227 | 1815.02 | 538 | 520 | 131.0 |
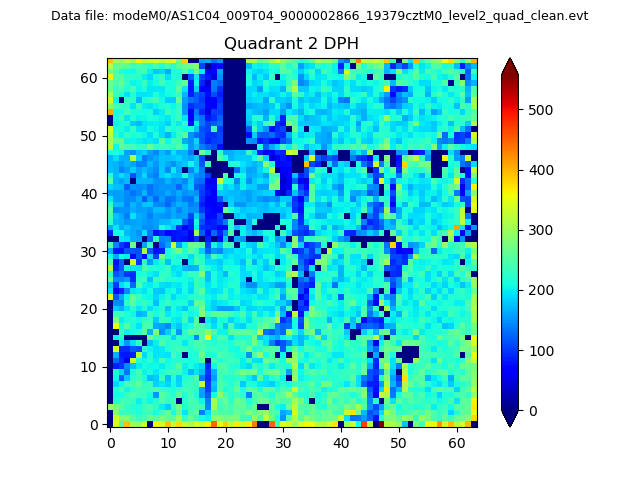
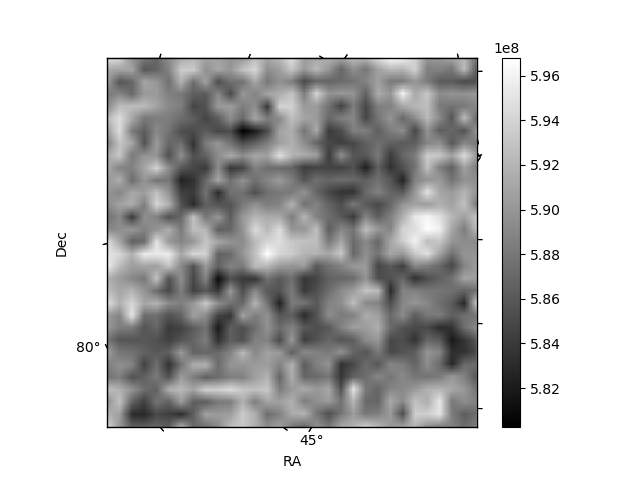
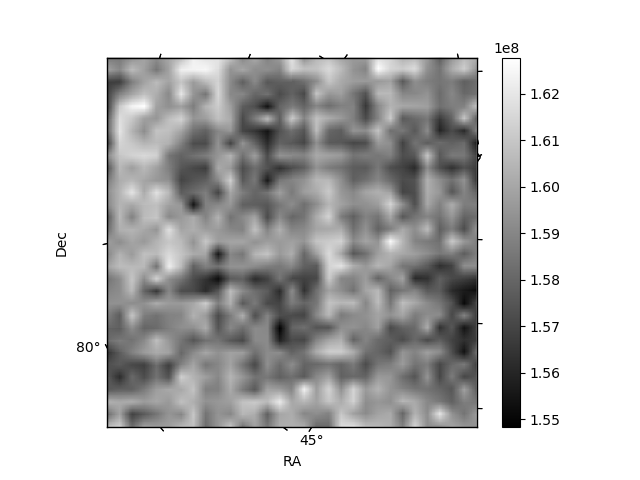
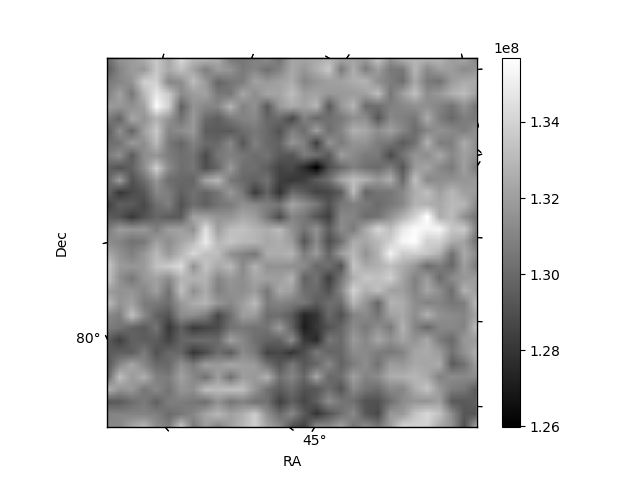
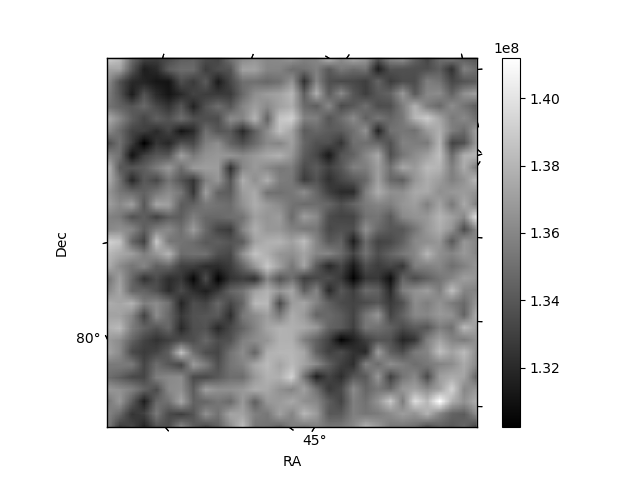
Histogram calculated using DETX and DETY for each event in the final _common_clean file
| Quadrant A | 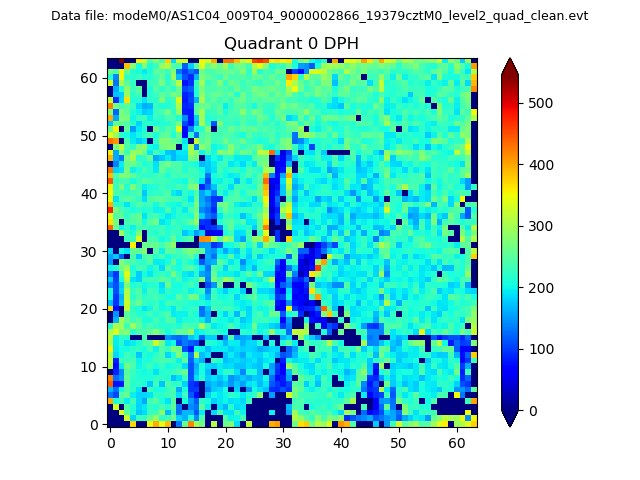 |
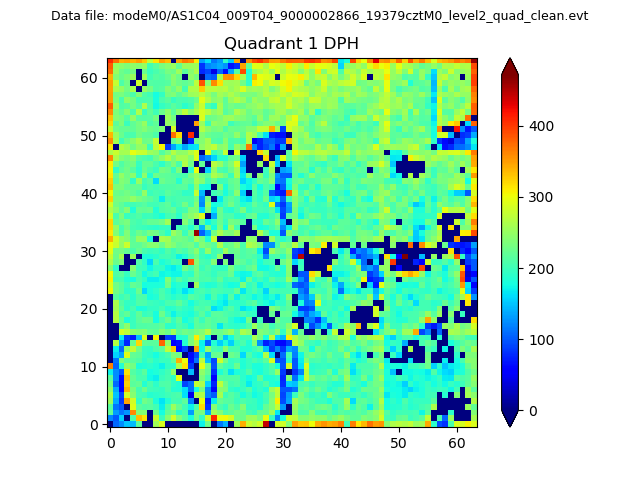 |
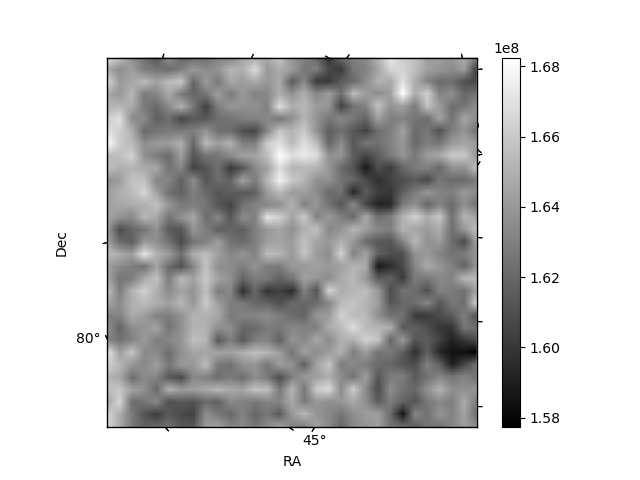
Quadrant B |
|---|---|---|---|
| Quadrant D | 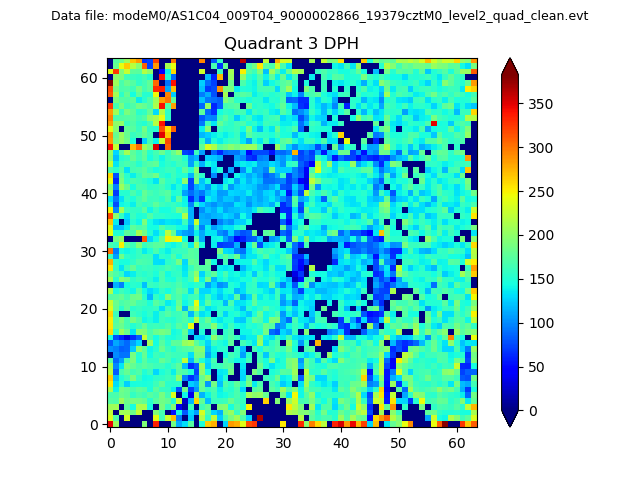 |
 |
Quadrant C |
| Plot type | Count rate plots | Images |
|---|---|---|
| Comparison with Poisson distribution Blue bars denote a histogram of data divided into 1 sec bins. Red curve is a Poisson curve with rate = median count rate of data. |
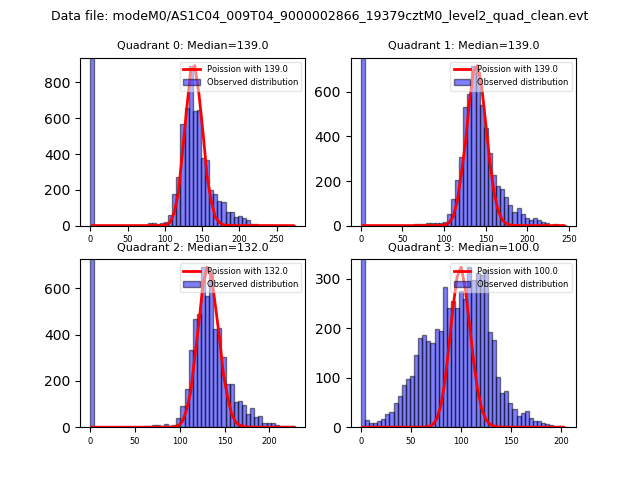 |
 |
| Quadrant-wise count rates Data is divided into 100 sec bins |
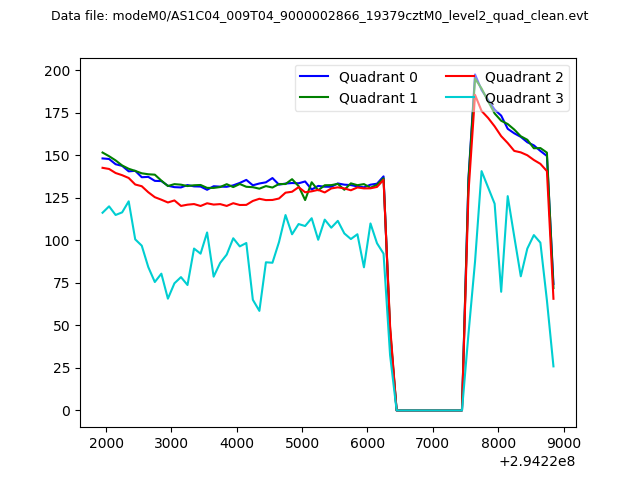 |
|
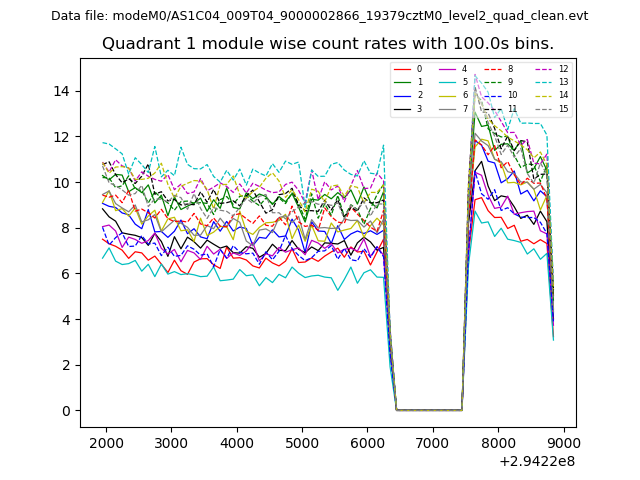
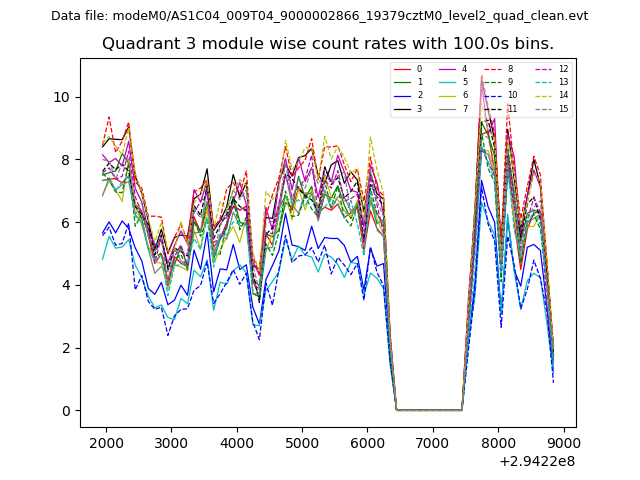
| Module-wise count rates for Quadrant A Data is divided into 100 sec bins |
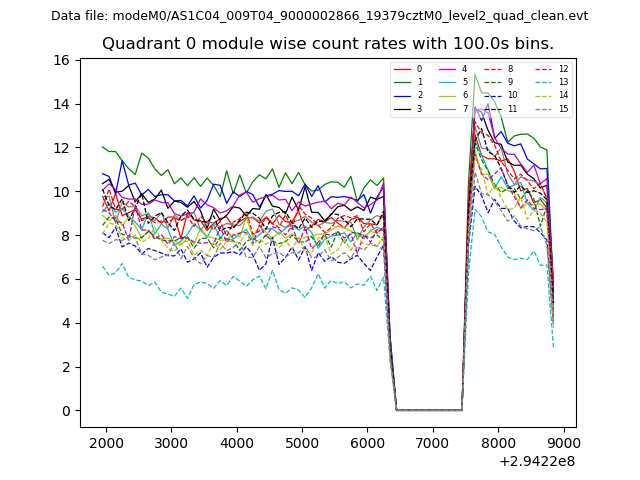 |
 |
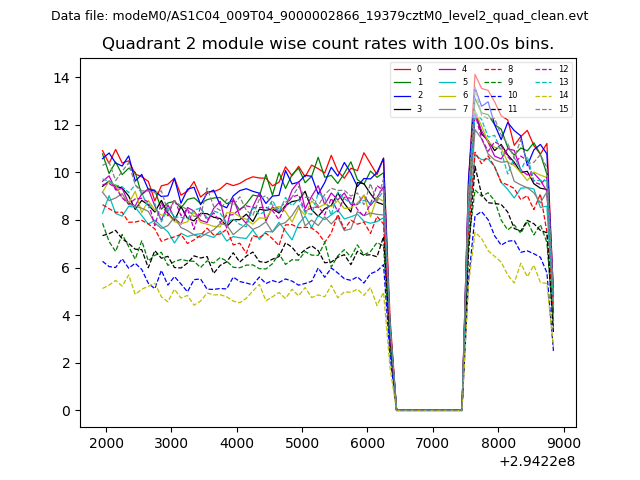
| Module-wise count rates for Quadrant B Data is divided into 100 sec bins |
 |
 |
| Module-wise count rates for Quadrant C Data is divided into 100 sec bins |
 |
 |
| Module-wise count rates for Quadrant D Data is divided into 100 sec bins |
 |
 |
| Parameter | Plot |
|---|---|
| CZT HV Monitor | 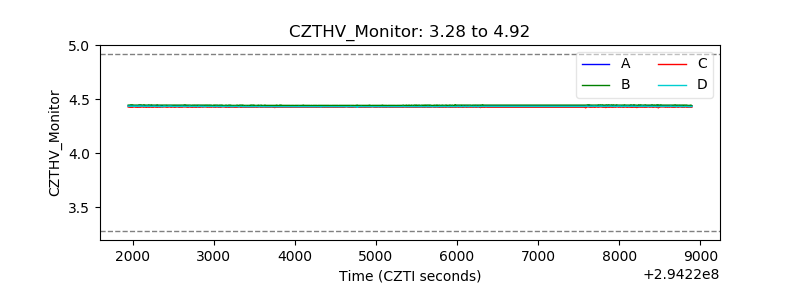 |
| D_VDD | 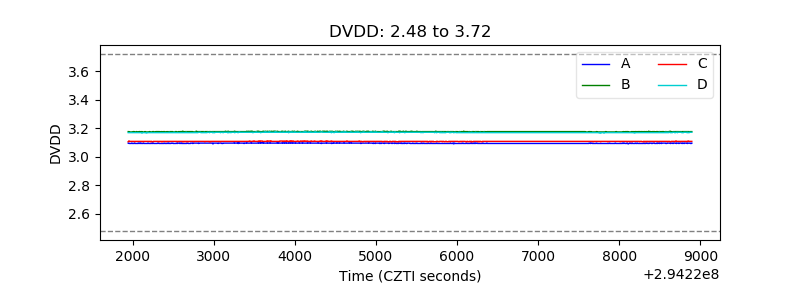 |
| Temperature 1 | 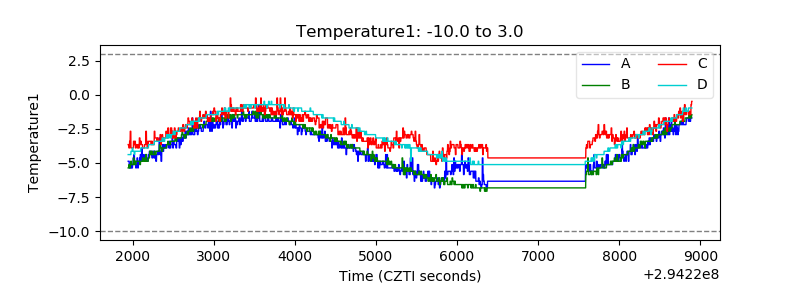 |
| Veto HV Monitor | 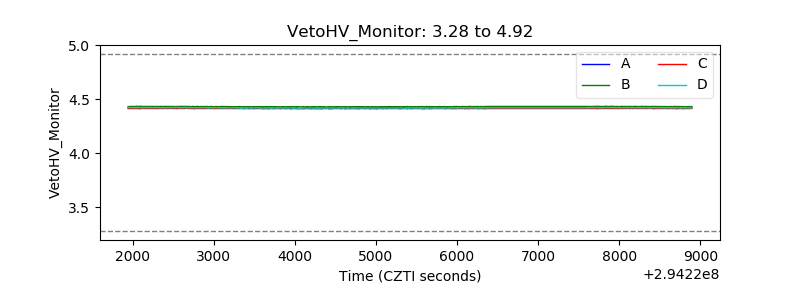 |
| Veto LLD | 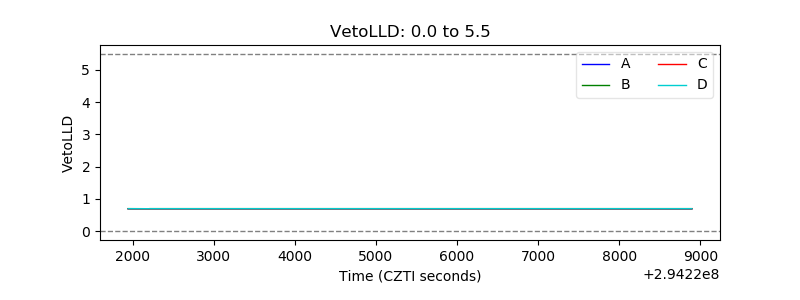 |
| Alpha Counter |  |
| _CPM_Rate | 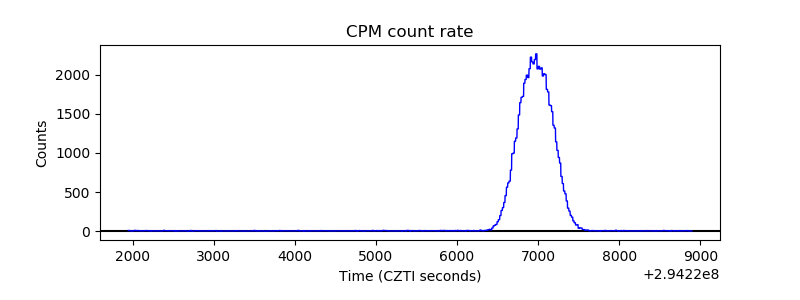 |
| CZT Counter | 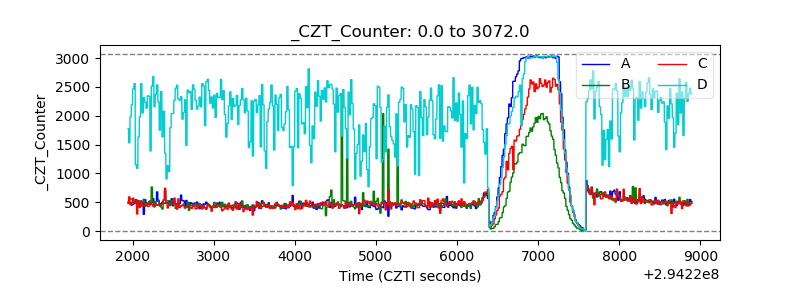 |
| +2.5 Volts monitor |  |
| +5 Volts monitor |  |
| _ROLL_ROT | 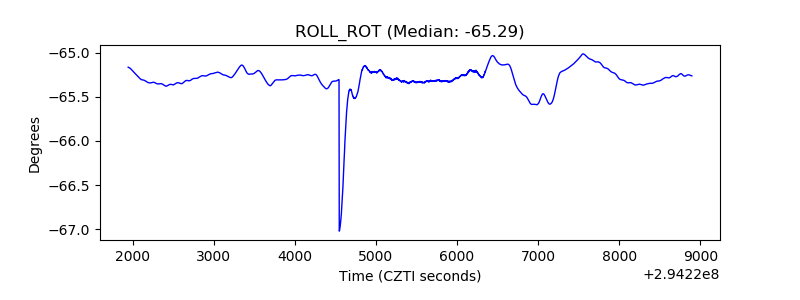 |
| _Roll_DEC | 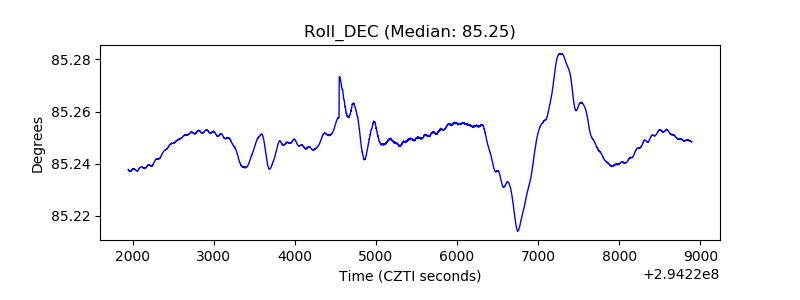 |
| _Roll_RA | 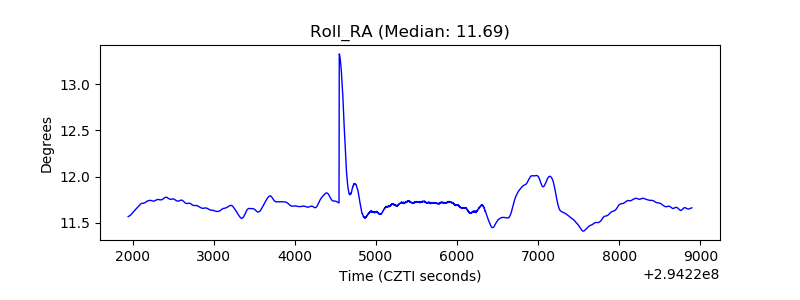 |
| Veto Counter | 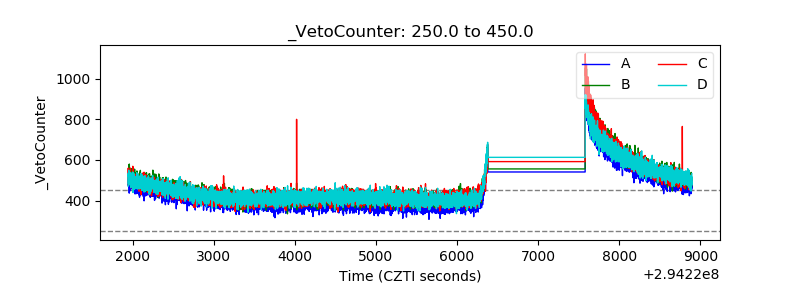 |