| Param | Original file | Final file |
|---|---|---|
| Filename | modeM0/AS1C04_009T04_9000002866_19380cztM0_level2.evt | modeM0/AS1C04_009T04_9000002866_19380cztM0_level2_quad_clean.evt |
| Size (bytes) | 290,108,160 | 45,619,200 |
| Size | 276.7 MB | 43.5 MB |
| Events in quadrant A | 1,135,603 | 344,690 |
| Events in quadrant B | 1,171,446 | 343,120 |
| Events in quadrant C | 1,115,832 | 316,306 |
| Events in quadrant D | 5,201,469 | 207,008 |
| Mode SS | |||
|---|---|---|---|
| Quadrant | BADHDUFLAG | Total packets | Discarded packets |
| A | 0 | 46 | 0 |
| B | 0 | 46 | 0 |
| C | 0 | 46 | 0 |
| D | 0 | 46 | 0 |
| Mode M0 | |||
|---|---|---|---|
| Quadrant | BADHDUFLAG | Total packets | Discarded packets |
| A | 0 | 4762 | 0 |
| B | 0 | 4883 | 0 |
| C | 0 | 4763 | 0 |
| D | 0 | 17059 | 0 |
| Quadrant | Total seconds | Saturated seconds | Saturation percentage |
|---|---|---|---|
| A | 2352 | 1 | 0.042517% |
| B | 2353 | 2 | 0.084998% |
| C | 2353 | 5 | 0.212495% |
| D | 2353 | 1841 | 78.240544% |
Noise dominated data is calculated using 1-second bins in cleaned event files. If a bin has >2000 counts, and if more than 50% of those come from <1% of pixels, then it is considered to be noise-dominated and hence unusable.
| Quadrant | # 1 sec bins | Bins with >0 counts | Bins with >2000 counts | High rate bins dominated by noise | Noise dominated (total time) | Noise dominated (detector-on time) | Marked lightcurve |
|---|---|---|---|---|---|---|---|
| A | 2352 | 2352 | 0 | 0 | 0.00% | 0.00% | 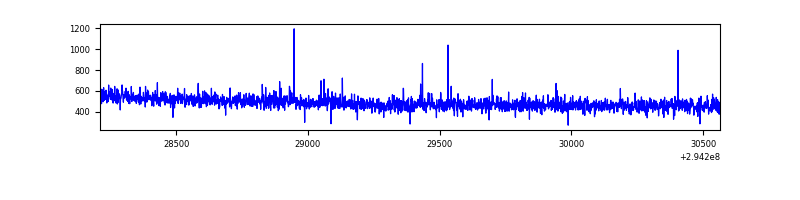 |
| B | 2353 | 2353 | 0 | 0 | 0.00% | 0.00% | 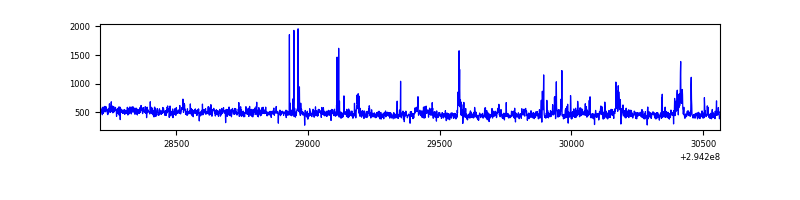 |
| C | 2353 | 2353 | 2 | 2 | 0.08% | 0.08% | 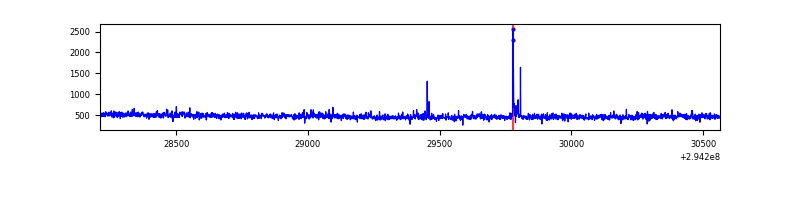 |
| D | 2352 | 2352 | 1754 | 1754 | 74.57% | 74.57% | 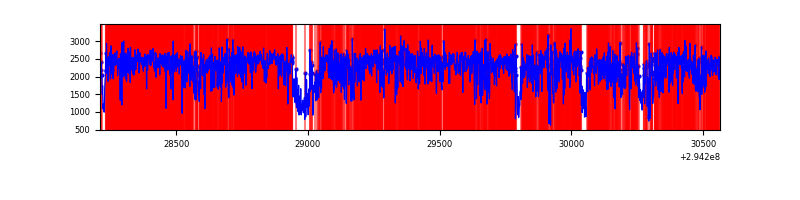 |
Top three noisy pixels from each quadrant. If the there are fewer than three noisy pixels in the level2.evt file, extra rows are filled as -1
| Pixel properties | Quadrant properties | ||||||
|---|---|---|---|---|---|---|---|
| Quadrant | DetID | PixID | Counts | Sigma | Mean | Median | Sigma |
| A | 5 | 16 | 4331 | 67.77 | 292 | 287 | 59.7 |
| A | 12 | 96 | 3919 | 60.87 | 292 | 287 | 59.7 |
| A | 0 | 226 | 2580 | 38.43 | 292 | 287 | 59.7 |
| B | 4 | 216 | 21333 | 389.58 | 284 | 278 | 54.0 |
| B | 15 | 32 | 19305 | 352.05 | 284 | 278 | 54.0 |
| B | 7 | 220 | 6519 | 115.48 | 284 | 278 | 54.0 |
| C | 14 | 238 | 44069 | 691.82 | 270 | 271 | 63.3 |
| C | 5 | 112 | 14928 | 231.52 | 270 | 271 | 63.3 |
| C | 4 | 175 | 3600 | 52.58 | 270 | 271 | 63.3 |
| D | 10 | 66 | 3557977 | 70689.47 | 202 | 196 | 50.3 |
| D | 7 | 238 | 714125 | 14185.04 | 202 | 196 | 50.3 |
| D | 12 | 218 | 98350 | 1950.22 | 202 | 196 | 50.3 |
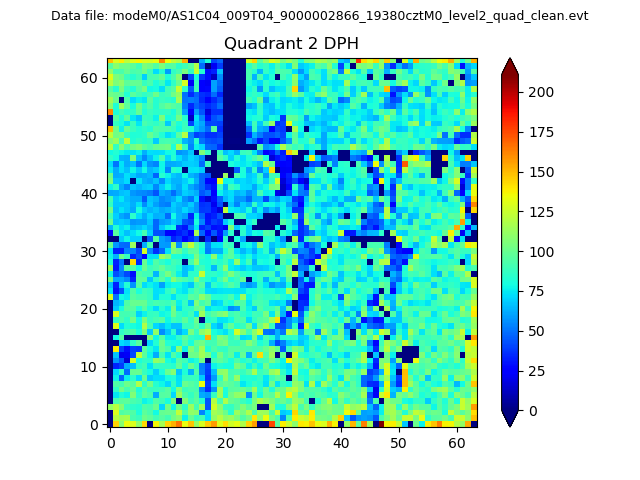
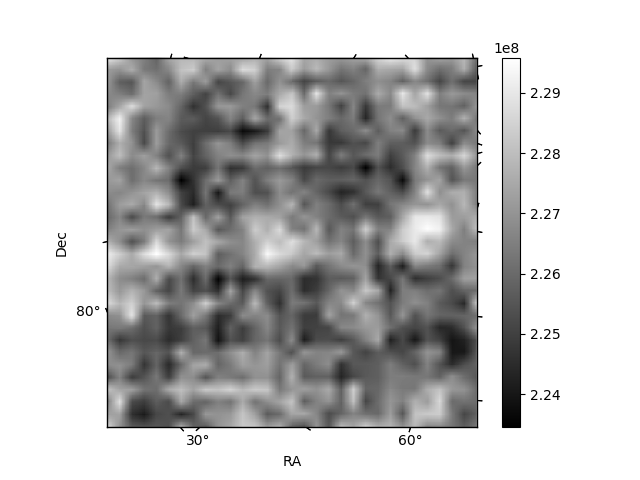
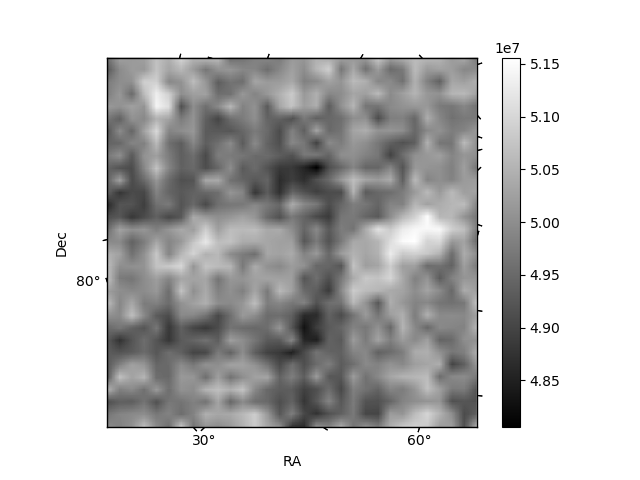
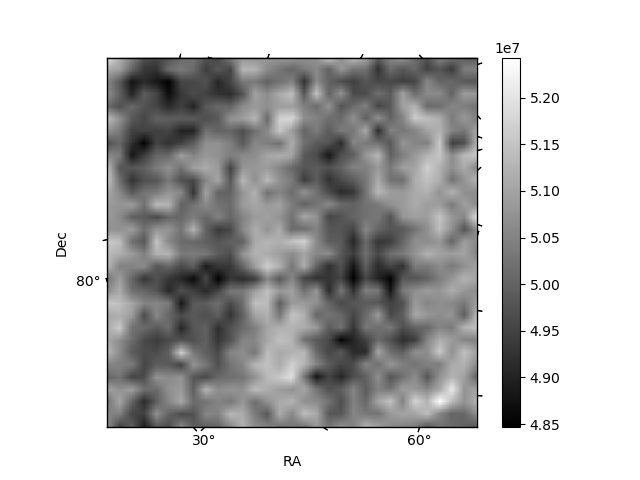
Histogram calculated using DETX and DETY for each event in the final _common_clean file
| Quadrant A | 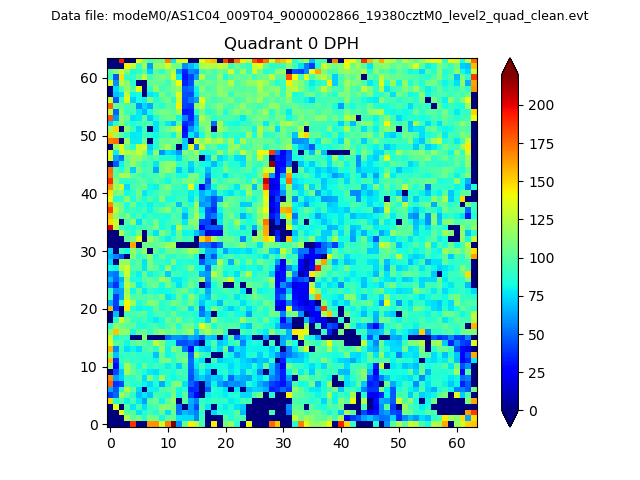 |
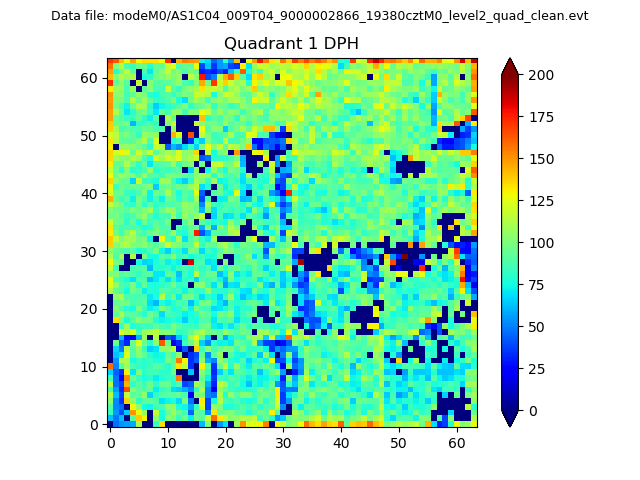 |
Quadrant B |
|---|---|---|---|
| Quadrant D | 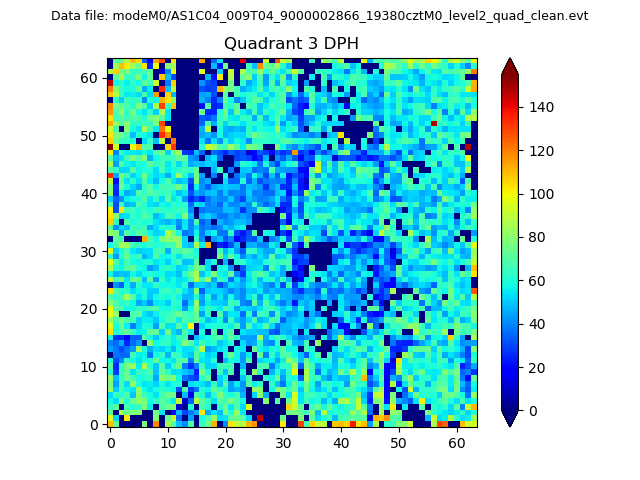 |
 |
Quadrant C |
| Plot type | Count rate plots | Images |
|---|---|---|
| Comparison with Poisson distribution Blue bars denote a histogram of data divided into 1 sec bins. Red curve is a Poisson curve with rate = median count rate of data. |
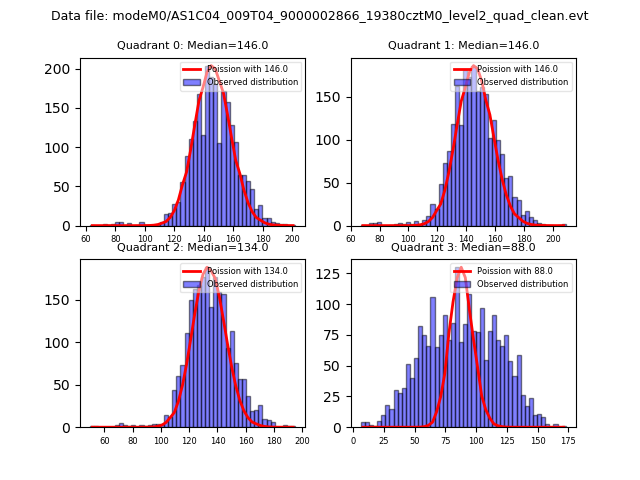 |
 |
| Quadrant-wise count rates Data is divided into 100 sec bins |
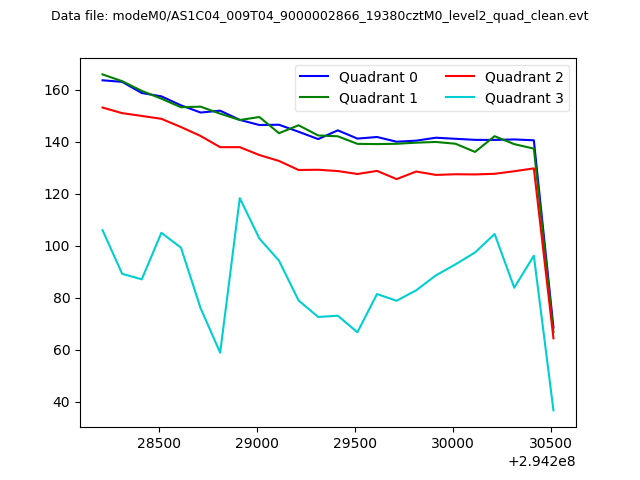 |
|
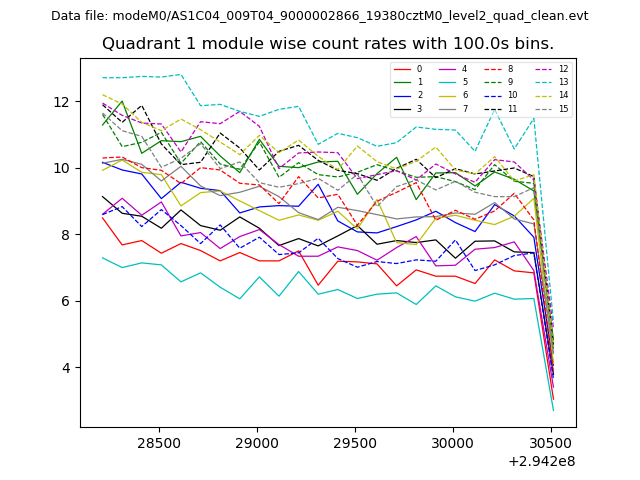
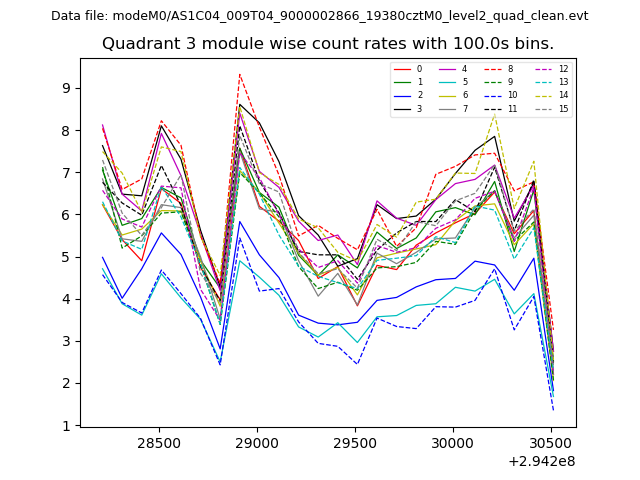
| Module-wise count rates for Quadrant A Data is divided into 100 sec bins |
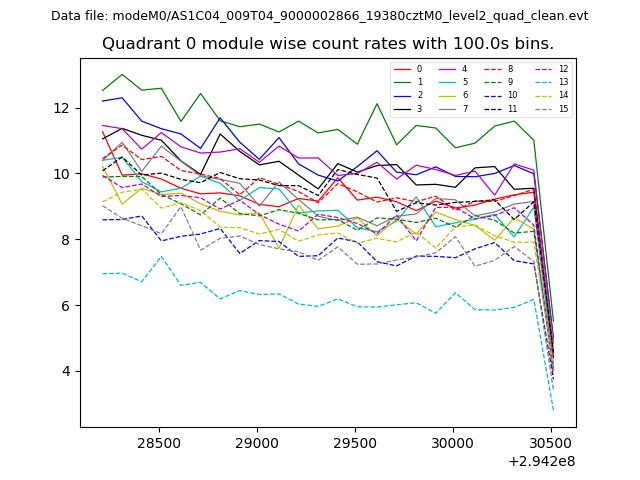 |
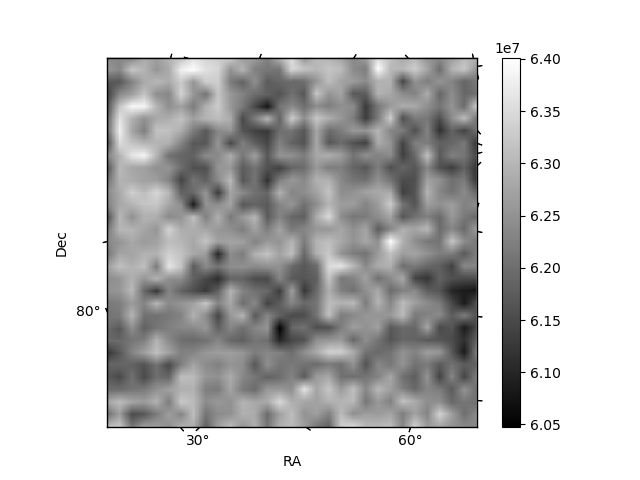 |
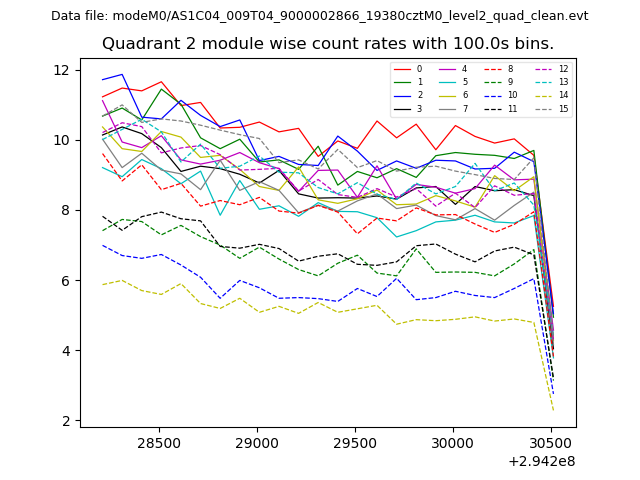
| Module-wise count rates for Quadrant B Data is divided into 100 sec bins |
 |
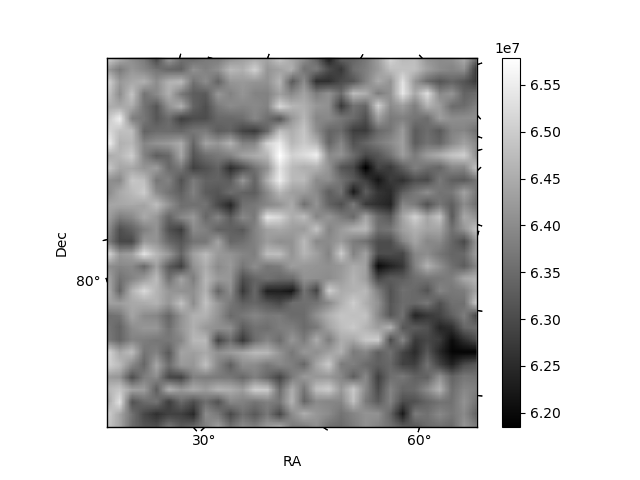 |
| Module-wise count rates for Quadrant C Data is divided into 100 sec bins |
 |
 |
| Module-wise count rates for Quadrant D Data is divided into 100 sec bins |
 |
 |
| Parameter | Plot |
|---|---|
| CZT HV Monitor | 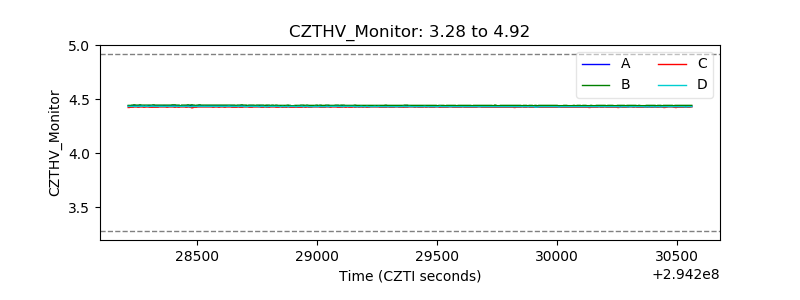 |
| D_VDD | 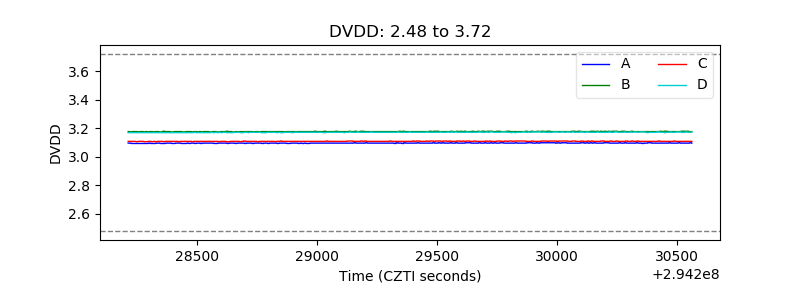 |
| Temperature 1 | 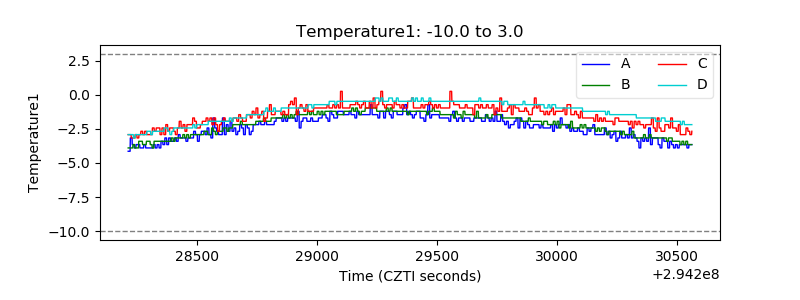 |
| Veto HV Monitor |  |
| Veto LLD | 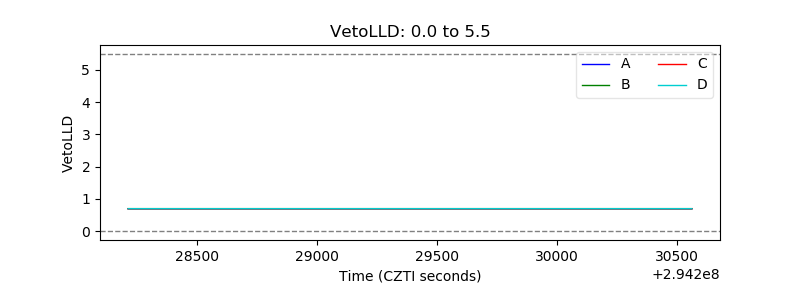 |
| Alpha Counter | 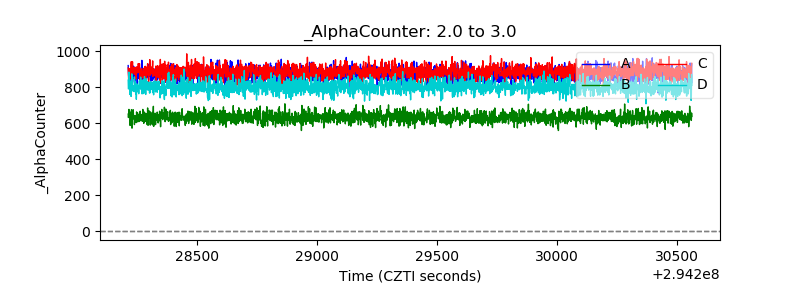 |
| _CPM_Rate | 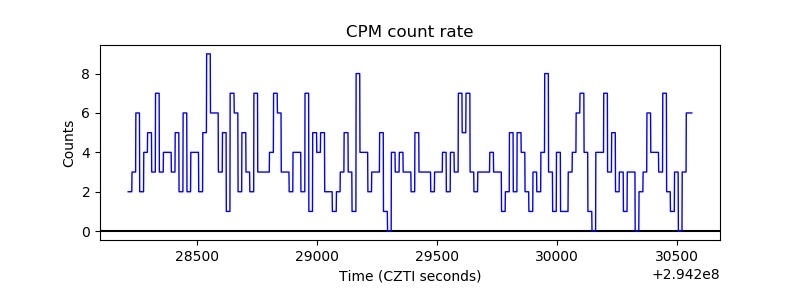 |
| CZT Counter | 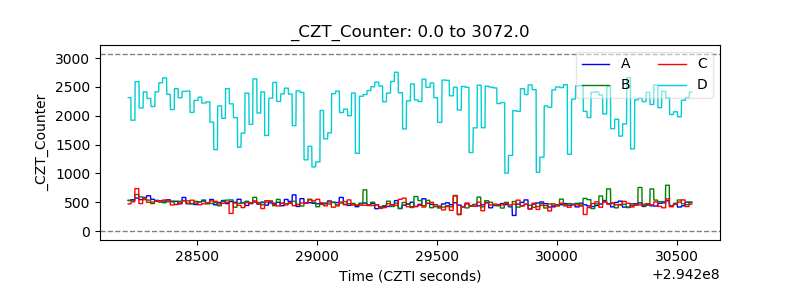 |
| +2.5 Volts monitor | 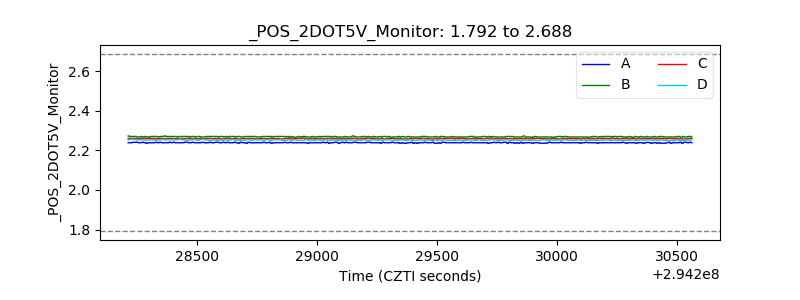 |
| +5 Volts monitor |  |
| _ROLL_ROT | 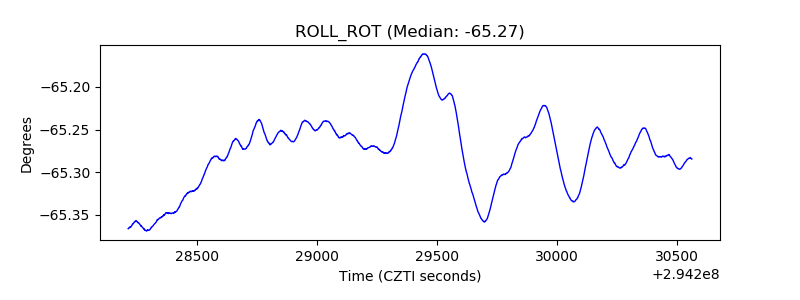 |
| _Roll_DEC | 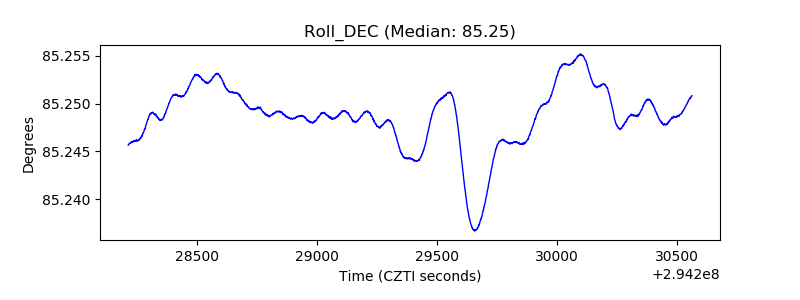 |
| _Roll_RA | 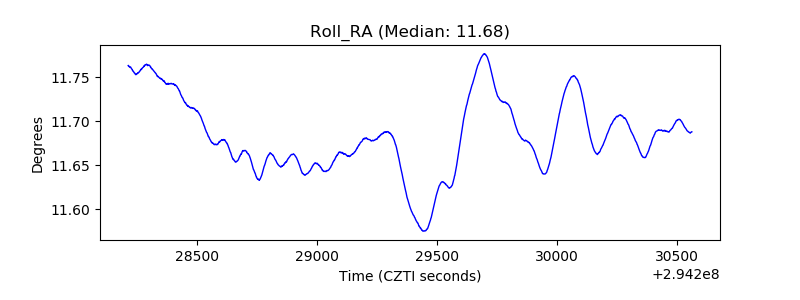 |
| Veto Counter | 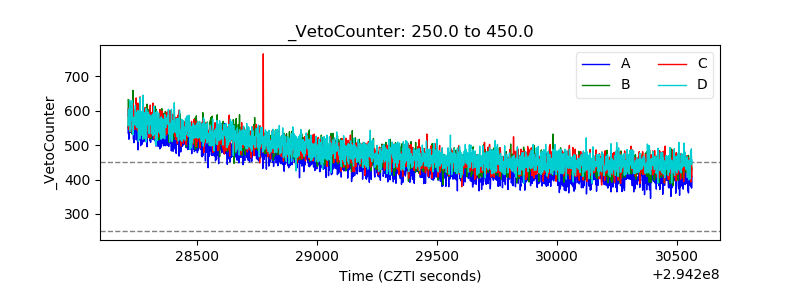 |