| Param | Original file | Final file |
|---|---|---|
| Filename | modeM0/AS1T03_105T01_9000002876cztM0_level2.fits | modeM0/AS1T03_105T01_9000002876cztM0_level2_quad_clean.evt |
| Size (bytes) | 198,207,360 | 203,414,400 |
| Size | 189.0 MB | 194.0 MB |
| Events in quadrant A | 1,263,682 | 1,333,900 |
| Events in quadrant B | 1,213,712 | 1,324,256 |
| Events in quadrant C | 1,236,062 | 1,282,965 |
| Events in quadrant D | 757,392 | 692,878 |
| Mode M0 | |||
|---|---|---|---|
| Quadrant | BADHDUFLAG | Total packets | Discarded packets |
| A | 0 | 46654 | 0 |
| B | 0 | 46934 | 0 |
| C | 0 | 46357 | 0 |
| D | 0 | 136420 | 0 |
| Mode SS | |||
|---|---|---|---|
| Quadrant | BADHDUFLAG | Total packets | Discarded packets |
| A | 0 | 454 | 0 |
| B | 0 | 454 | 0 |
| C | 0 | 454 | 0 |
| D | 0 | 454 | 0 |
| Mode M9 | |||
|---|---|---|---|
| Quadrant | BADHDUFLAG | Total packets | Discarded packets |
| A | 0 | 16 | 0 |
| B | 0 | 16 | 0 |
| C | 0 | 16 | 0 |
| D | 0 | 16 | 0 |
| Quadrant | Total seconds | Saturated seconds | Saturation percentage |
|---|---|---|---|
| A | 22155 | 219 | 0.988490% |
| B | 22155 | 257 | 1.160009% |
| C | 22155 | 370 | 1.670052% |
| D | 22155 | 12888 | 58.171970% |
Noise dominated data is calculated using 1-second bins in cleaned event files. If a bin has >2000 counts, and if more than 50% of those come from <1% of pixels, then it is considered to be noise-dominated and hence unusable.
| Quadrant | # 1 sec bins | Bins with >0 counts | Bins with >2000 counts | High rate bins dominated by noise | Noise dominated (total time) | Noise dominated (detector-on time) | Marked lightcurve |
|---|---|---|---|---|---|---|---|
| A | 23856 | 22154 | 0 | 0 | 0.00% | 0.00% |  |
| B | 23856 | 22154 | 0 | 0 | 0.00% | 0.00% |  |
| C | 23856 | 22153 | 0 | 0 | 0.00% | 0.00% |  |
| D | 23856 | 22096 | 0 | 0 | 0.00% | 0.00% |  |
Top three noisy pixels from each quadrant. If the there are fewer than three noisy pixels in the level2.evt file, extra rows are filled as -1
| Pixel properties | Quadrant properties | ||||||
|---|---|---|---|---|---|---|---|
| Quadrant | DetID | PixID | Counts | Sigma | Mean | Median | Sigma |
| A | 0 | 29 | 1262 | 11.51 | 329 | 309 | 82.8 |
| A | 7 | 110 | 1046 | 8.9 | 329 | 309 | 82.8 |
| A | 9 | 19 | 968 | 7.96 | 329 | 309 | 82.8 |
| B | 2 | 9 | 980 | 10.49 | 320 | 306 | 64.3 |
| B | 14 | 254 | 825 | 8.08 | 320 | 306 | 64.3 |
| B | 2 | 8 | 800 | 7.69 | 320 | 306 | 64.3 |
| C | 1 | 80 | 1004 | 8.22 | 326 | 304 | 85.2 |
| C | 1 | 81 | 974 | 7.86 | 326 | 304 | 85.2 |
| C | 12 | 241 | 896 | 6.95 | 326 | 304 | 85.2 |
| D | 6 | 231 | 576 | 6.36 | 215 | 195 | 59.9 |
| D | 3 | 14 | 556 | 6.03 | 215 | 195 | 59.9 |
| D | 7 | 5 | 549 | 5.91 | 215 | 195 | 59.9 |
Histogram calculated using DETX and DETY for each event in the final _common_clean file
| Quadrant A |  |
 |
Quadrant B |
|---|---|---|---|
| Quadrant D |  |
 |
Quadrant C |
| Plot type | Count rate plots | Images |
|---|---|---|
| Comparison with Poisson distribution Blue bars denote a histogram of data divided into 1 sec bins. Red curve is a Poisson curve with rate = median count rate of data. |
 |
 |
| Quadrant-wise count rates Data is divided into 100 sec bins |
 |
|
| Module-wise count rates for Quadrant A Data is divided into 100 sec bins |
 |
 |
| Module-wise count rates for Quadrant B Data is divided into 100 sec bins |
 |
 |
| Module-wise count rates for Quadrant C Data is divided into 100 sec bins |
 |
 |
| Module-wise count rates for Quadrant D Data is divided into 100 sec bins |
 |
 |
| Parameter | Plot |
|---|---|
| CZT HV Monitor |  |
| D_VDD |  |
| Temperature 1 |  |
| Veto HV Monitor |  |
| Veto LLD |  |
| Alpha Counter |  |
| _CPM_Rate |  |
| CZT Counter |  |
| +2.5 Volts monitor |  |
| +5 Volts monitor |  |
| _ROLL_ROT |  |
| _Roll_DEC |  |
| _Roll_RA | 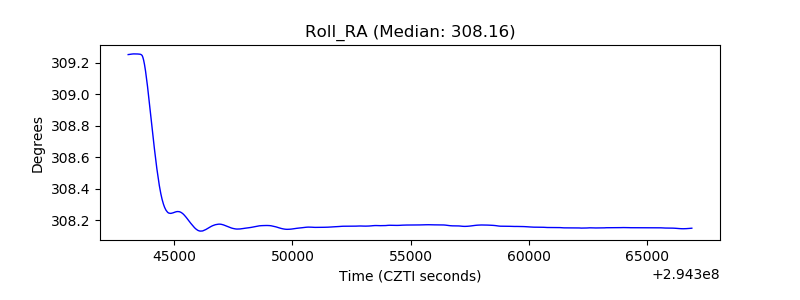 |
| Veto Counter |  |