| Param | Original file | Final file |
|---|---|---|
| Filename | modeM0/AS1T03_105T01_9000002876_19399cztM0_level2.evt | modeM0/AS1T03_105T01_9000002876_19399cztM0_level2_quad_clean.evt |
| Size (bytes) | 529,606,080 | 54,132,480 |
| Size | 505.1 MB | 51.6 MB |
| Events in quadrant A | 2,198,586 | 367,577 |
| Events in quadrant B | 2,075,195 | 372,963 |
| Events in quadrant C | 2,209,399 | 359,461 |
| Events in quadrant D | 9,266,562 | 238,558 |
| Mode M0 | |||
|---|---|---|---|
| Quadrant | BADHDUFLAG | Total packets | Discarded packets |
| A | 0 | 9277 | 1 |
| B | 0 | 8851 | 1 |
| C | 0 | 9334 | 1 |
| D | 0 | 30411 | 1 |
| Mode SS | |||
|---|---|---|---|
| Quadrant | BADHDUFLAG | Total packets | Discarded packets |
| A | 0 | 88 | 0 |
| B | 0 | 88 | 0 |
| C | 0 | 88 | 0 |
| D | 0 | 88 | 0 |
| Mode M9 | |||
|---|---|---|---|
| Quadrant | BADHDUFLAG | Total packets | Discarded packets |
| A | 0 | 6 | 0 |
| B | 0 | 6 | 0 |
| C | 0 | 6 | 0 |
| D | 0 | 6 | 0 |
| Quadrant | Total seconds | Saturated seconds | Saturation percentage |
|---|---|---|---|
| A | 4248 | 81 | 1.906780% |
| B | 4248 | 52 | 1.224105% |
| C | 4248 | 115 | 2.707156% |
| D | 4248 | 3488 | 82.109228% |
Noise dominated data is calculated using 1-second bins in cleaned event files. If a bin has >2000 counts, and if more than 50% of those come from <1% of pixels, then it is considered to be noise-dominated and hence unusable.
| Quadrant | # 1 sec bins | Bins with >0 counts | Bins with >2000 counts | High rate bins dominated by noise | Noise dominated (total time) | Noise dominated (detector-on time) | Marked lightcurve |
|---|---|---|---|---|---|---|---|
| A | 4888 | 4248 | 25 | 25 | 0.51% | 0.59% | 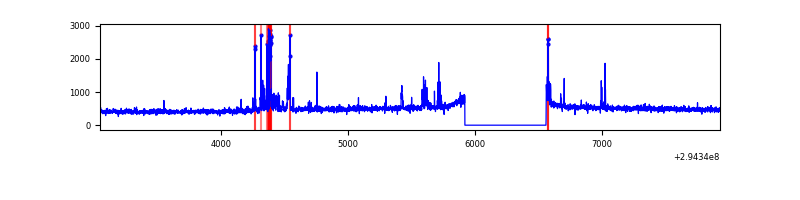 |
| B | 4888 | 4249 | 0 | 0 | 0.00% | 0.00% | 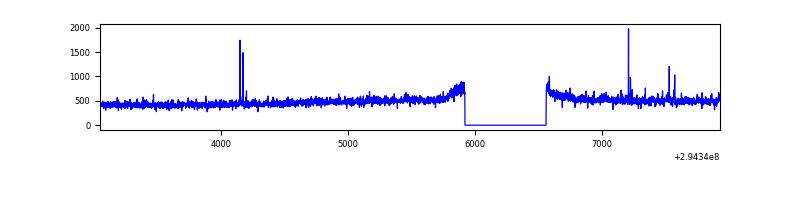 |
| C | 4888 | 4248 | 23 | 23 | 0.47% | 0.54% | 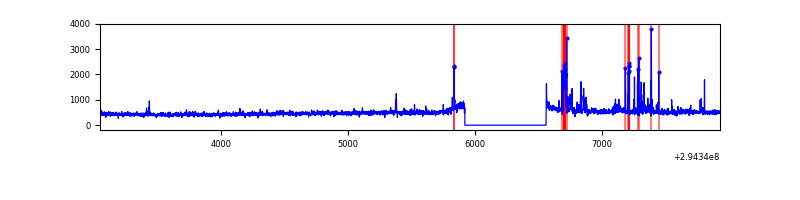 |
| D | 4887 | 4247 | 3141 | 3141 | 64.27% | 73.96% | 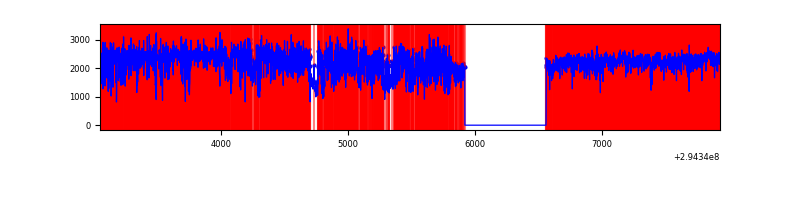 |
Top three noisy pixels from each quadrant. If the there are fewer than three noisy pixels in the level2.evt file, extra rows are filled as -1
| Pixel properties | Quadrant properties | ||||||
|---|---|---|---|---|---|---|---|
| Quadrant | DetID | PixID | Counts | Sigma | Mean | Median | Sigma |
| A | 4 | 2 | 175015 | 1642.1 | 522 | 510 | 106.3 |
| A | 13 | 254 | 6692 | 58.17 | 522 | 510 | 106.3 |
| A | 0 | 226 | 4603 | 38.52 | 522 | 510 | 106.3 |
| B | 0 | 198 | 12343 | 116.84 | 521 | 509 | 101.3 |
| B | 12 | 111 | 11907 | 112.53 | 521 | 509 | 101.3 |
| B | 11 | 111 | 10301 | 96.68 | 521 | 509 | 101.3 |
| C | 0 | 207 | 112003 | 944.32 | 498 | 500 | 118.1 |
| C | 14 | 238 | 78623 | 661.62 | 498 | 500 | 118.1 |
| C | 3 | 233 | 44143 | 369.61 | 498 | 500 | 118.1 |
| D | 10 | 66 | 5509605 | 68741.7 | 324 | 314 | 80.1 |
| D | 7 | 238 | 2419024 | 30179.25 | 324 | 314 | 80.1 |
| D | 12 | 110 | 36076 | 446.22 | 324 | 314 | 80.1 |
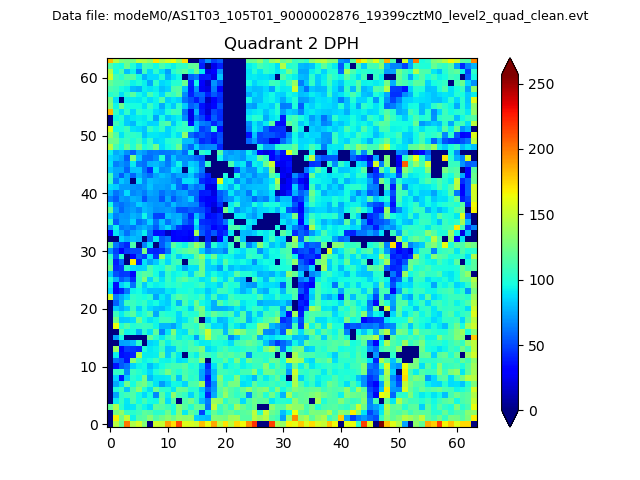
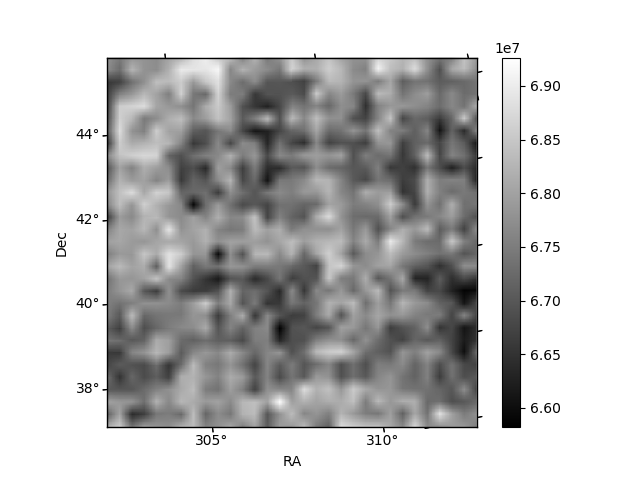
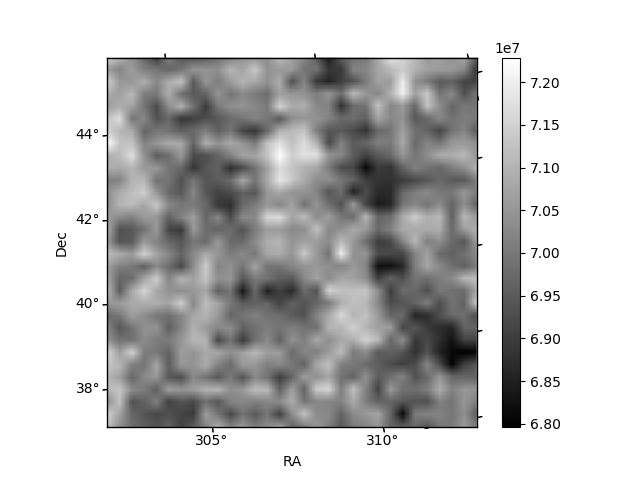
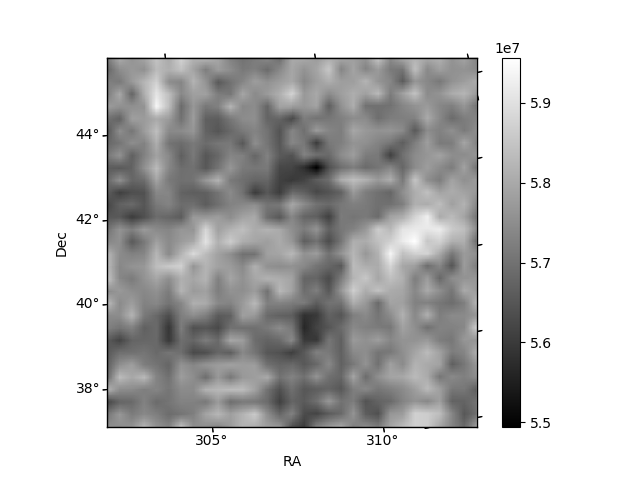
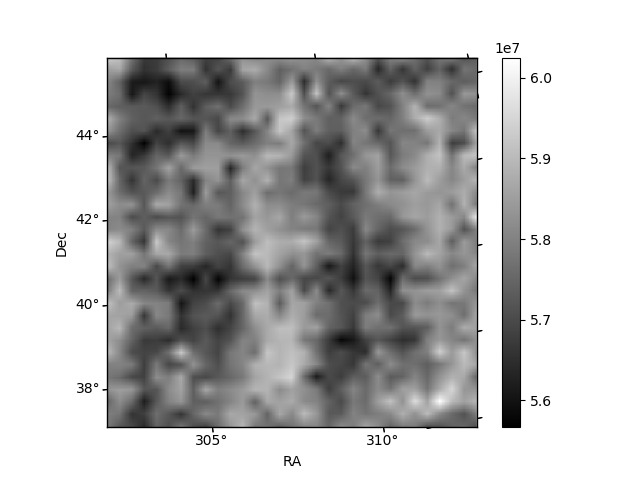
Histogram calculated using DETX and DETY for each event in the final _common_clean file
| Quadrant A | 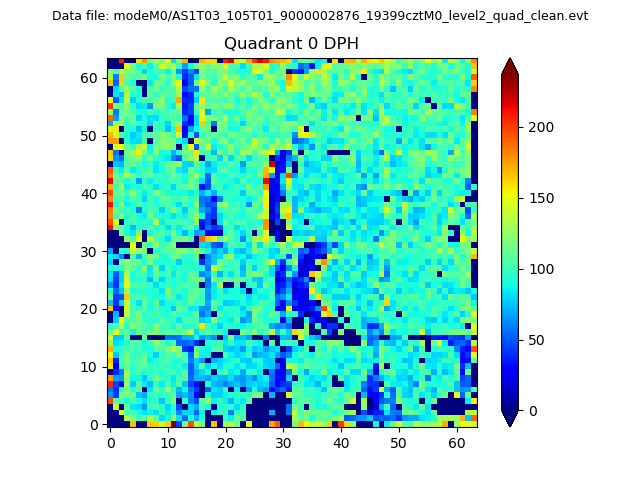 |
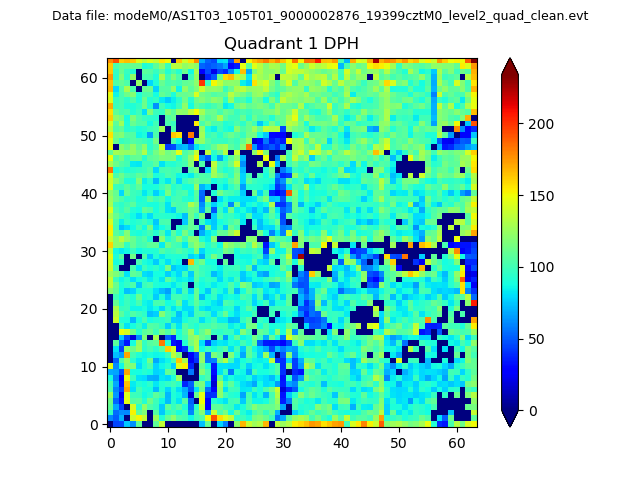 |
Quadrant B |
|---|---|---|---|
| Quadrant D | 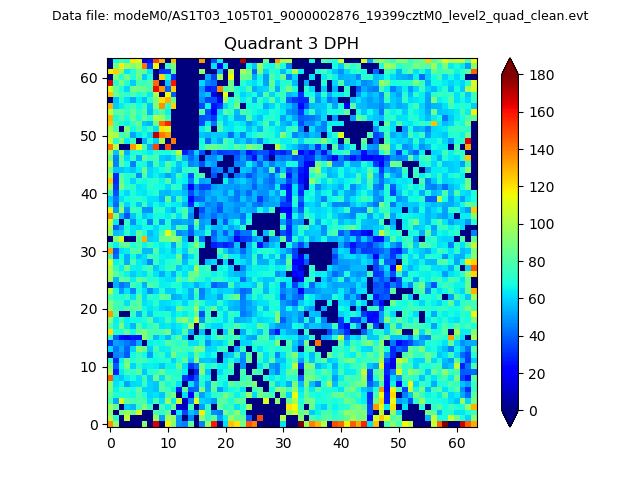 |
 |
Quadrant C |
| Plot type | Count rate plots | Images |
|---|---|---|
| Comparison with Poisson distribution Blue bars denote a histogram of data divided into 1 sec bins. Red curve is a Poisson curve with rate = median count rate of data. |
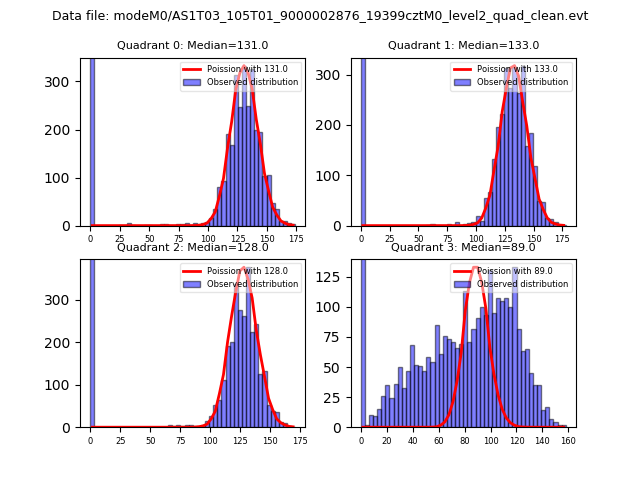 |
 |
| Quadrant-wise count rates Data is divided into 100 sec bins |
 |
|
| Module-wise count rates for Quadrant A Data is divided into 100 sec bins |
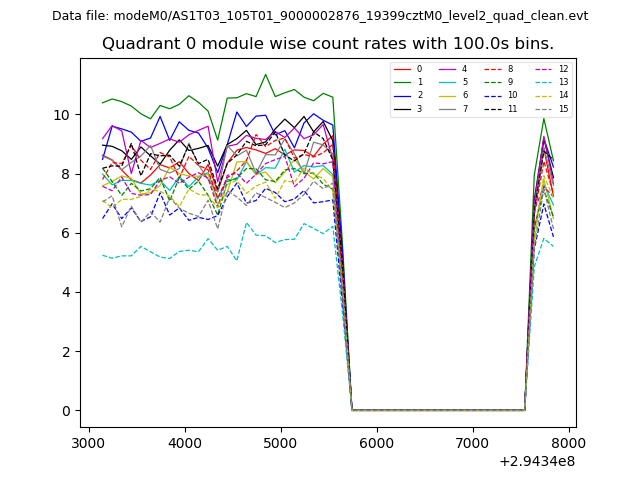 |
 |
| Module-wise count rates for Quadrant B Data is divided into 100 sec bins |
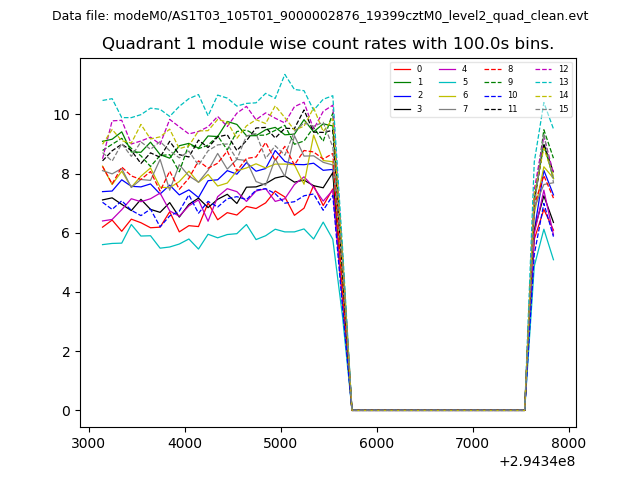 |
 |
| Module-wise count rates for Quadrant C Data is divided into 100 sec bins |
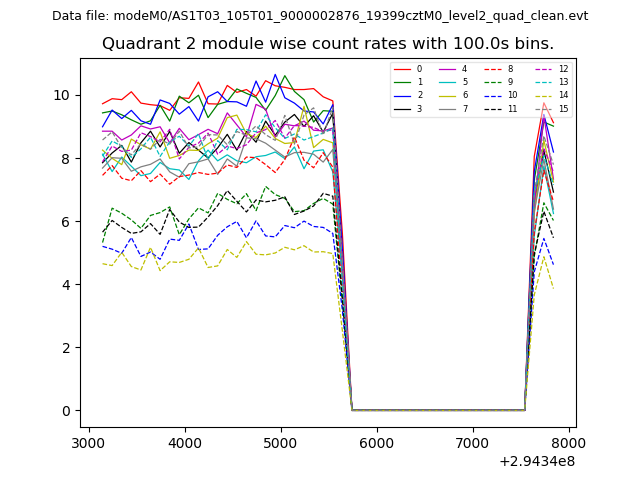 |
 |
| Module-wise count rates for Quadrant D Data is divided into 100 sec bins |
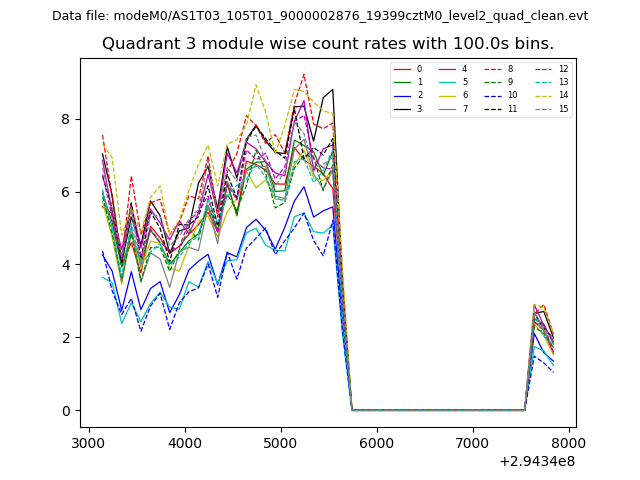 |
 |
| Parameter | Plot |
|---|---|
| CZT HV Monitor | 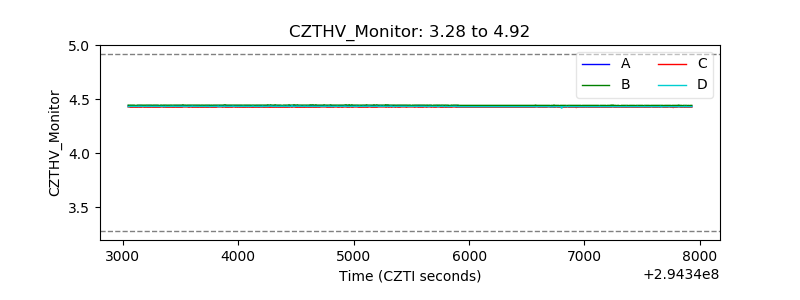 |
| D_VDD | 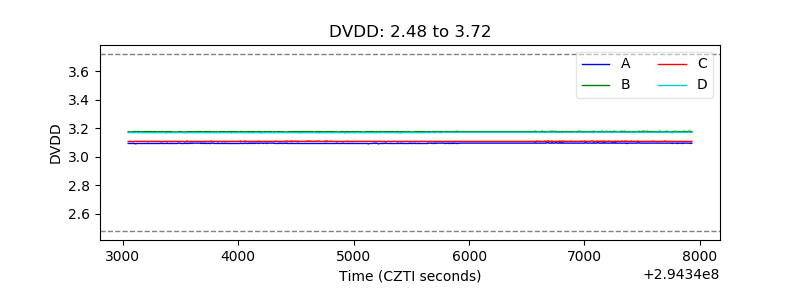 |
| Temperature 1 | 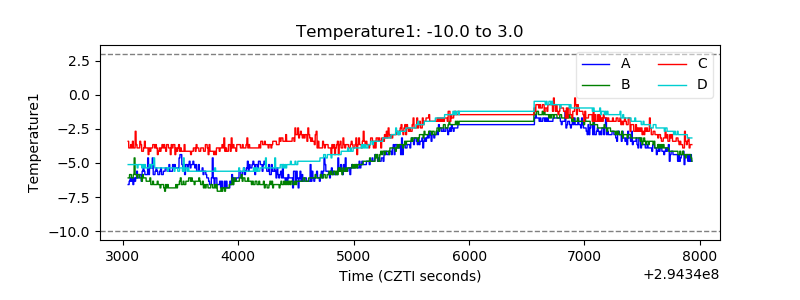 |
| Veto HV Monitor | 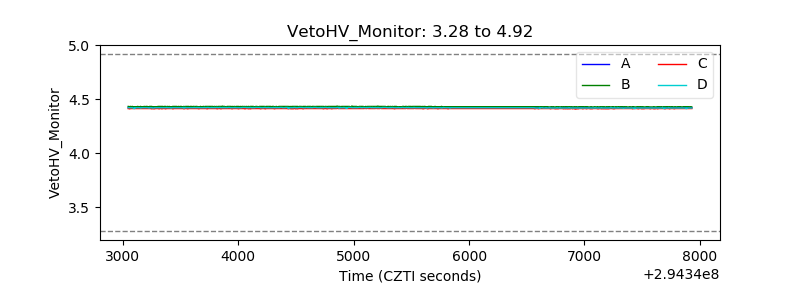 |
| Veto LLD | 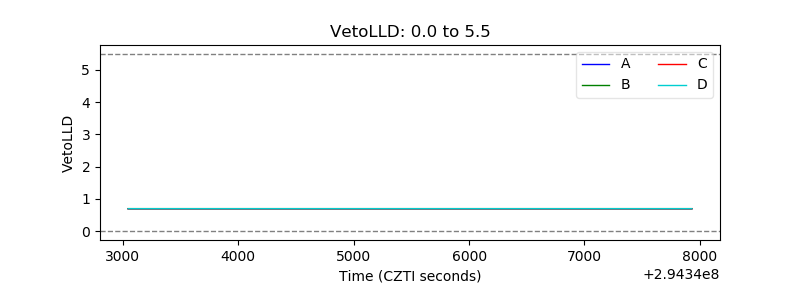 |
| Alpha Counter | 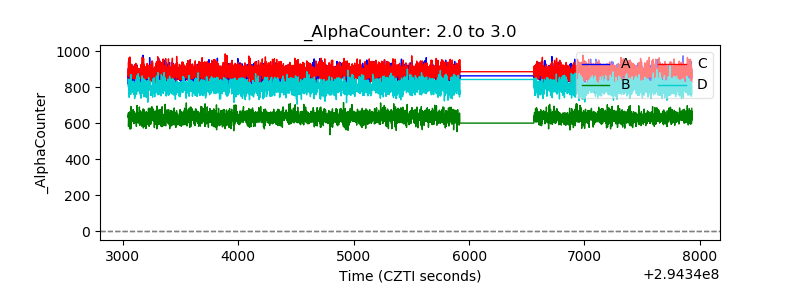 |
| _CPM_Rate | 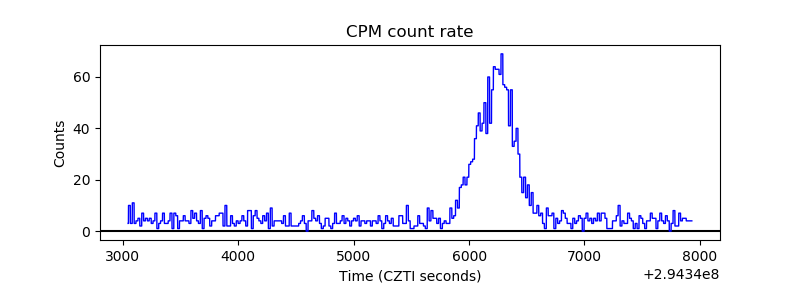 |
| CZT Counter |  |
| +2.5 Volts monitor |  |
| +5 Volts monitor |  |
| _ROLL_ROT | 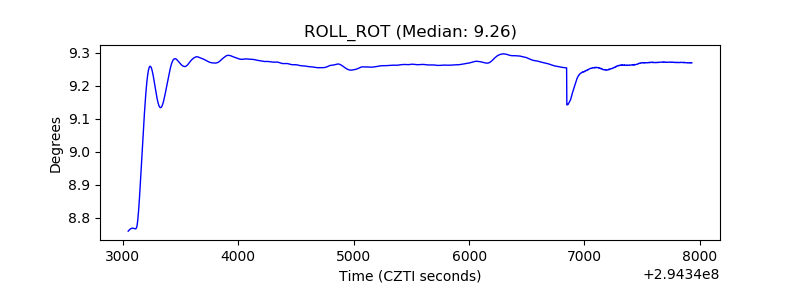 |
| _Roll_DEC | 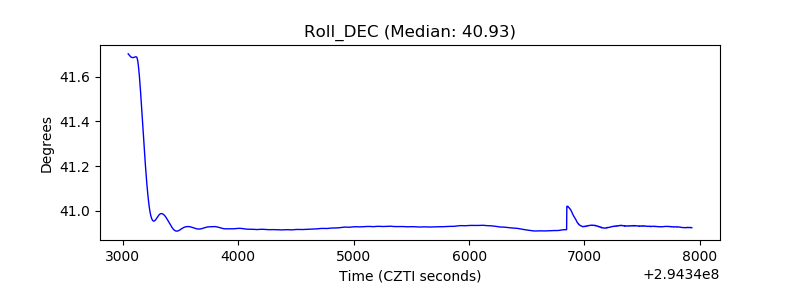 |
| _Roll_RA |  |
| Veto Counter | 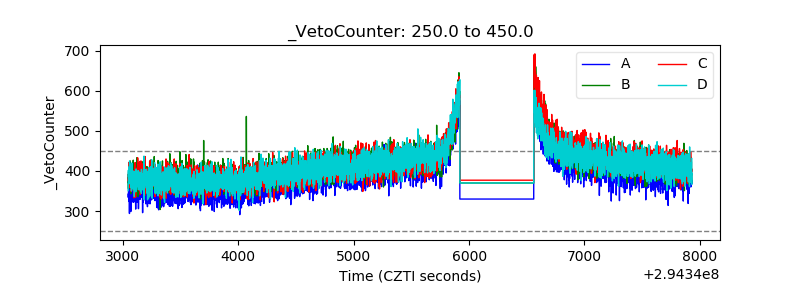 |