| Param | Original file | Final file |
|---|---|---|
| Filename | modeM0/AS1T03_105T01_9000002876_19400cztM0_level2.evt | modeM0/AS1T03_105T01_9000002876_19400cztM0_level2_quad_clean.evt |
| Size (bytes) | 921,127,680 | 85,959,360 |
| Size | 878.5 MB | 82.0 MB |
| Events in quadrant A | 3,632,508 | 586,826 |
| Events in quadrant B | 3,800,086 | 587,169 |
| Events in quadrant C | 3,773,563 | 574,312 |
| Events in quadrant D | 16,185,051 | 333,904 |
| Mode M0 | |||
|---|---|---|---|
| Quadrant | BADHDUFLAG | Total packets | Discarded packets |
| A | 0 | 15669 | 2 |
| B | 0 | 16098 | 2 |
| C | 0 | 16058 | 2 |
| D | 0 | 53132 | 2 |
| Mode SS | |||
|---|---|---|---|
| Quadrant | BADHDUFLAG | Total packets | Discarded packets |
| A | 0 | 152 | 0 |
| B | 0 | 152 | 0 |
| C | 0 | 152 | 0 |
| D | 0 | 152 | 0 |
| Mode M9 | |||
|---|---|---|---|
| Quadrant | BADHDUFLAG | Total packets | Discarded packets |
| A | 0 | 3 | 0 |
| B | 0 | 4 | 0 |
| C | 0 | 4 | 0 |
| D | 0 | 4 | 0 |
| Quadrant | Total seconds | Saturated seconds | Saturation percentage |
|---|---|---|---|
| A | 7456 | 83 | 1.113197% |
| B | 7456 | 111 | 1.488734% |
| C | 7456 | 187 | 2.508047% |
| D | 7456 | 6421 | 86.118562% |
Noise dominated data is calculated using 1-second bins in cleaned event files. If a bin has >2000 counts, and if more than 50% of those come from <1% of pixels, then it is considered to be noise-dominated and hence unusable.
| Quadrant | # 1 sec bins | Bins with >0 counts | Bins with >2000 counts | High rate bins dominated by noise | Noise dominated (total time) | Noise dominated (detector-on time) | Marked lightcurve |
|---|---|---|---|---|---|---|---|
| A | 7716 | 7457 | 21 | 21 | 0.27% | 0.28% | 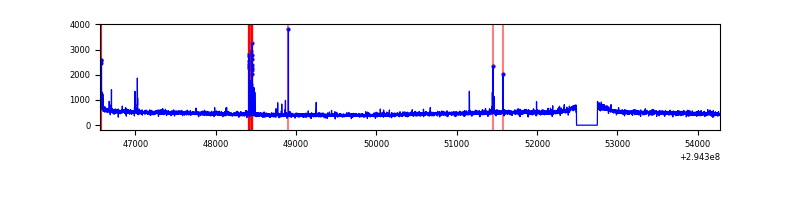 |
| B | 7716 | 7457 | 12 | 12 | 0.16% | 0.16% | 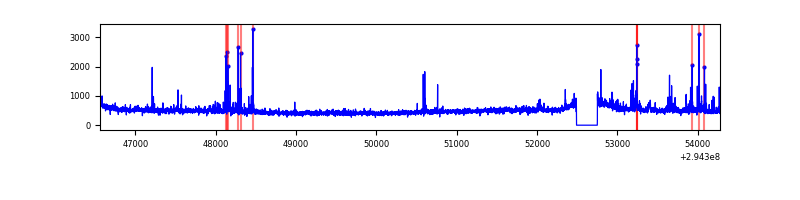 |
| C | 7716 | 7457 | 24 | 24 | 0.31% | 0.32% | 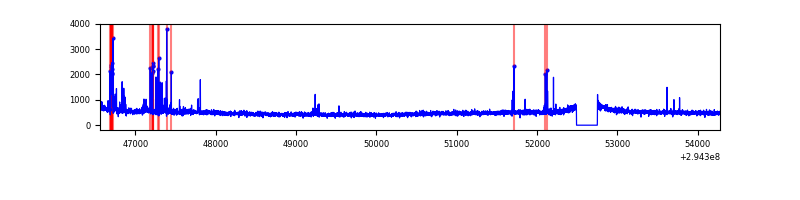 |
| D | 7715 | 7455 | 5607 | 5607 | 72.68% | 75.21% | 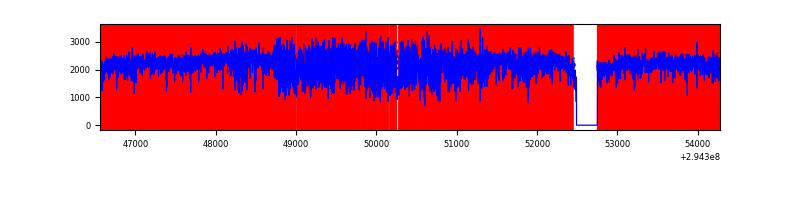 |
Top three noisy pixels from each quadrant. If the there are fewer than three noisy pixels in the level2.evt file, extra rows are filled as -1
| Pixel properties | Quadrant properties | ||||||
|---|---|---|---|---|---|---|---|
| Quadrant | DetID | PixID | Counts | Sigma | Mean | Median | Sigma |
| A | 15 | 174 | 57456 | 304.29 | 912 | 893 | 185.9 |
| A | 4 | 2 | 20936 | 107.83 | 912 | 893 | 185.9 |
| A | 12 | 96 | 20835 | 107.28 | 912 | 893 | 185.9 |
| B | 0 | 197 | 92392 | 528.62 | 911 | 885 | 173.1 |
| B | 4 | 216 | 62186 | 354.13 | 911 | 885 | 173.1 |
| B | 12 | 111 | 20409 | 112.79 | 911 | 885 | 173.1 |
| C | 14 | 238 | 137782 | 665.94 | 875 | 880 | 205.6 |
| C | 0 | 207 | 129132 | 623.87 | 875 | 880 | 205.6 |
| C | 3 | 233 | 67417 | 323.66 | 875 | 880 | 205.6 |
| D | 10 | 66 | 11714538 | 97914.41 | 491 | 476 | 119.6 |
| D | 7 | 238 | 2380566 | 19894.47 | 491 | 476 | 119.6 |
| D | 1 | 52 | 132490 | 1103.46 | 491 | 476 | 119.6 |
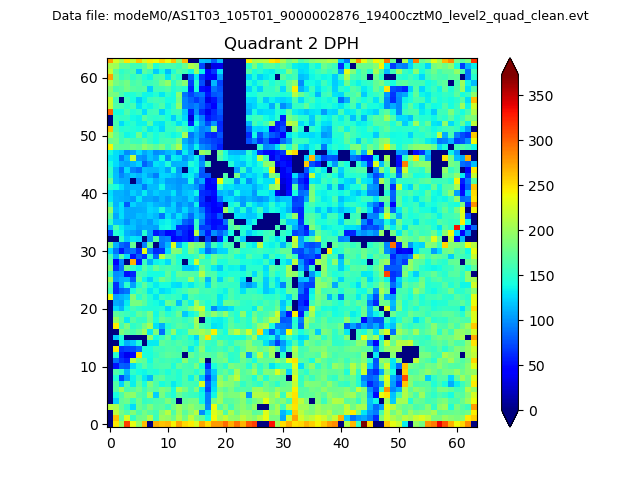
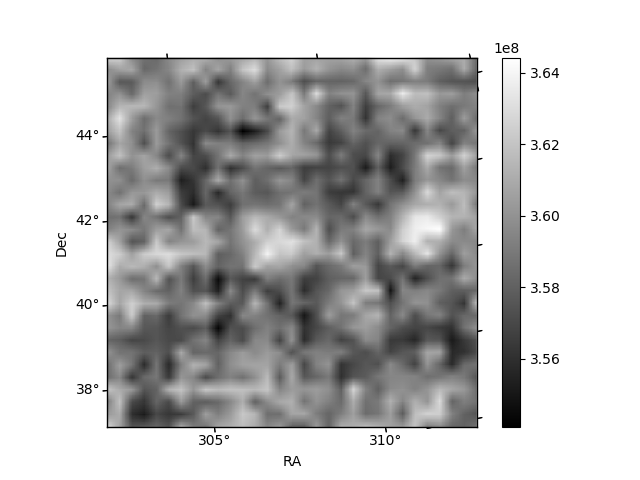
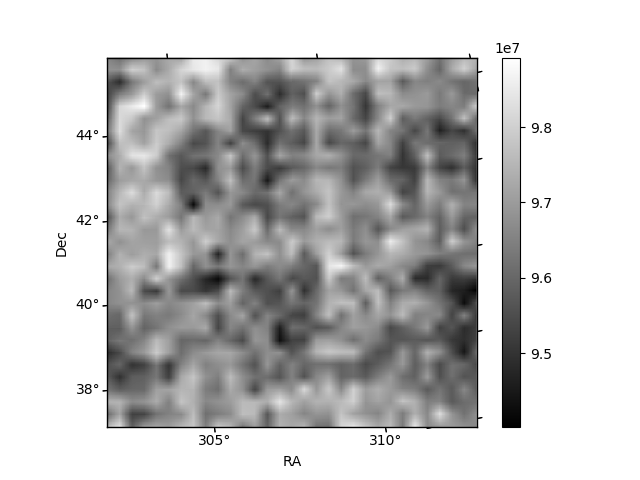
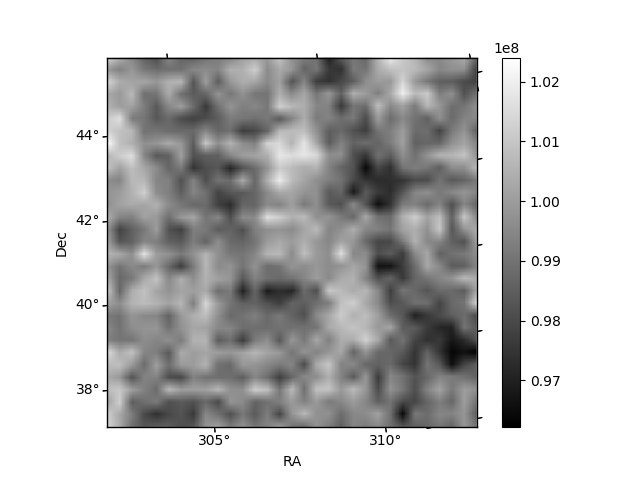
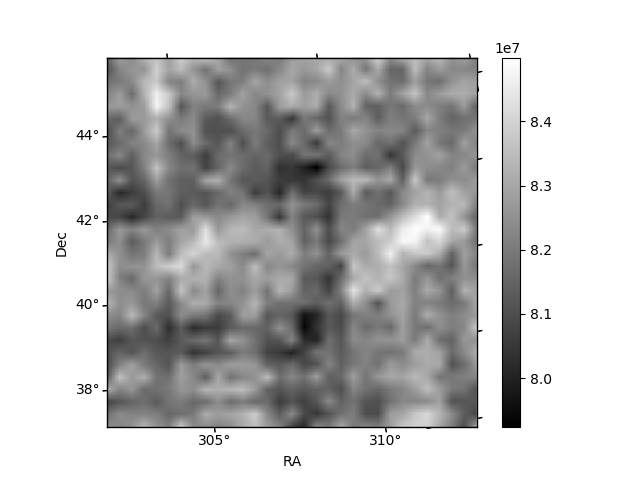
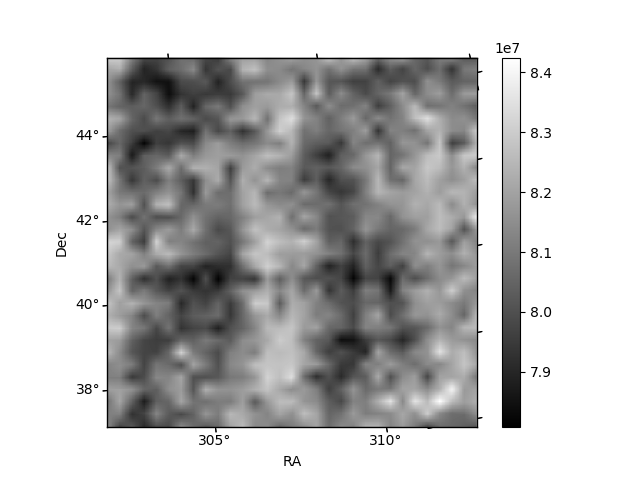
Histogram calculated using DETX and DETY for each event in the final _common_clean file
| Quadrant A | 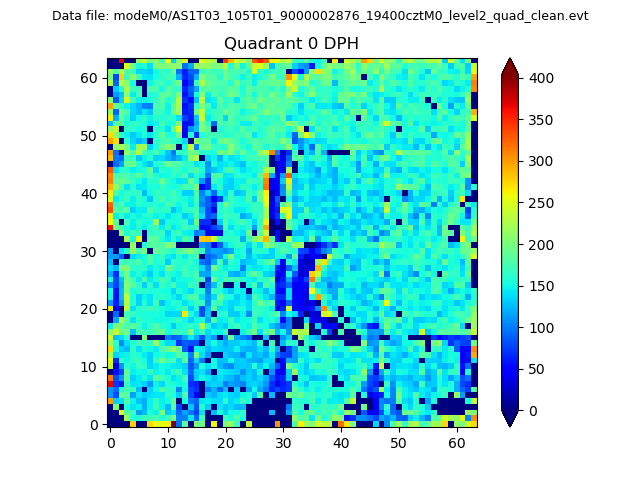 |
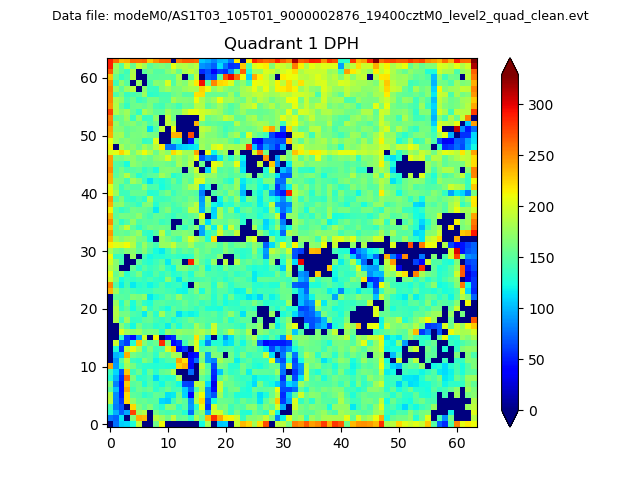 |
Quadrant B |
|---|---|---|---|
| Quadrant D | 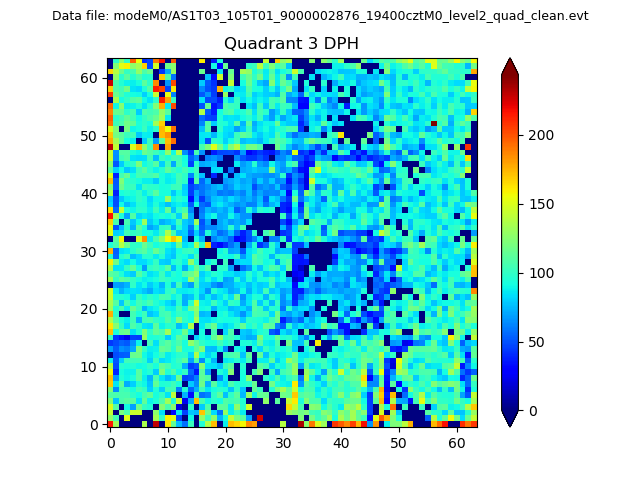 |
 |
Quadrant C |
| Plot type | Count rate plots | Images |
|---|---|---|
| Comparison with Poisson distribution Blue bars denote a histogram of data divided into 1 sec bins. Red curve is a Poisson curve with rate = median count rate of data. |
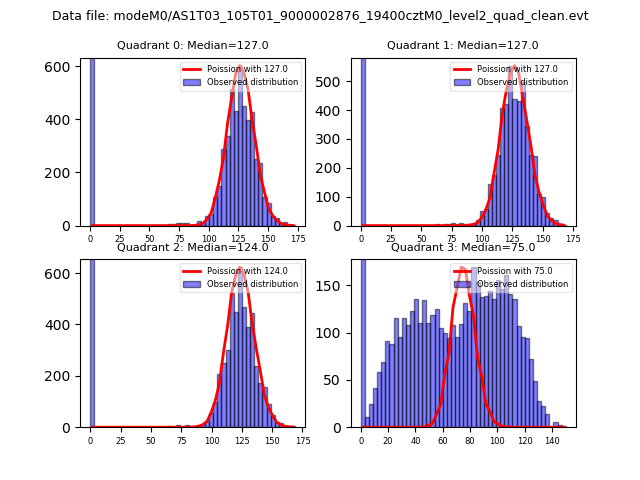 |
 |
| Quadrant-wise count rates Data is divided into 100 sec bins |
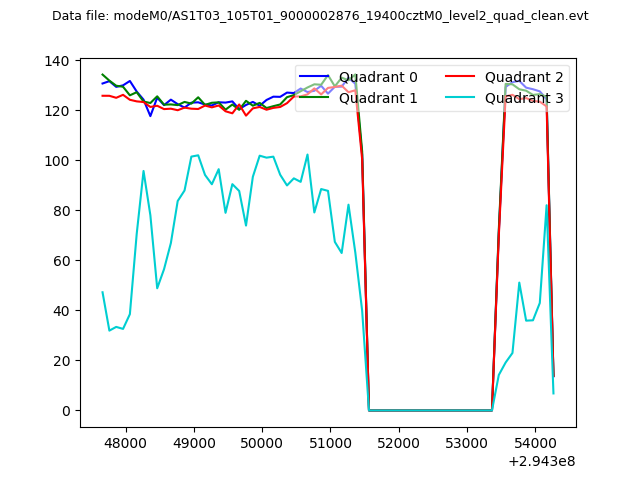 |
|
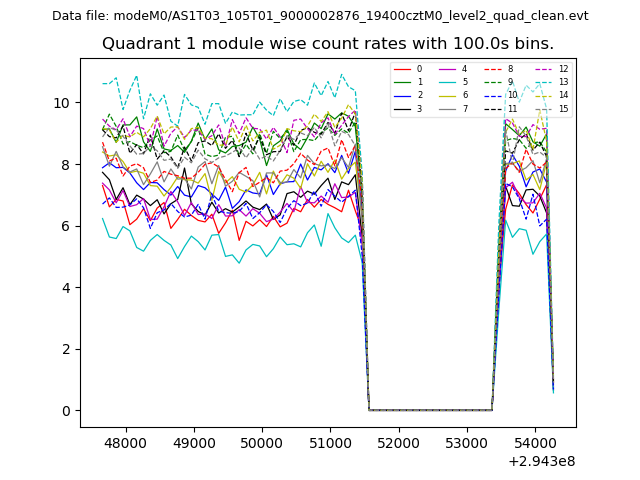
| Module-wise count rates for Quadrant A Data is divided into 100 sec bins |
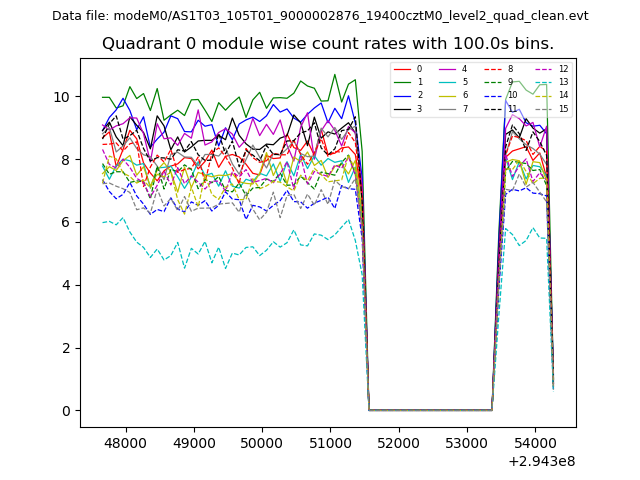 |
 |
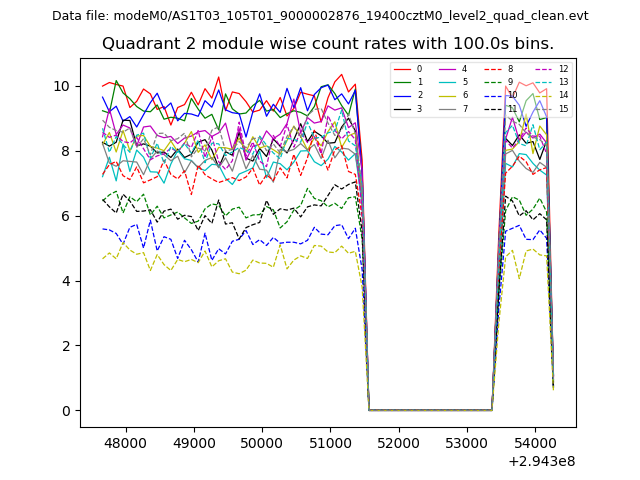
| Module-wise count rates for Quadrant B Data is divided into 100 sec bins |
 |
 |
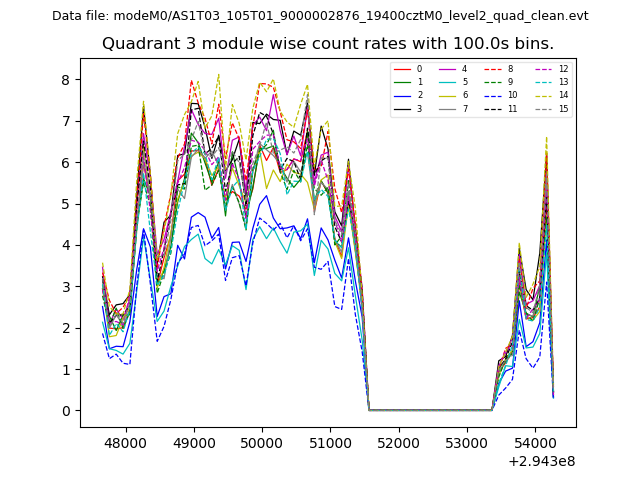
| Module-wise count rates for Quadrant C Data is divided into 100 sec bins |
 |
 |
| Module-wise count rates for Quadrant D Data is divided into 100 sec bins |
 |
 |
| Parameter | Plot |
|---|---|
| CZT HV Monitor | 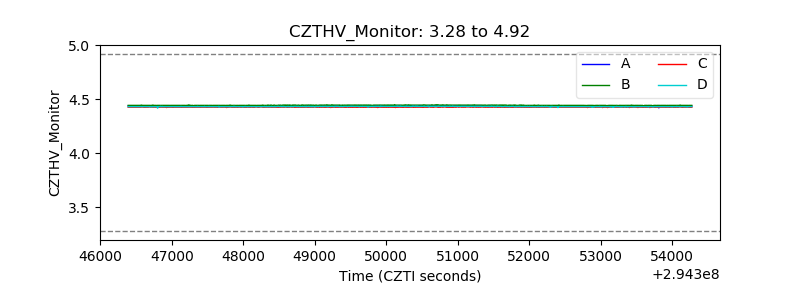 |
| D_VDD | 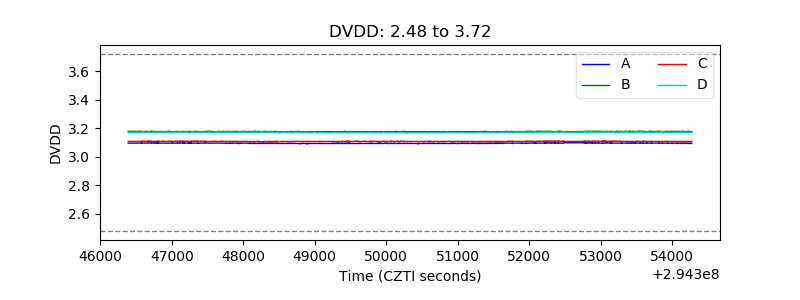 |
| Temperature 1 | 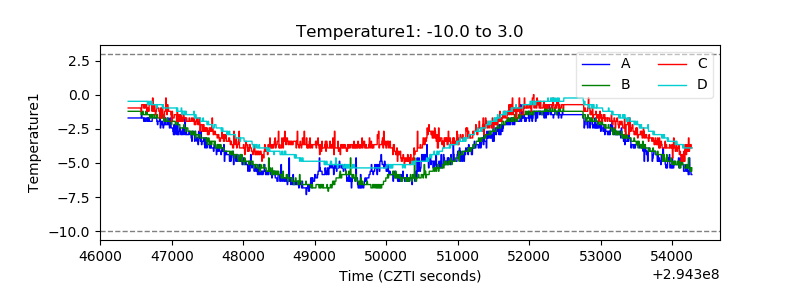 |
| Veto HV Monitor | 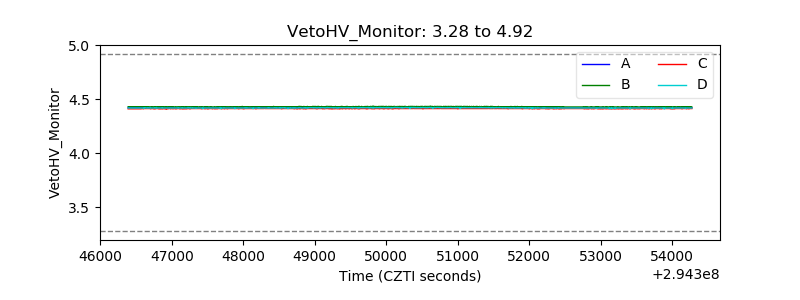 |
| Veto LLD | 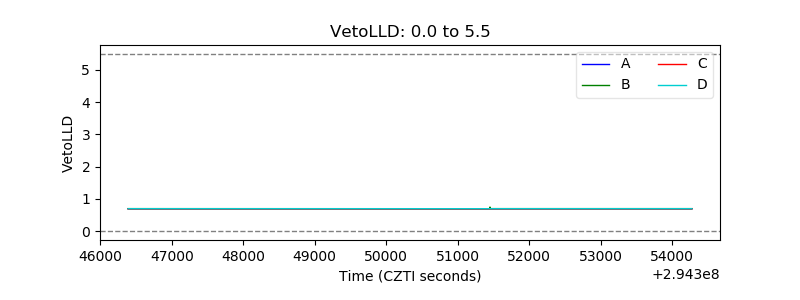 |
| Alpha Counter | 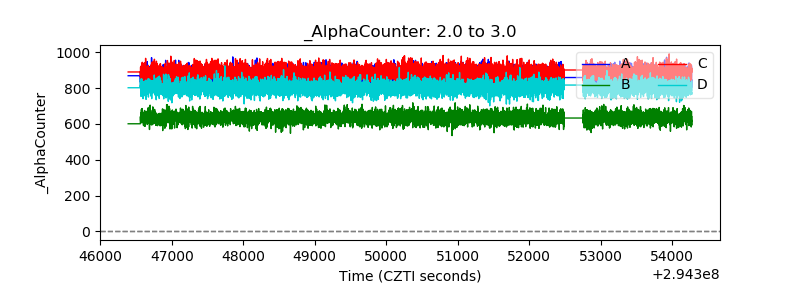 |
| _CPM_Rate | 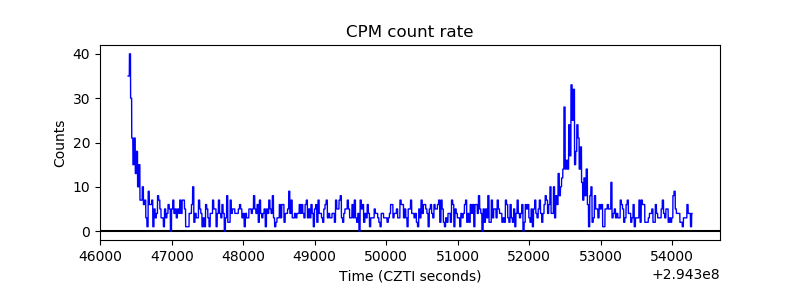 |
| CZT Counter | 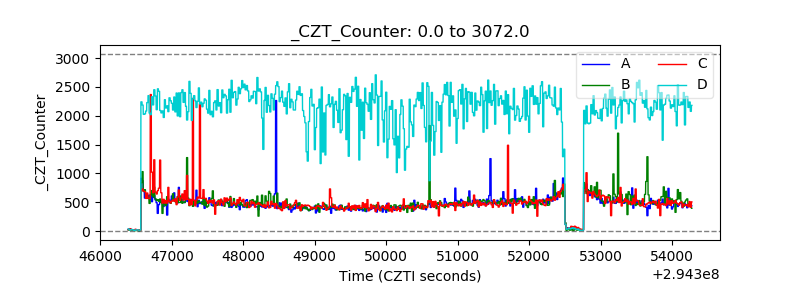 |
| +2.5 Volts monitor |  |
| +5 Volts monitor |  |
| _ROLL_ROT | 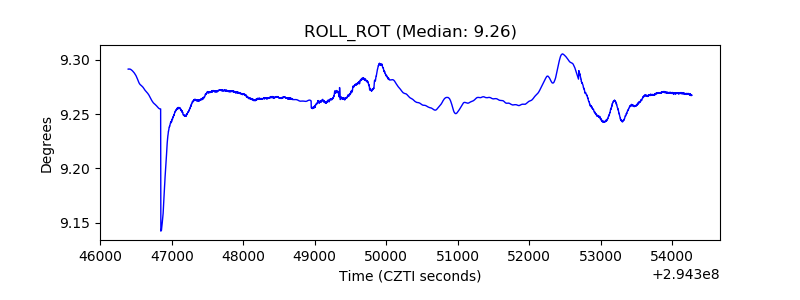 |
| _Roll_DEC | 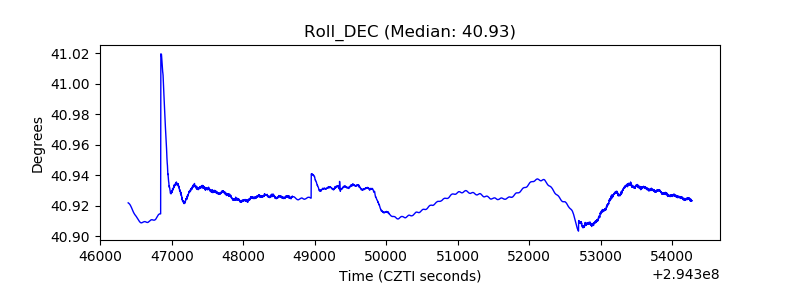 |
| _Roll_RA | 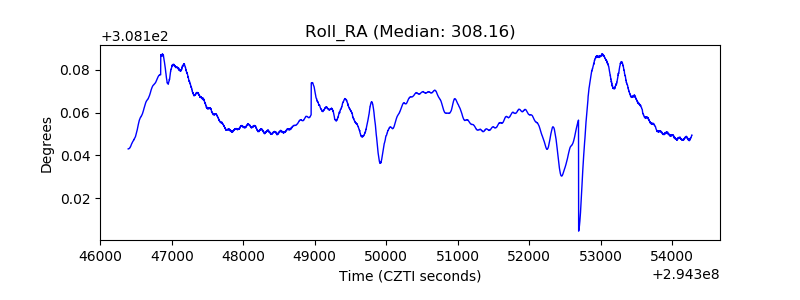 |
| Veto Counter | 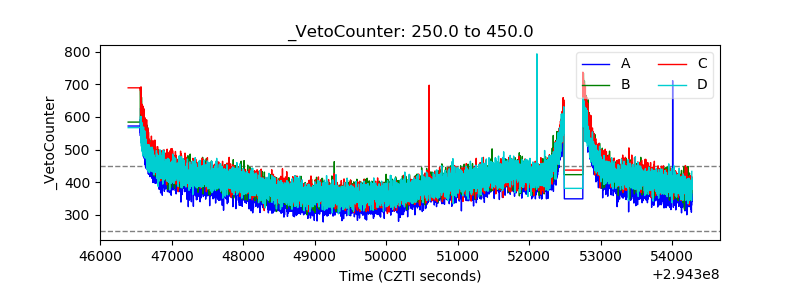 |