| Param | Original file | Final file |
|---|---|---|
| Filename | modeM0/AS1T03_105T01_9000002876_19401cztM0_level2.evt | modeM0/AS1T03_105T01_9000002876_19401cztM0_level2_quad_clean.evt |
| Size (bytes) | 854,712,000 | 97,672,320 |
| Size | 815.1 MB | 93.1 MB |
| Events in quadrant A | 3,712,385 | 648,707 |
| Events in quadrant B | 3,920,469 | 649,612 |
| Events in quadrant C | 3,678,542 | 635,776 |
| Events in quadrant D | 14,056,866 | 491,686 |
| Mode M0 | |||
|---|---|---|---|
| Quadrant | BADHDUFLAG | Total packets | Discarded packets |
| A | 0 | 16111 | 2 |
| B | 0 | 16697 | 2 |
| C | 0 | 15932 | 2 |
| D | 0 | 47010 | 2 |
| Mode SS | |||
|---|---|---|---|
| Quadrant | BADHDUFLAG | Total packets | Discarded packets |
| A | 0 | 158 | 0 |
| B | 0 | 158 | 0 |
| C | 0 | 158 | 0 |
| D | 0 | 158 | 0 |
| Mode M9 | |||
|---|---|---|---|
| Quadrant | BADHDUFLAG | Total packets | Discarded packets |
| A | 0 | 4 | 0 |
| B | 0 | 5 | 0 |
| C | 0 | 5 | 0 |
| D | 0 | 5 | 0 |
| Quadrant | Total seconds | Saturated seconds | Saturation percentage |
|---|---|---|---|
| A | 7631 | 73 | 0.956624% |
| B | 7631 | 127 | 1.664264% |
| C | 7631 | 128 | 1.677369% |
| D | 7631 | 4603 | 60.319748% |
Noise dominated data is calculated using 1-second bins in cleaned event files. If a bin has >2000 counts, and if more than 50% of those come from <1% of pixels, then it is considered to be noise-dominated and hence unusable.
| Quadrant | # 1 sec bins | Bins with >0 counts | Bins with >2000 counts | High rate bins dominated by noise | Noise dominated (total time) | Noise dominated (detector-on time) | Marked lightcurve |
|---|---|---|---|---|---|---|---|
| A | 7951 | 7632 | 17 | 17 | 0.21% | 0.22% | 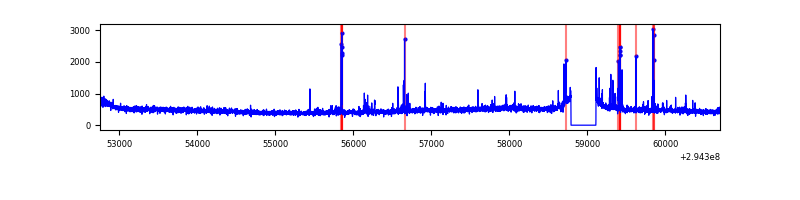 |
| B | 7951 | 7631 | 37 | 37 | 0.47% | 0.48% | 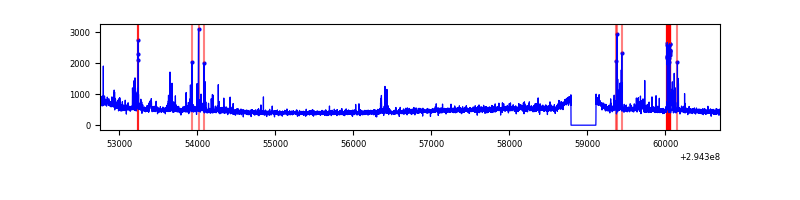 |
| C | 7951 | 7631 | 2 | 2 | 0.03% | 0.03% | 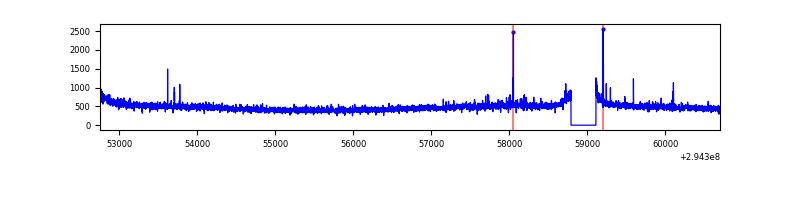 |
| D | 7951 | 7631 | 3803 | 3803 | 47.83% | 49.84% | 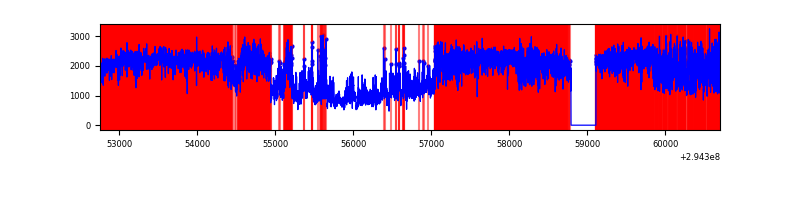 |
Top three noisy pixels from each quadrant. If the there are fewer than three noisy pixels in the level2.evt file, extra rows are filled as -1
| Pixel properties | Quadrant properties | ||||||
|---|---|---|---|---|---|---|---|
| Quadrant | DetID | PixID | Counts | Sigma | Mean | Median | Sigma |
| A | 5 | 16 | 135195 | 714.24 | 925 | 905 | 188.0 |
| A | 13 | 254 | 12297 | 60.59 | 925 | 905 | 188.0 |
| A | 0 | 226 | 7937 | 37.4 | 925 | 905 | 188.0 |
| B | 15 | 201 | 85871 | 482.61 | 921 | 897 | 176.1 |
| B | 0 | 197 | 76402 | 428.83 | 921 | 897 | 176.1 |
| B | 4 | 216 | 57607 | 322.08 | 921 | 897 | 176.1 |
| C | 14 | 238 | 139504 | 660.57 | 892 | 896 | 209.8 |
| C | 3 | 233 | 27094 | 124.85 | 892 | 896 | 209.8 |
| C | 0 | 207 | 24468 | 112.34 | 892 | 896 | 209.8 |
| D | 10 | 66 | 10963660 | 69674.09 | 645 | 627 | 157.3 |
| D | 1 | 52 | 430524 | 2732.15 | 645 | 627 | 157.3 |
| D | 7 | 238 | 73198 | 461.22 | 645 | 627 | 157.3 |
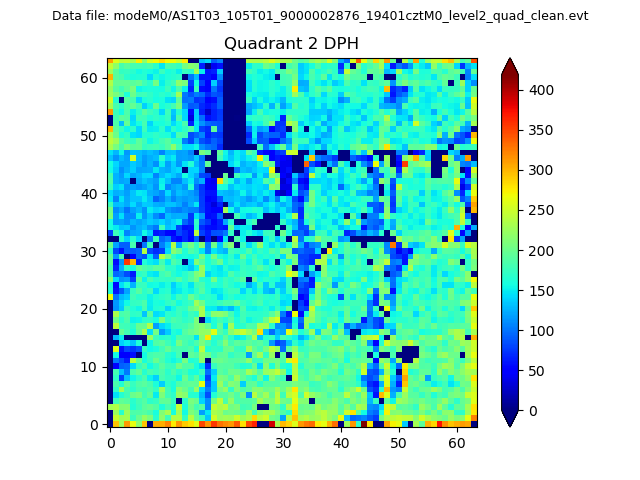
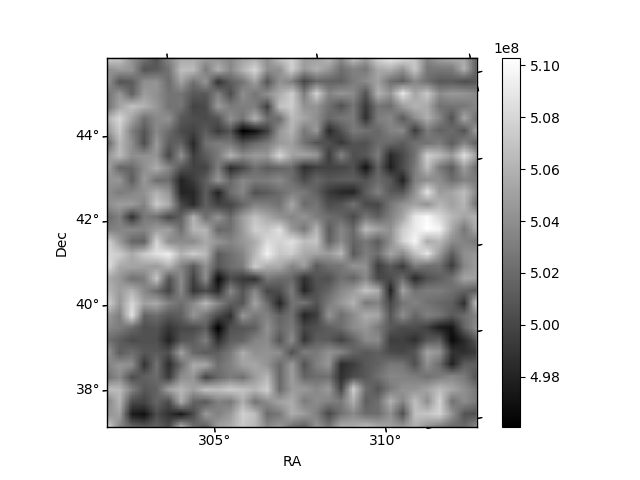
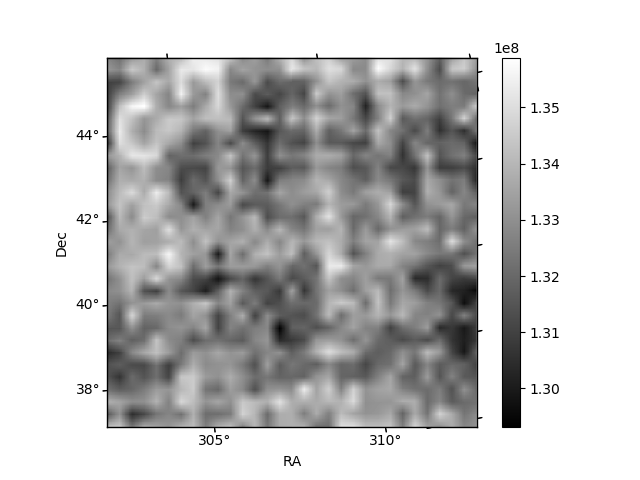
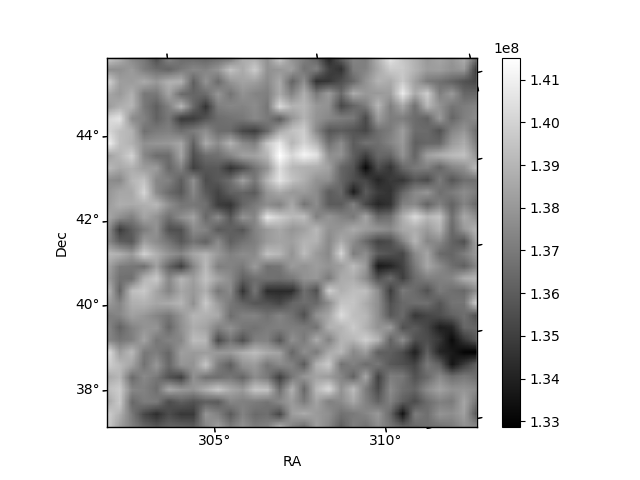
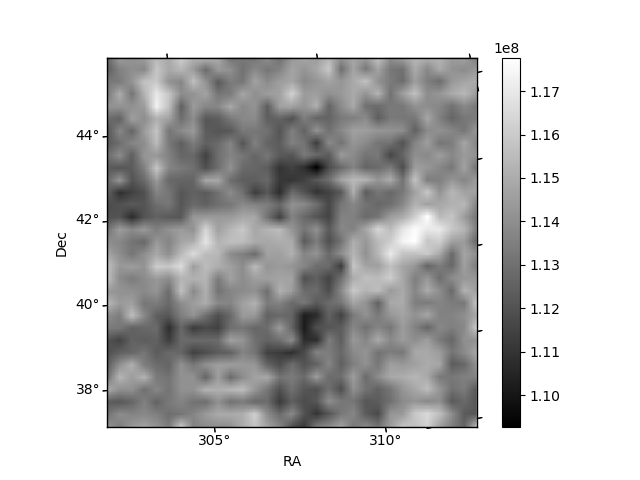
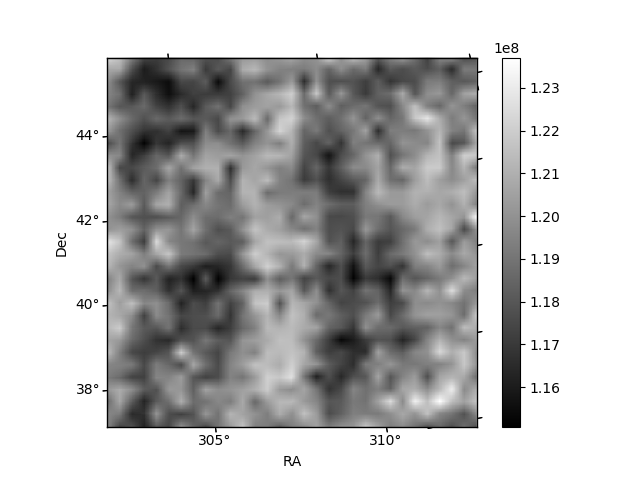
Histogram calculated using DETX and DETY for each event in the final _common_clean file
| Quadrant A | 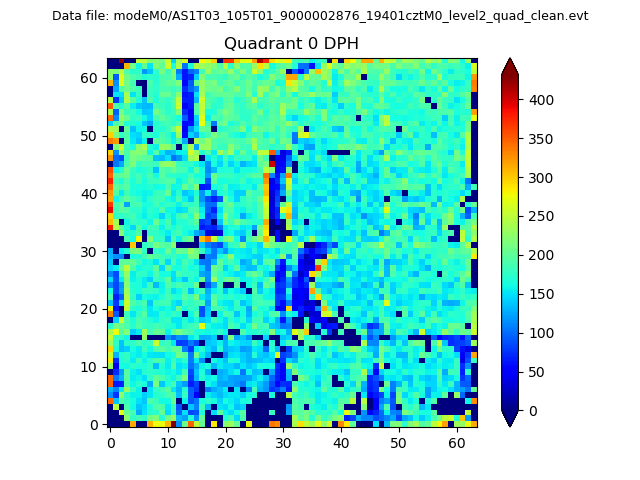 |
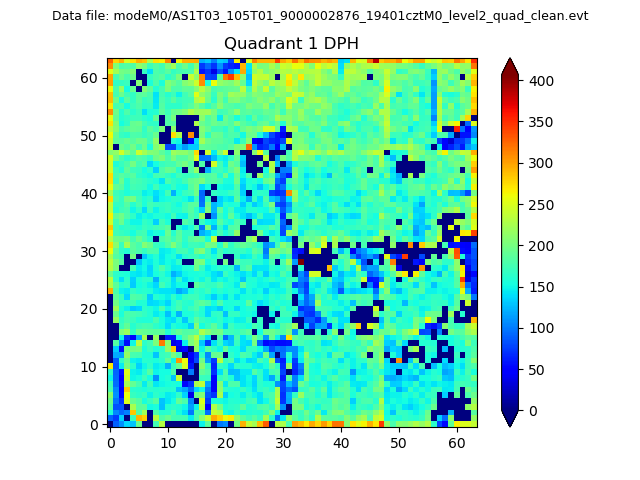 |
Quadrant B |
|---|---|---|---|
| Quadrant D | 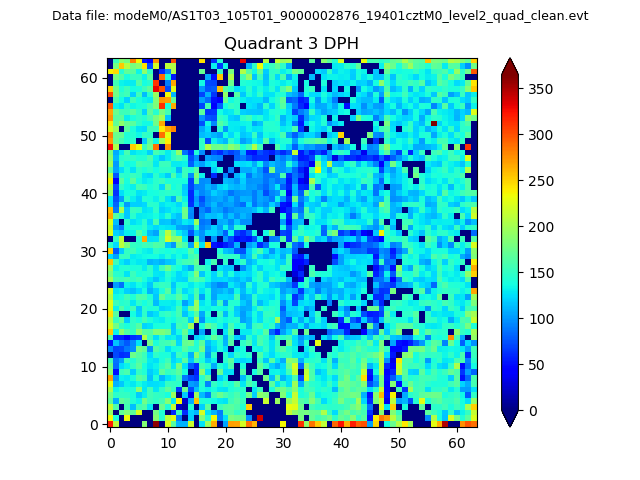 |
 |
Quadrant C |
| Plot type | Count rate plots | Images |
|---|---|---|
| Comparison with Poisson distribution Blue bars denote a histogram of data divided into 1 sec bins. Red curve is a Poisson curve with rate = median count rate of data. |
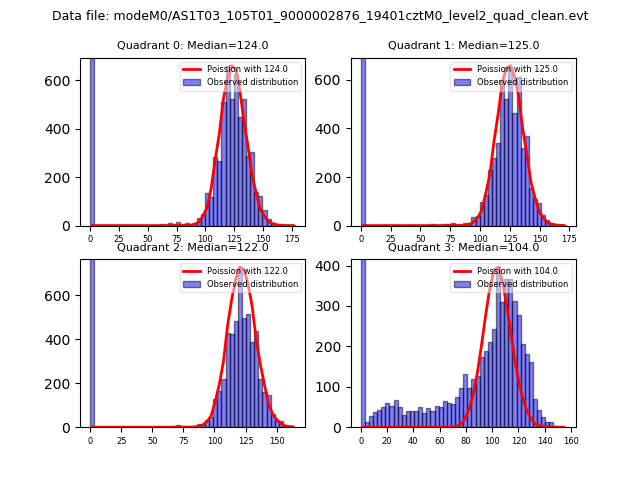 |
 |
| Quadrant-wise count rates Data is divided into 100 sec bins |
 |
|
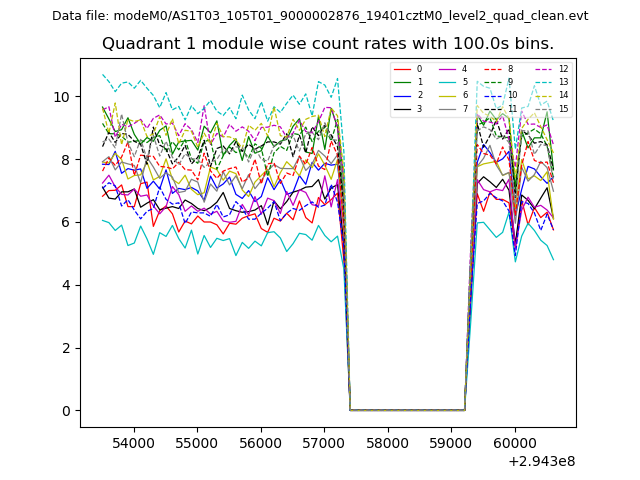
| Module-wise count rates for Quadrant A Data is divided into 100 sec bins |
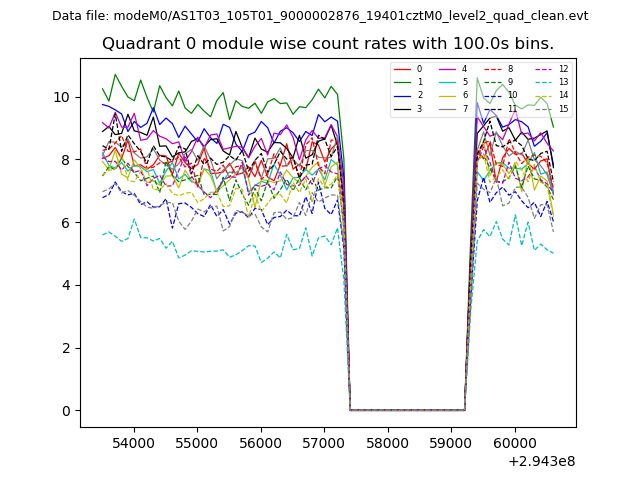 |
 |
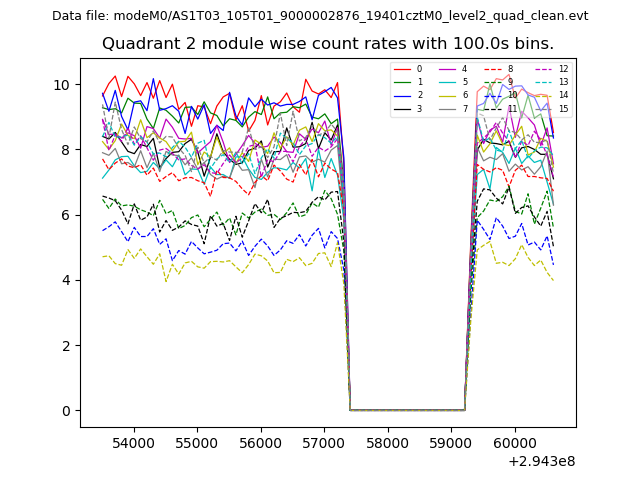
| Module-wise count rates for Quadrant B Data is divided into 100 sec bins |
 |
 |
| Module-wise count rates for Quadrant C Data is divided into 100 sec bins |
 |
 |
| Module-wise count rates for Quadrant D Data is divided into 100 sec bins |
 |
 |
| Parameter | Plot |
|---|---|
| CZT HV Monitor | 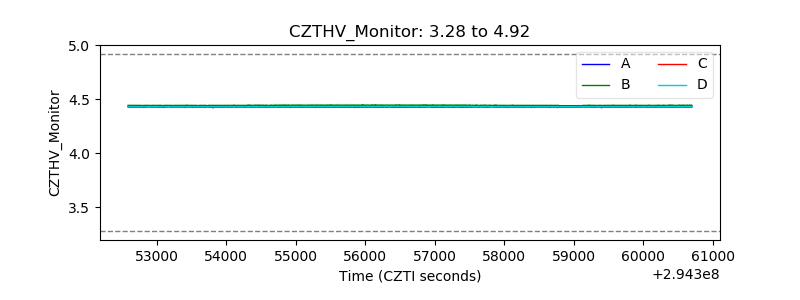 |
| D_VDD | 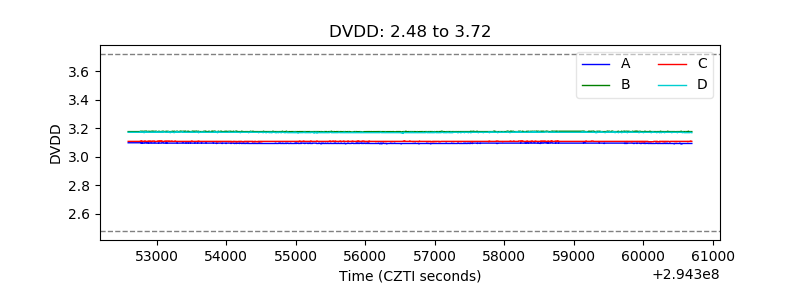 |
| Temperature 1 | 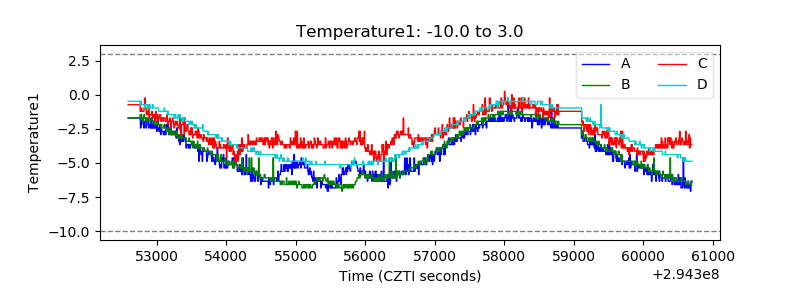 |
| Veto HV Monitor | 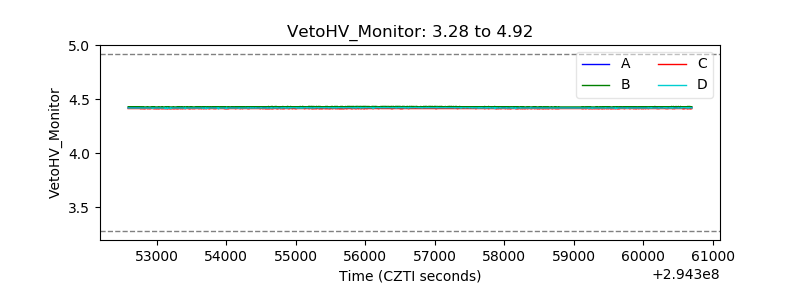 |
| Veto LLD | 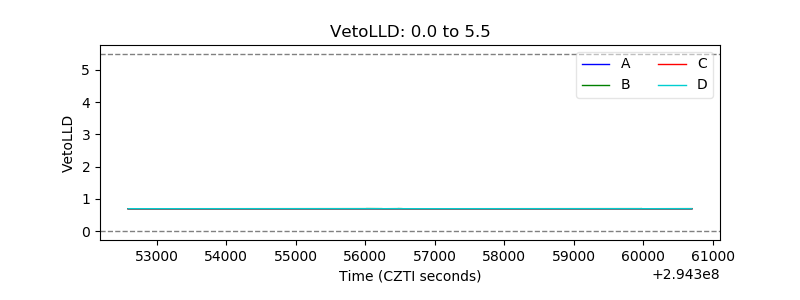 |
| Alpha Counter | 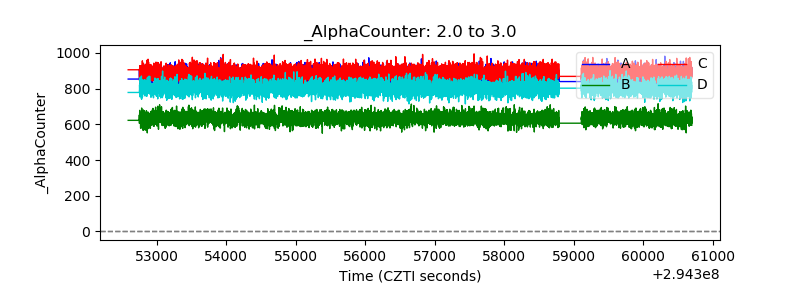 |
| _CPM_Rate | 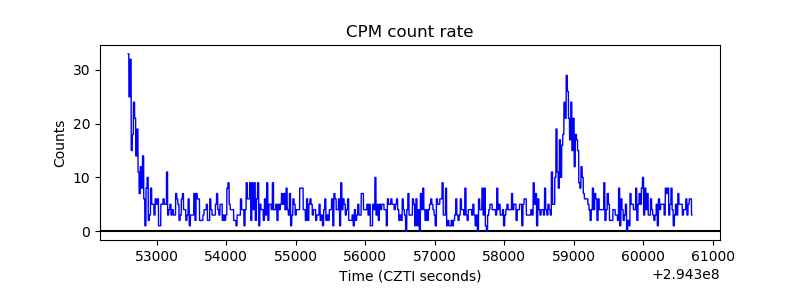 |
| CZT Counter | 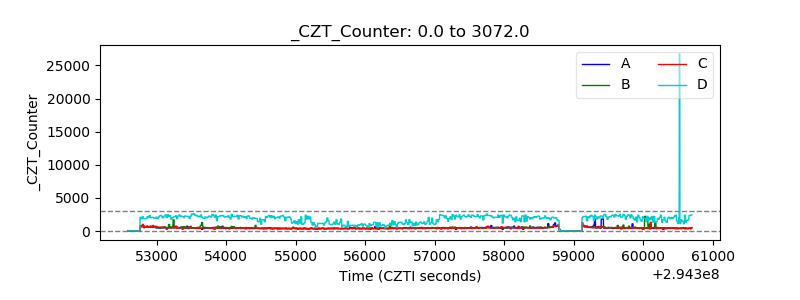 |
| +2.5 Volts monitor |  |
| +5 Volts monitor |  |
| _ROLL_ROT |  |
| _Roll_DEC | 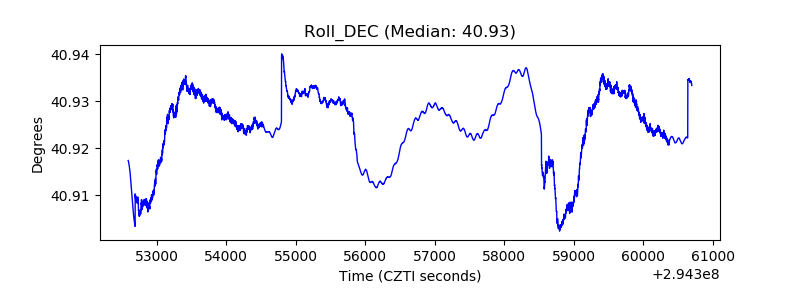 |
| _Roll_RA | 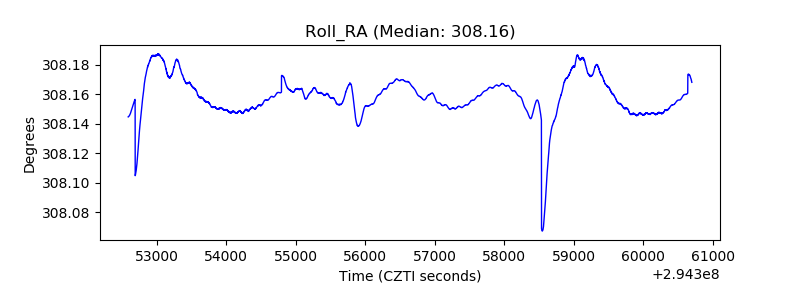 |
| Veto Counter |  |