| Param | Original file | Final file |
|---|---|---|
| Filename | modeM0/AS1A05_104T06_9000002878cztM0_level2.fits | modeM0/AS1A05_104T06_9000002878cztM0_level2_quad_clean.evt |
| Size (bytes) | 122,368,320 | 100,126,080 |
| Size | 116.7 MB | 95.5 MB |
| Events in quadrant A | 780,446 | 603,124 |
| Events in quadrant B | 749,624 | 599,766 |
| Events in quadrant C | 756,563 | 563,638 |
| Events in quadrant D | 511,708 | 359,561 |
| Mode M9 | |||
|---|---|---|---|
| Quadrant | BADHDUFLAG | Total packets | Discarded packets |
| A | 0 | 19 | 0 |
| B | 0 | 19 | 0 |
| C | 0 | 19 | 0 |
| D | 0 | 20 | 0 |
| Mode SS | |||
|---|---|---|---|
| Quadrant | BADHDUFLAG | Total packets | Discarded packets |
| A | 0 | 276 | 0 |
| B | 0 | 274 | 0 |
| C | 0 | 280 | 0 |
| D | 0 | 269 | 0 |
| Mode M0 | |||
|---|---|---|---|
| Quadrant | BADHDUFLAG | Total packets | Discarded packets |
| A | 0 | 27469 | 0 |
| B | 0 | 28254 | 0 |
| C | 0 | 27024 | 0 |
| D | 0 | 63159 | 0 |
| Quadrant | Total seconds | Saturated seconds | Saturation percentage |
|---|---|---|---|
| A | 13079 | 167 | 1.276856% |
| B | 13102 | 169 | 1.289879% |
| C | 13065 | 172 | 1.316494% |
| D | 13052 | 5201 | 39.848299% |
Noise dominated data is calculated using 1-second bins in cleaned event files. If a bin has >2000 counts, and if more than 50% of those come from <1% of pixels, then it is considered to be noise-dominated and hence unusable.
| Quadrant | # 1 sec bins | Bins with >0 counts | Bins with >2000 counts | High rate bins dominated by noise | Noise dominated (total time) | Noise dominated (detector-on time) | Marked lightcurve |
|---|---|---|---|---|---|---|---|
| A | 15797 | 12339 | 0 | 0 | 0.00% | 0.00% |  |
| B | 15796 | 12348 | 0 | 0 | 0.00% | 0.00% |  |
| C | 15798 | 12317 | 0 | 0 | 0.00% | 0.00% |  |
| D | 15798 | 12181 | 0 | 0 | 0.00% | 0.00% |  |
Top three noisy pixels from each quadrant. If the there are fewer than three noisy pixels in the level2.evt file, extra rows are filled as -1
| Pixel properties | Quadrant properties | ||||||
|---|---|---|---|---|---|---|---|
| Quadrant | DetID | PixID | Counts | Sigma | Mean | Median | Sigma |
| A | 0 | 29 | 758 | 11.11 | 203 | 191 | 51.0 |
| A | 9 | 19 | 639 | 8.78 | 203 | 191 | 51.0 |
| A | 7 | 110 | 604 | 8.09 | 203 | 191 | 51.0 |
| B | 2 | 9 | 586 | 9.72 | 198 | 189 | 40.8 |
| B | 14 | 254 | 504 | 7.71 | 198 | 189 | 40.8 |
| B | 2 | 8 | 500 | 7.61 | 198 | 189 | 40.8 |
| C | 1 | 81 | 581 | 7.57 | 199 | 187 | 52.1 |
| C | 1 | 80 | 555 | 7.07 | 199 | 187 | 52.1 |
| C | 12 | 241 | 526 | 6.51 | 199 | 187 | 52.1 |
| D | 15 | 46 | 389 | 6.32 | 146 | 133 | 40.5 |
| D | 6 | 231 | 367 | 5.77 | 146 | 133 | 40.5 |
| D | 7 | 5 | 362 | 5.65 | 146 | 133 | 40.5 |
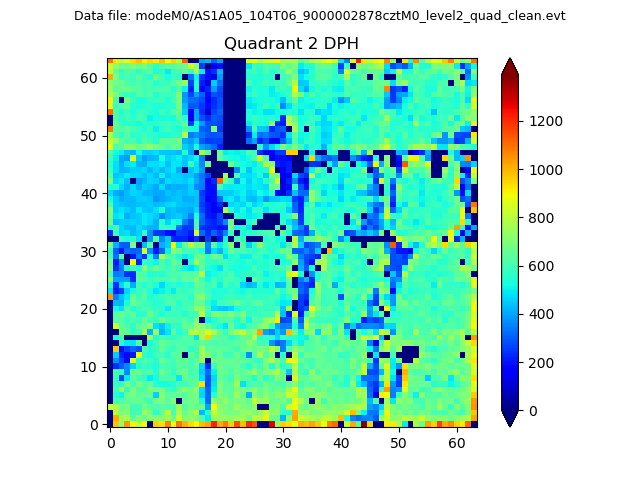
Histogram calculated using DETX and DETY for each event in the final _common_clean file
| Quadrant A | 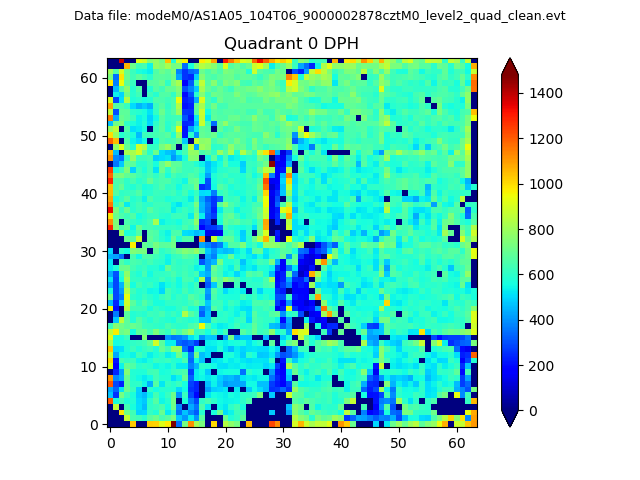 |
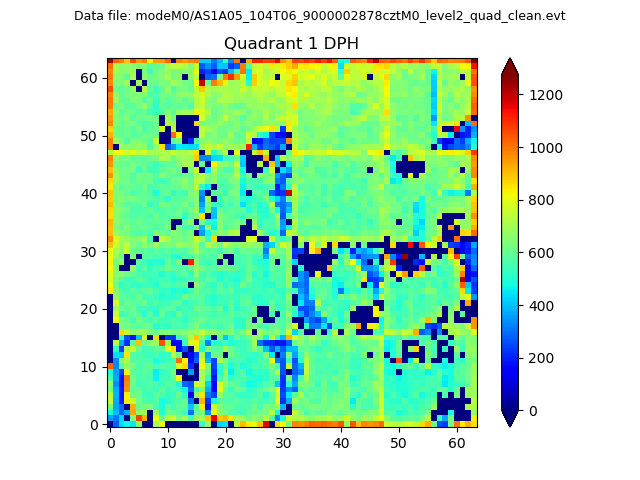 |
Quadrant B |
|---|---|---|---|
| Quadrant D | 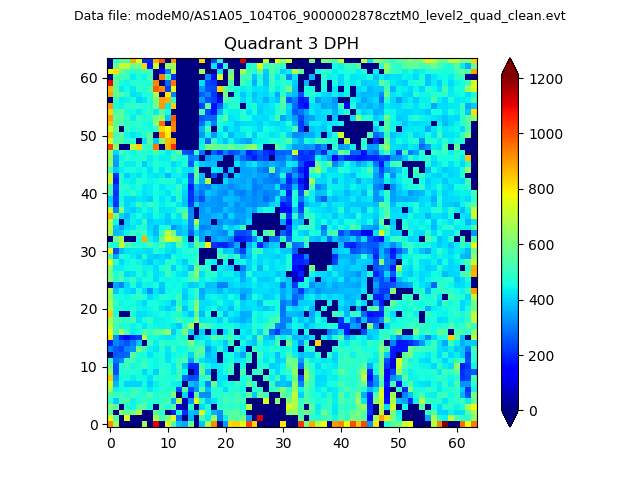 |
 |
Quadrant C |
| Plot type | Count rate plots | Images |
|---|---|---|
| Comparison with Poisson distribution Blue bars denote a histogram of data divided into 1 sec bins. Red curve is a Poisson curve with rate = median count rate of data. |
 |
 |
| Quadrant-wise count rates Data is divided into 100 sec bins |
 |
|
| Module-wise count rates for Quadrant A Data is divided into 100 sec bins |
 |
 |
| Module-wise count rates for Quadrant B Data is divided into 100 sec bins |
 |
 |
| Module-wise count rates for Quadrant C Data is divided into 100 sec bins |
 |
 |
| Module-wise count rates for Quadrant D Data is divided into 100 sec bins |
 |
 |
| Parameter | Plot |
|---|---|
| CZT HV Monitor |  |
| D_VDD | 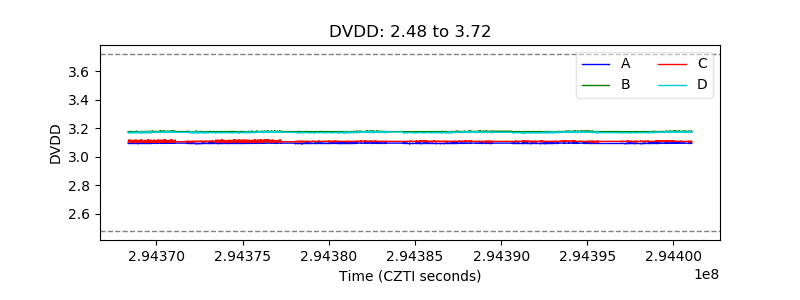 |
| Temperature 1 |  |
| Veto HV Monitor |  |
| Veto LLD |  |
| Alpha Counter |  |
| _CPM_Rate |  |
| CZT Counter |  |
| +2.5 Volts monitor |  |
| +5 Volts monitor |  |
| _ROLL_ROT |  |
| _Roll_DEC | 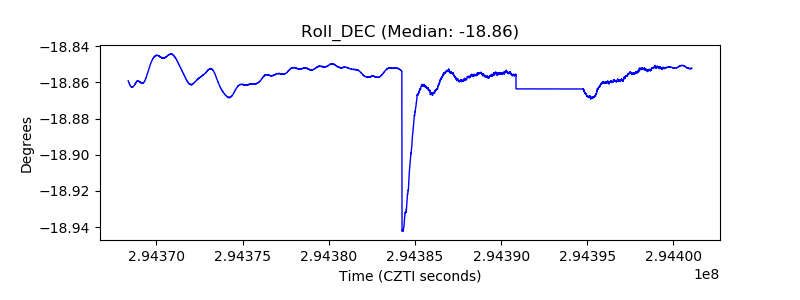 |
| _Roll_RA |  |
| Veto Counter |  |