| Param | Original file | Final file |
|---|---|---|
| Filename | modeM0/AS1A05_104T06_9000002878_19404cztM0_level2.fits | modeM0/AS1A05_104T06_9000002878_19404cztM0_level2_quad_clean.evt |
| Size (bytes) | 846,316,800 | 152,847,360 |
| Size | 807.1 MB | 145.8 MB |
| Events in quadrant A | 4,633,726 | 1,156,689 |
| Events in quadrant B | 4,981,402 | 1,163,356 |
| Events in quadrant C | 4,715,170 | 1,087,480 |
| Events in quadrant D | 16,240,249 | 543,539 |
| Mode M9 | |||
|---|---|---|---|
| Quadrant | BADHDUFLAG | Total packets | Discarded packets |
| A | 0 | 14 | 0 |
| B | 0 | 14 | 0 |
| C | 0 | 14 | 0 |
| D | 0 | 14 | 0 |
| Mode SS | |||
|---|---|---|---|
| Quadrant | BADHDUFLAG | Total packets | Discarded packets |
| A | 0 | 200 | 0 |
| B | 0 | 200 | 0 |
| C | 0 | 200 | 0 |
| D | 0 | 200 | 0 |
| Mode M0 | |||
|---|---|---|---|
| Quadrant | BADHDUFLAG | Total packets | Discarded packets |
| A | 0 | 19885 | 0 |
| B | 0 | 20978 | 0 |
| C | 0 | 19995 | 0 |
| D | 0 | 54972 | 0 |
| Quadrant | Total seconds | Saturated seconds | Saturation percentage |
|---|---|---|---|
| A | 9753 | 53 | 0.543423% |
| B | 9753 | 105 | 1.076592% |
| C | 9753 | 76 | 0.779247% |
| D | 9753 | 5118 | 52.476161% |
Noise dominated data is calculated using 1-second bins in cleaned event files. If a bin has >2000 counts, and if more than 50% of those come from <1% of pixels, then it is considered to be noise-dominated and hence unusable.
| Quadrant | # 1 sec bins | Bins with >0 counts | Bins with >2000 counts | High rate bins dominated by noise | Noise dominated (total time) | Noise dominated (detector-on time) | Marked lightcurve |
|---|---|---|---|---|---|---|---|
| A | 11178 | 9754 | 3 | 3 | 0.03% | 0.03% | 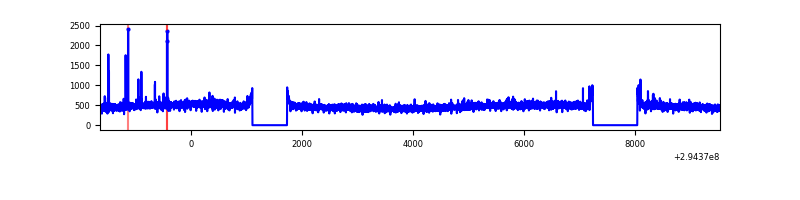 |
| B | 11178 | 9753 | 28 | 28 | 0.25% | 0.29% | 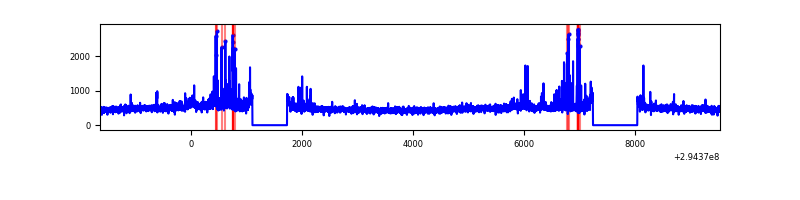 |
| C | 11178 | 9753 | 2 | 2 | 0.02% | 0.02% | 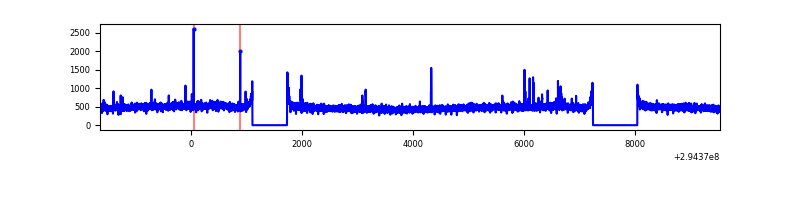 |
| D | 11178 | 9753 | 4154 | 4154 | 37.16% | 42.59% | 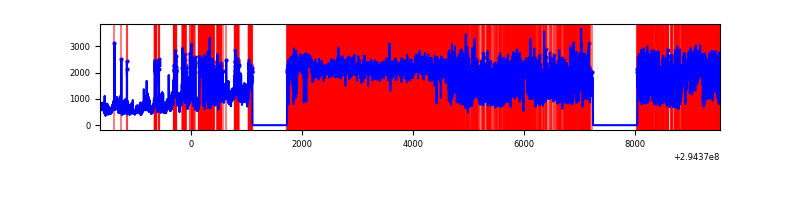 |
Top three noisy pixels from each quadrant. If the there are fewer than three noisy pixels in the level2.evt file, extra rows are filled as -1
| Pixel properties | Quadrant properties | ||||||
|---|---|---|---|---|---|---|---|
| Quadrant | DetID | PixID | Counts | Sigma | Mean | Median | Sigma |
| A | 4 | 2 | 32287 | 130.03 | 1192 | 1166 | 239.3 |
| A | 13 | 254 | 13696 | 52.35 | 1192 | 1166 | 239.3 |
| A | 0 | 226 | 10363 | 38.43 | 1192 | 1166 | 239.3 |
| B | 7 | 220 | 201648 | 887.12 | 1180 | 1150 | 226.0 |
| B | 4 | 216 | 63089 | 274.05 | 1180 | 1150 | 226.0 |
| B | 0 | 198 | 34477 | 147.46 | 1180 | 1150 | 226.0 |
| C | 14 | 238 | 175097 | 657.07 | 1128 | 1134 | 264.8 |
| C | 3 | 233 | 69810 | 259.39 | 1128 | 1134 | 264.8 |
| C | 0 | 207 | 35797 | 130.92 | 1128 | 1134 | 264.8 |
| D | 10 | 66 | 12377134 | 60995.83 | 828 | 803 | 202.9 |
| D | 7 | 238 | 508282 | 2501.07 | 828 | 803 | 202.9 |
| D | 1 | 52 | 157540 | 772.46 | 828 | 803 | 202.9 |
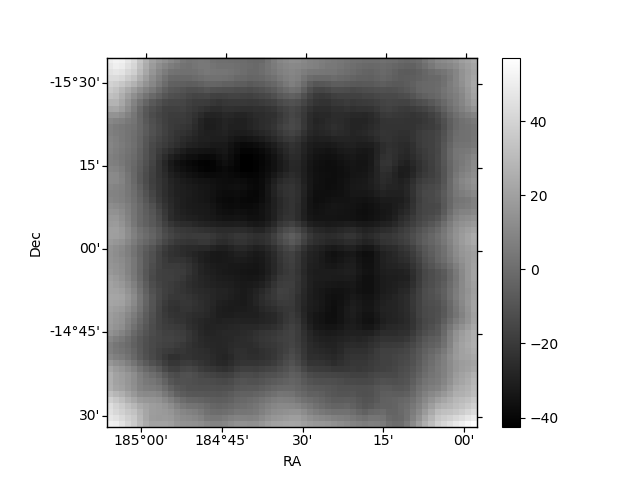
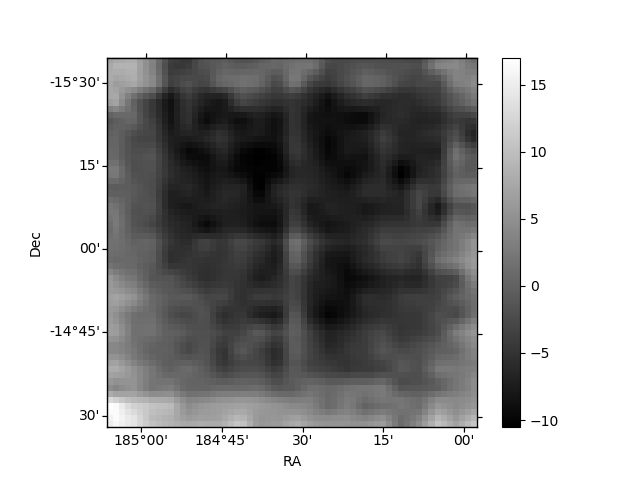
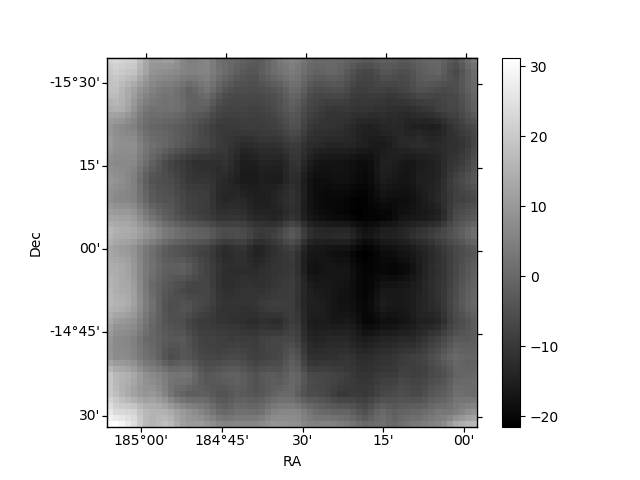
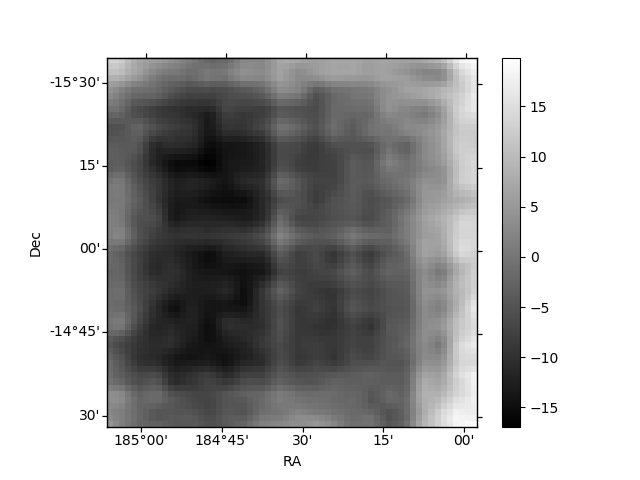
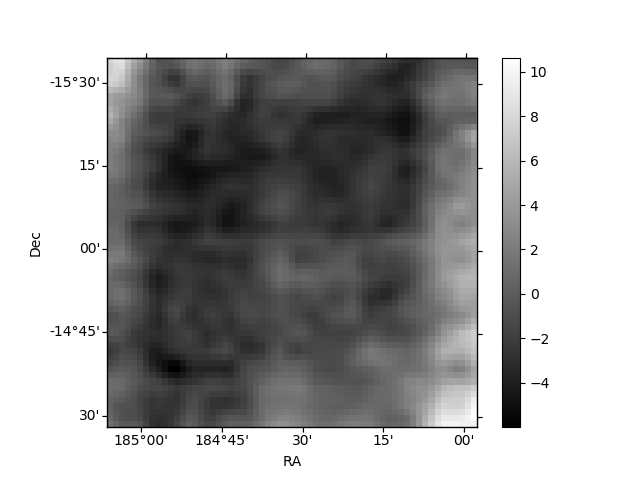
Histogram calculated using DETX and DETY for each event in the final _common_clean file
| Quadrant A | 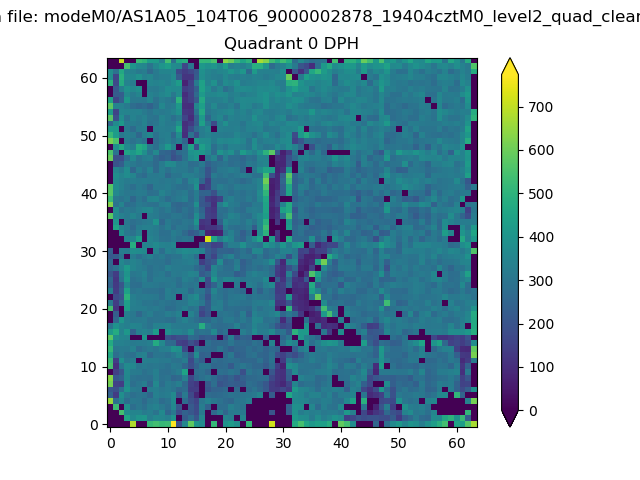 |
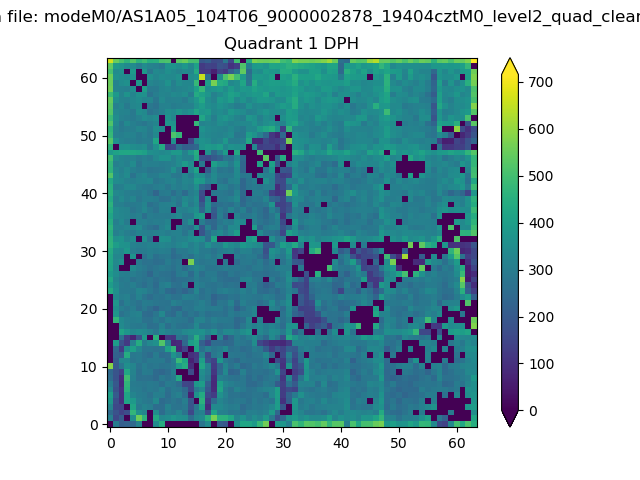 |
Quadrant B |
|---|---|---|---|
| Quadrant D | 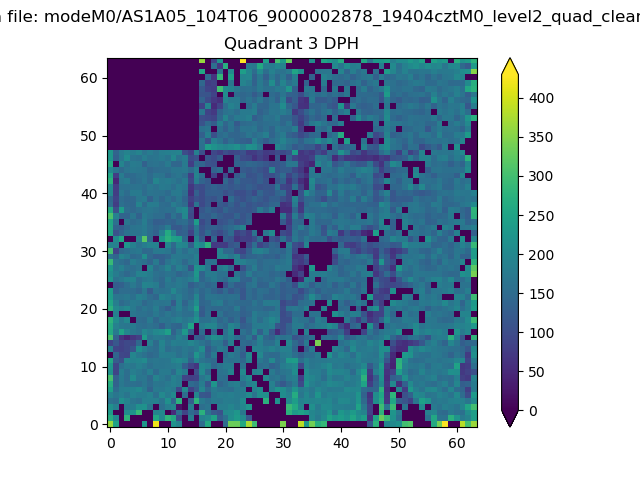 |
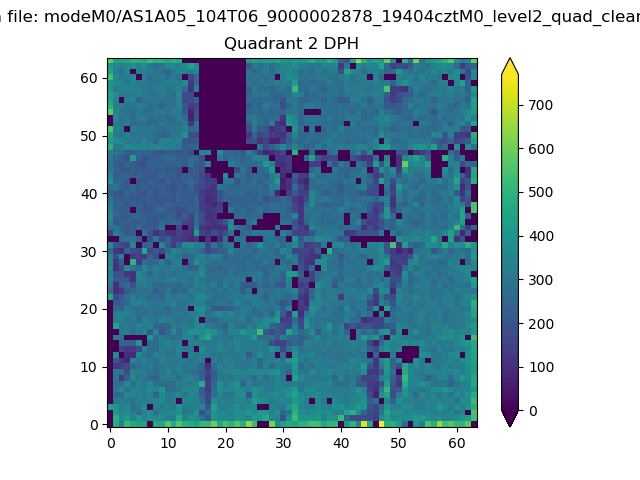 |
Quadrant C |
| Plot type | Count rate plots | Images |
|---|---|---|
| Comparison with Poisson distribution Blue bars denote a histogram of data divided into 1 sec bins. Red curve is a Poisson curve with rate = median count rate of data. |
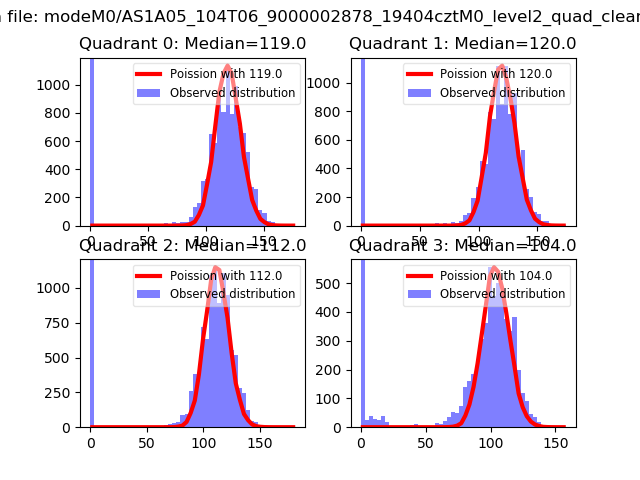 |
 |
| Quadrant-wise count rates Data is divided into 100 sec bins |
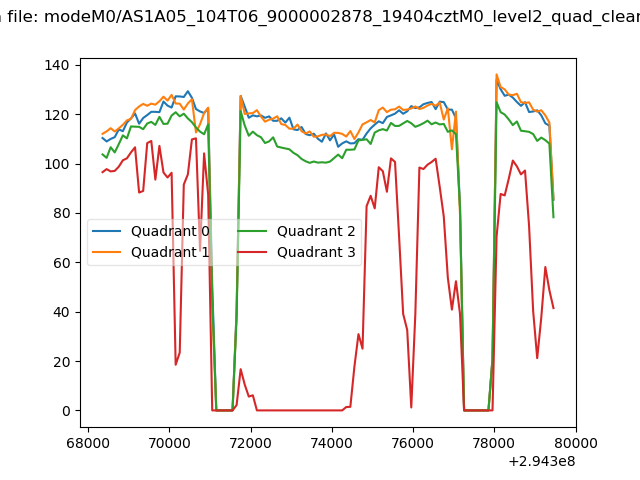 |
|
| Module-wise count rates for Quadrant A Data is divided into 100 sec bins |
 |
 |
| Module-wise count rates for Quadrant B Data is divided into 100 sec bins |
 |
 |
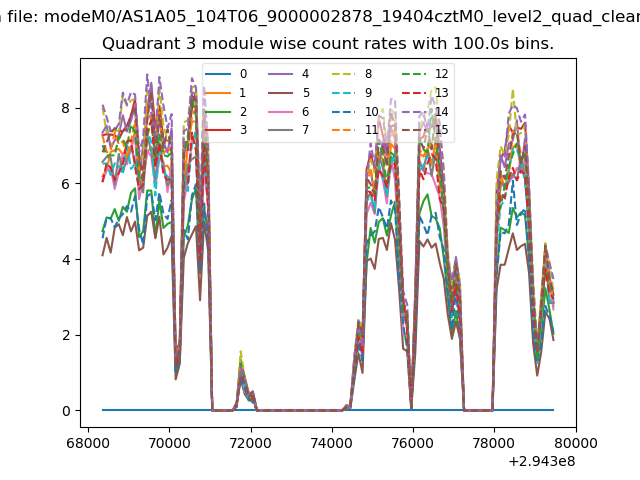
| Module-wise count rates for Quadrant C Data is divided into 100 sec bins |
 |
 |
| Module-wise count rates for Quadrant D Data is divided into 100 sec bins |
 |
 |
| Parameter | Plot |
|---|---|
| CZT HV Monitor |  |
| D_VDD | 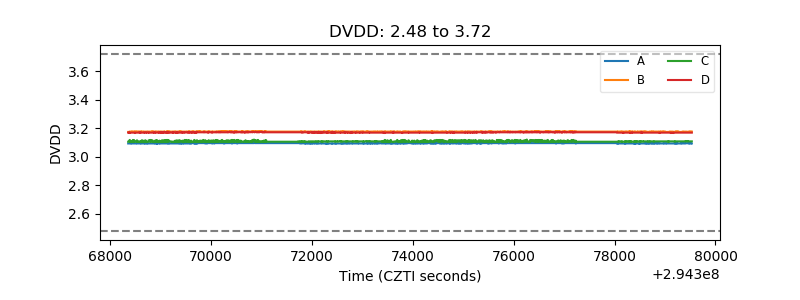 |
| Temperature 1 | 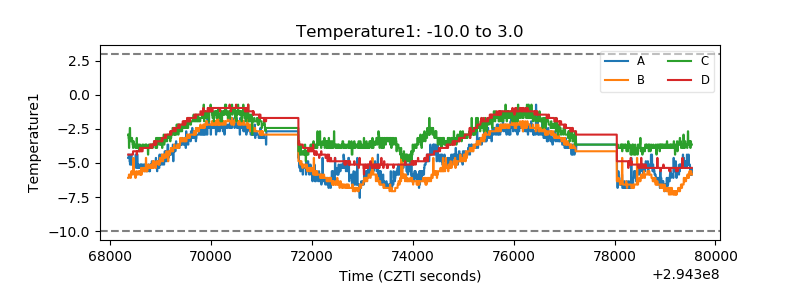 |
| Veto HV Monitor | 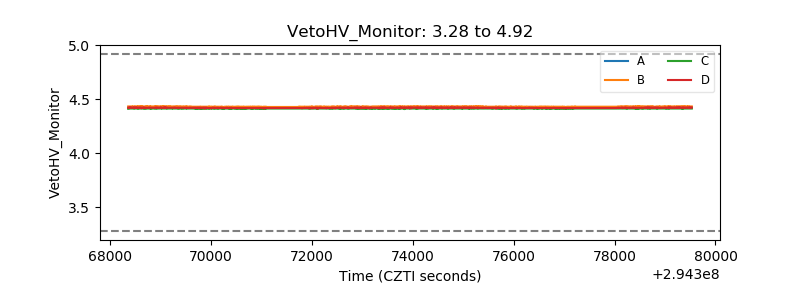 |
| Veto LLD | 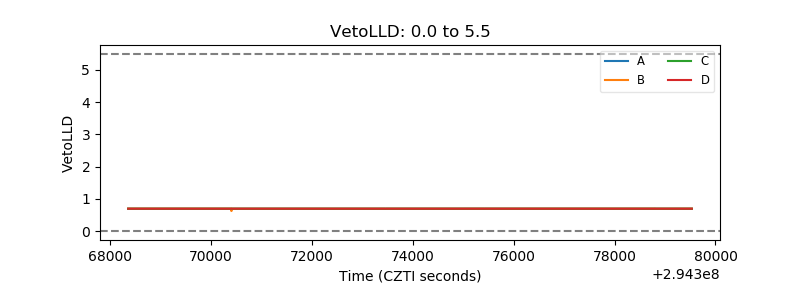 |
| Alpha Counter | 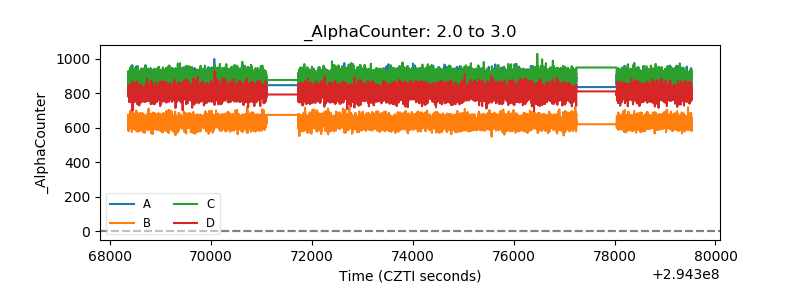 |
| _CPM_Rate | 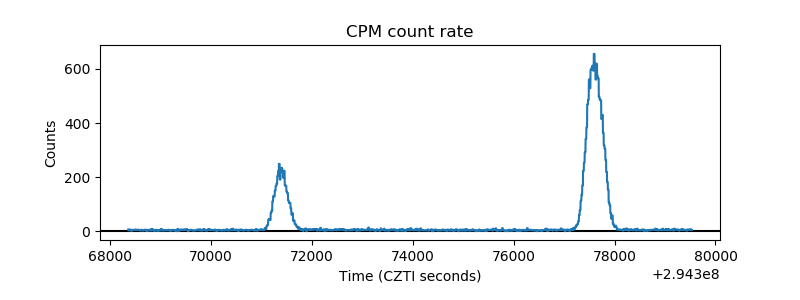 |
| CZT Counter | 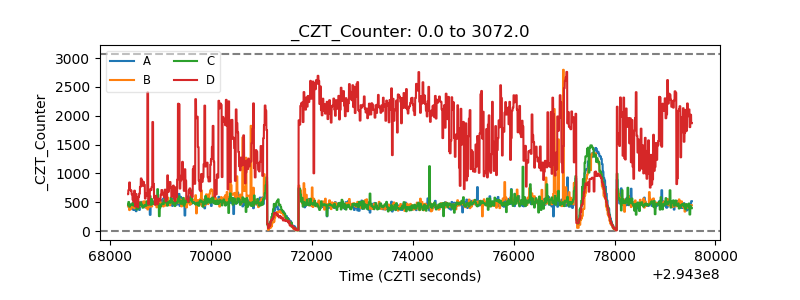 |
| +2.5 Volts monitor |  |
| +5 Volts monitor |  |
| _ROLL_ROT | 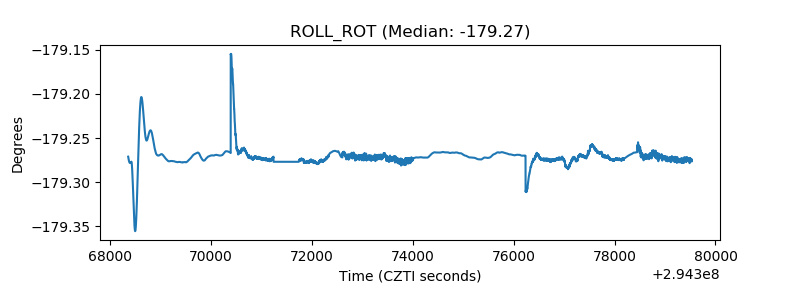 |
| _Roll_DEC | 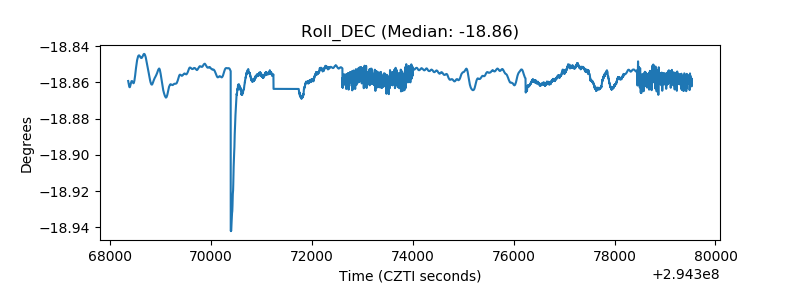 |
| _Roll_RA | 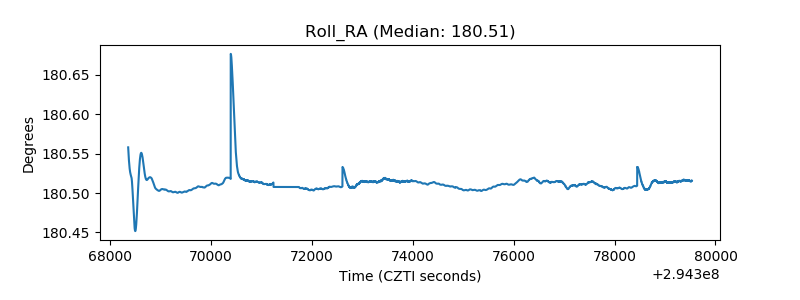 |
| Veto Counter | 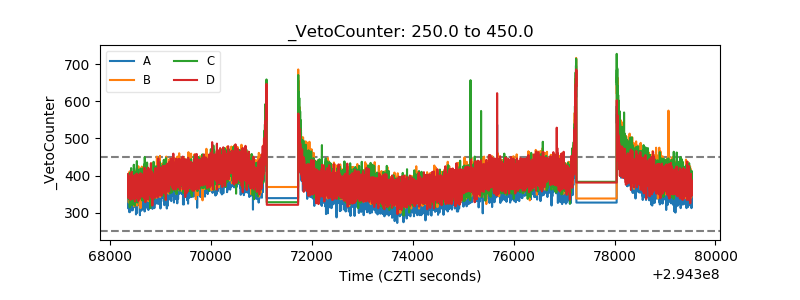 |