| Param | Original file | Final file |
|---|---|---|
| Filename | modeM0/AS1A05_104T06_9000002878_19405cztM0_level2.evt | modeM0/AS1A05_104T06_9000002878_19405cztM0_level2_quad_clean.evt |
| Size (bytes) | 778,092,480 | 62,303,040 |
| Size | 742.0 MB | 59.4 MB |
| Events in quadrant A | 3,248,103 | 413,656 |
| Events in quadrant B | 3,363,427 | 414,502 |
| Events in quadrant C | 3,312,407 | 392,462 |
| Events in quadrant D | 13,182,765 | 193,157 |
| Mode M9 | |||
|---|---|---|---|
| Quadrant | BADHDUFLAG | Total packets | Discarded packets |
| A | 0 | 10 | 0 |
| B | 0 | 10 | 0 |
| C | 0 | 10 | 0 |
| D | 0 | 10 | 0 |
| Mode SS | |||
|---|---|---|---|
| Quadrant | BADHDUFLAG | Total packets | Discarded packets |
| A | 0 | 136 | 0 |
| B | 0 | 136 | 0 |
| C | 0 | 136 | 0 |
| D | 0 | 136 | 0 |
| Mode M0 | |||
|---|---|---|---|
| Quadrant | BADHDUFLAG | Total packets | Discarded packets |
| A | 0 | 13943 | 1 |
| B | 0 | 14117 | 1 |
| C | 0 | 13967 | 1 |
| D | 0 | 43754 | 1 |
| Quadrant | Total seconds | Saturated seconds | Saturation percentage |
|---|---|---|---|
| A | 6763 | 22 | 0.325299% |
| B | 6764 | 30 | 0.443525% |
| C | 6764 | 48 | 0.709639% |
| D | 6764 | 4499 | 66.513897% |
Noise dominated data is calculated using 1-second bins in cleaned event files. If a bin has >2000 counts, and if more than 50% of those come from <1% of pixels, then it is considered to be noise-dominated and hence unusable.
| Quadrant | # 1 sec bins | Bins with >0 counts | Bins with >2000 counts | High rate bins dominated by noise | Noise dominated (total time) | Noise dominated (detector-on time) | Marked lightcurve |
|---|---|---|---|---|---|---|---|
| A | 7718 | 6764 | 3 | 3 | 0.04% | 0.04% | 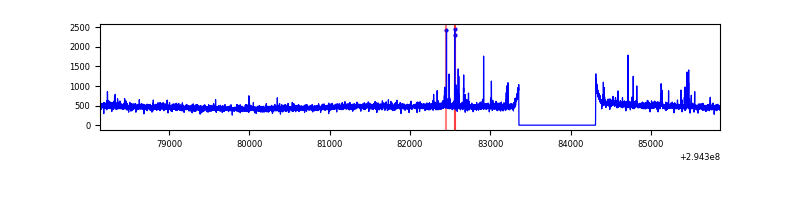 |
| B | 7719 | 6765 | 6 | 6 | 0.08% | 0.09% | 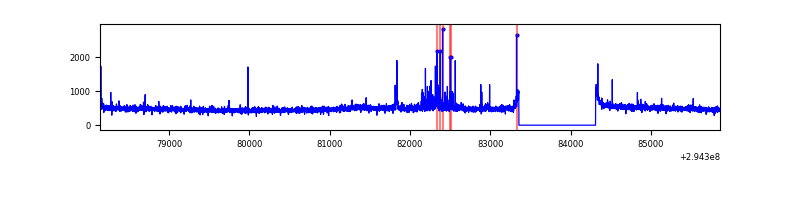 |
| C | 7719 | 6765 | 4 | 4 | 0.05% | 0.06% | 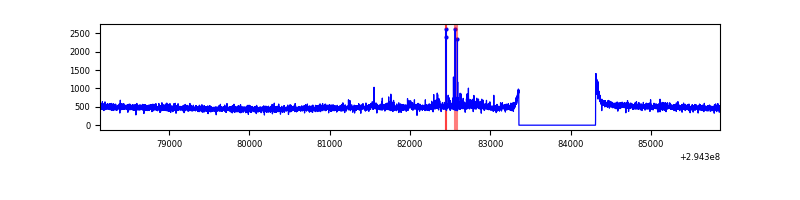 |
| D | 7719 | 6764 | 4012 | 4012 | 51.98% | 59.31% | 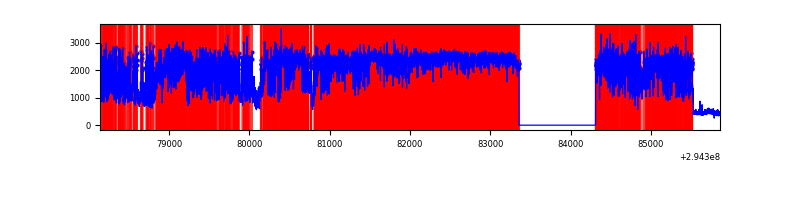 |
Top three noisy pixels from each quadrant. If the there are fewer than three noisy pixels in the level2.evt file, extra rows are filled as -1
| Pixel properties | Quadrant properties | ||||||
|---|---|---|---|---|---|---|---|
| Quadrant | DetID | PixID | Counts | Sigma | Mean | Median | Sigma |
| A | 5 | 16 | 71183 | 421.85 | 822 | 804 | 166.8 |
| A | 13 | 254 | 9386 | 51.44 | 822 | 804 | 166.8 |
| A | 4 | 2 | 7680 | 41.21 | 822 | 804 | 166.8 |
| B | 7 | 220 | 67677 | 425.73 | 824 | 803 | 157.1 |
| B | 0 | 198 | 24766 | 152.55 | 824 | 803 | 157.1 |
| B | 12 | 111 | 19174 | 116.95 | 824 | 803 | 157.1 |
| C | 14 | 238 | 121113 | 652.79 | 785 | 790 | 184.3 |
| C | 3 | 233 | 94515 | 508.49 | 785 | 790 | 184.3 |
| C | 0 | 207 | 29957 | 158.24 | 785 | 790 | 184.3 |
| D | 10 | 66 | 10633233 | 78484.95 | 552 | 535 | 135.5 |
| D | 7 | 238 | 261736 | 1928.05 | 552 | 535 | 135.5 |
| D | 1 | 52 | 196581 | 1447.11 | 552 | 535 | 135.5 |
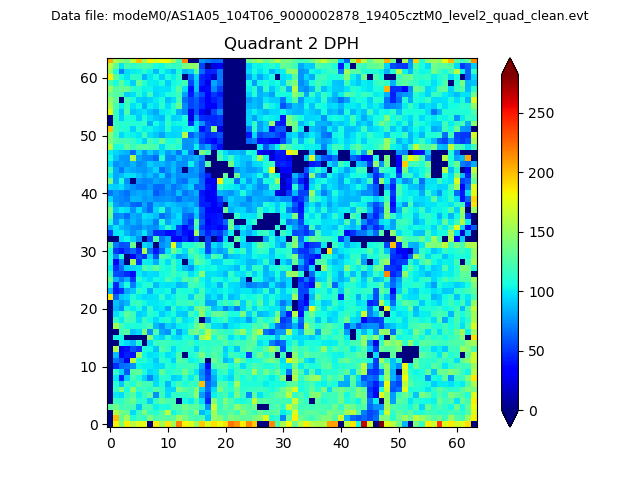
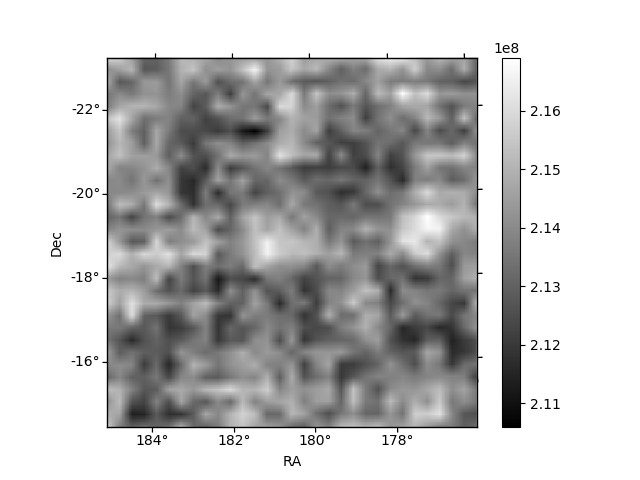
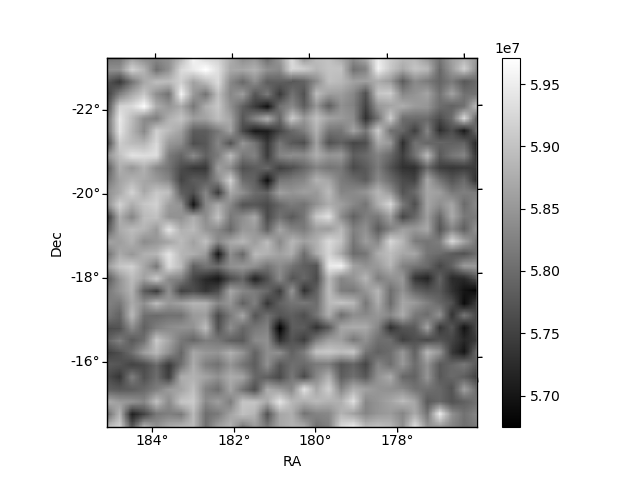
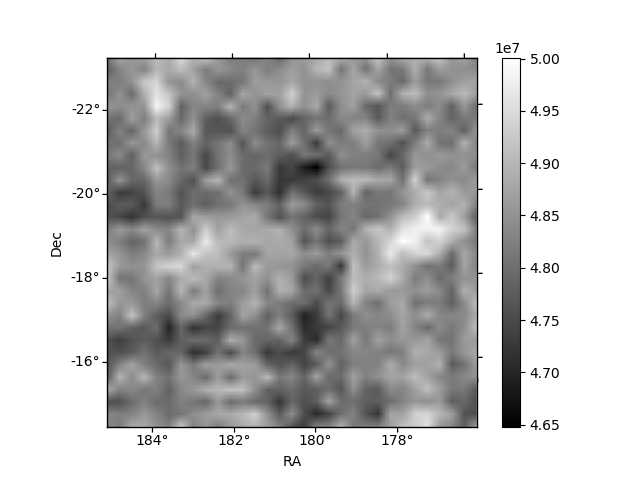
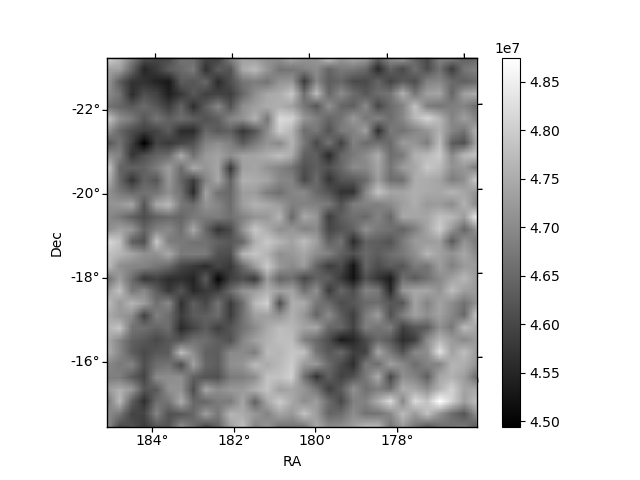
Histogram calculated using DETX and DETY for each event in the final _common_clean file
| Quadrant A | 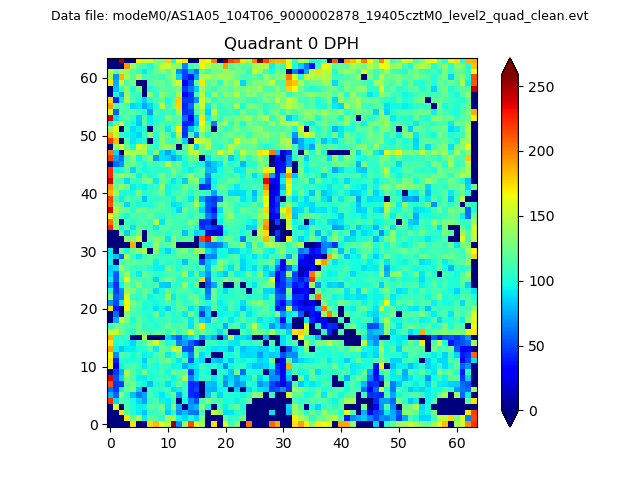 |
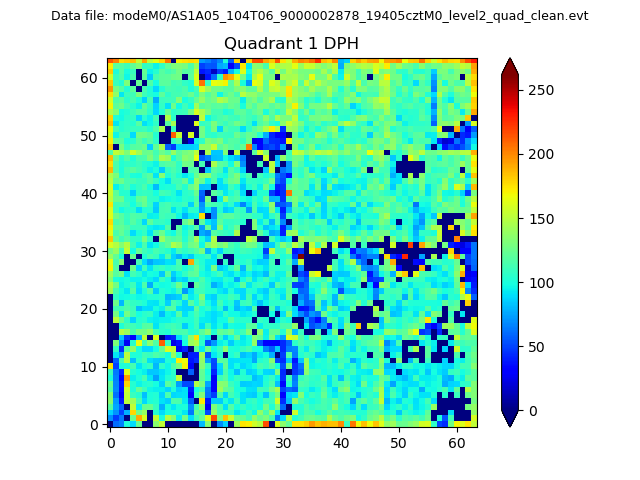 |
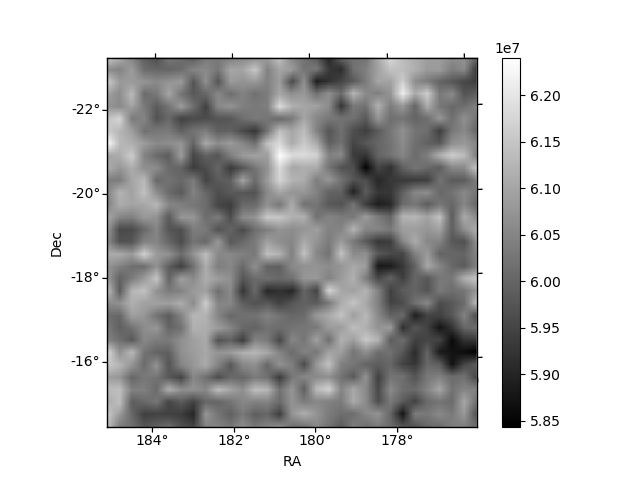
Quadrant B |
|---|---|---|---|
| Quadrant D | 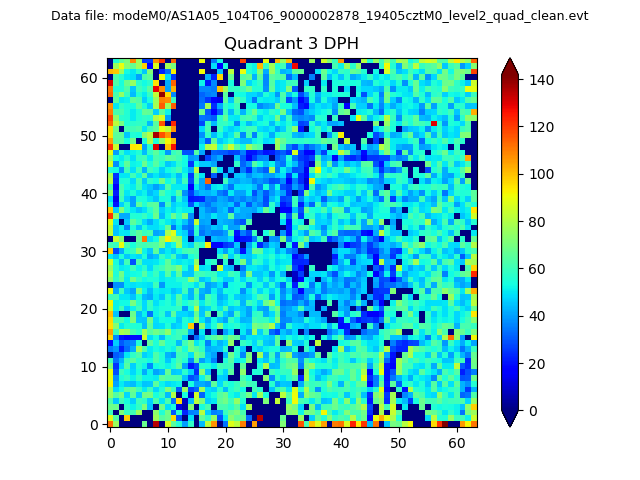 |
 |
Quadrant C |
| Plot type | Count rate plots | Images |
|---|---|---|
| Comparison with Poisson distribution Blue bars denote a histogram of data divided into 1 sec bins. Red curve is a Poisson curve with rate = median count rate of data. |
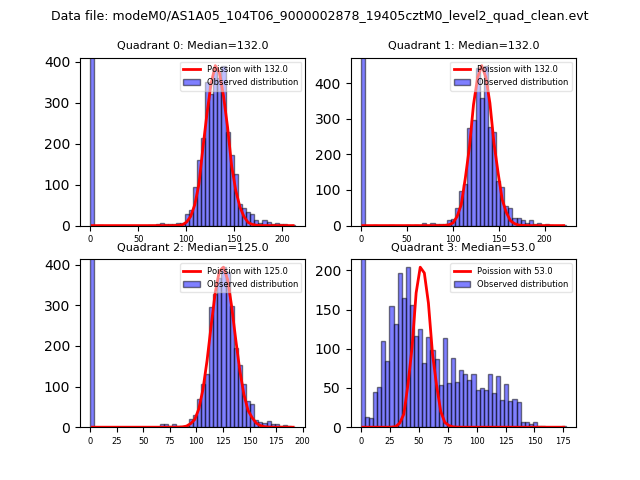 |
 |
| Quadrant-wise count rates Data is divided into 100 sec bins |
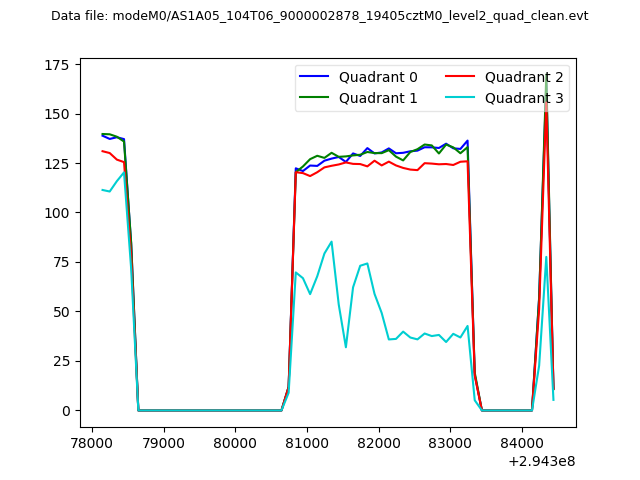 |
|
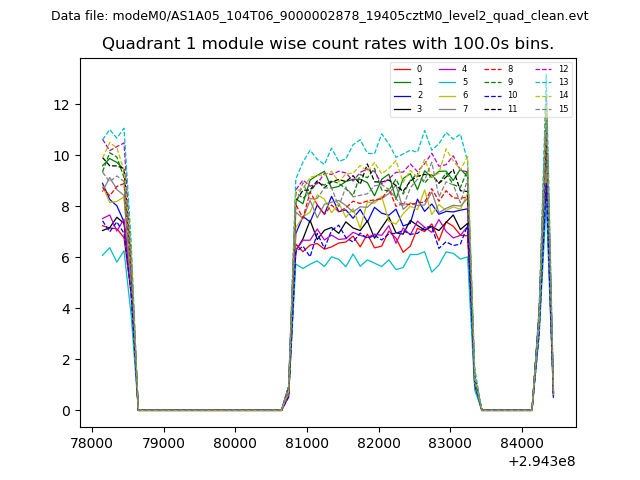
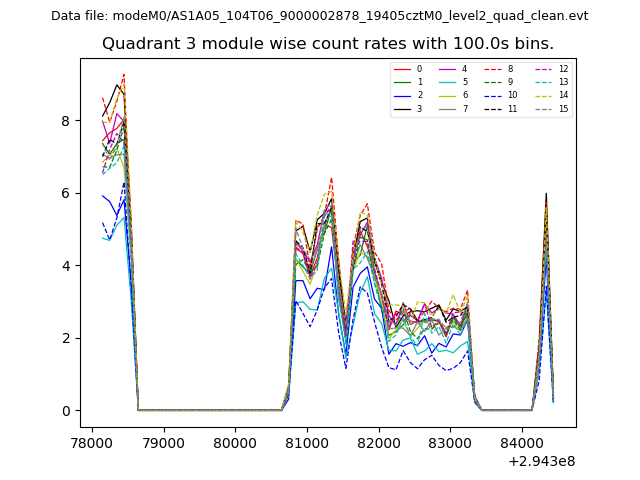
| Module-wise count rates for Quadrant A Data is divided into 100 sec bins |
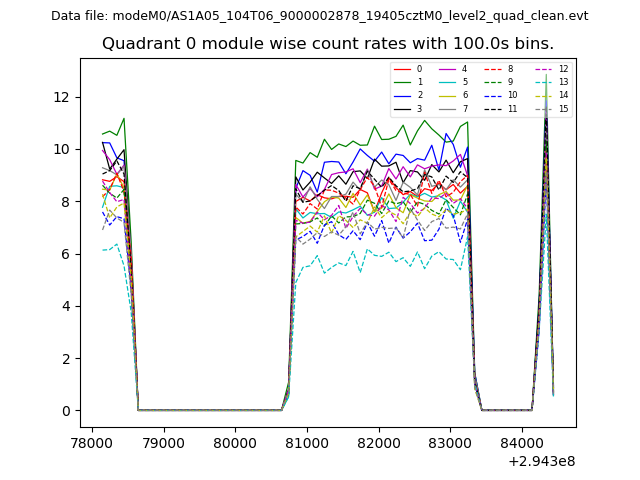 |
 |
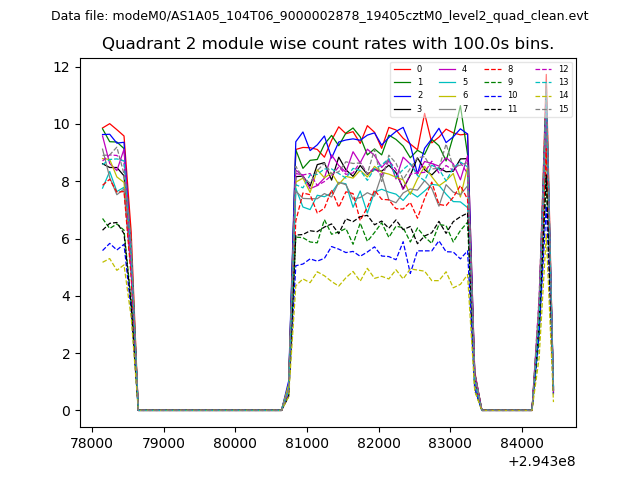
| Module-wise count rates for Quadrant B Data is divided into 100 sec bins |
 |
 |
| Module-wise count rates for Quadrant C Data is divided into 100 sec bins |
 |
 |
| Module-wise count rates for Quadrant D Data is divided into 100 sec bins |
 |
 |
| Parameter | Plot |
|---|---|
| CZT HV Monitor | 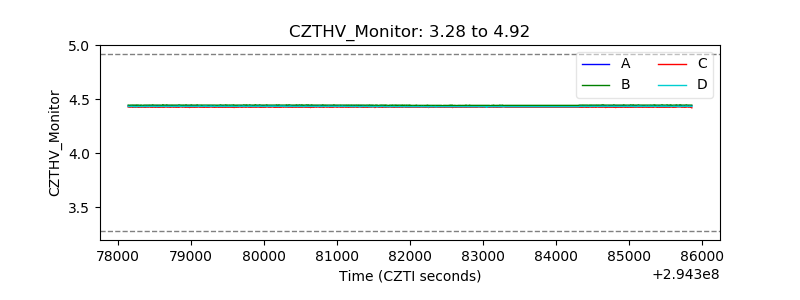 |
| D_VDD | 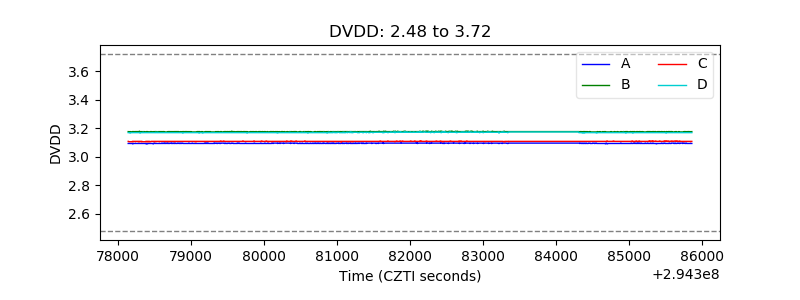 |
| Temperature 1 | 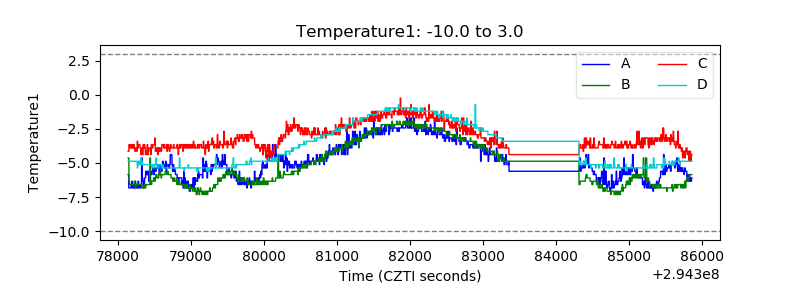 |
| Veto HV Monitor | 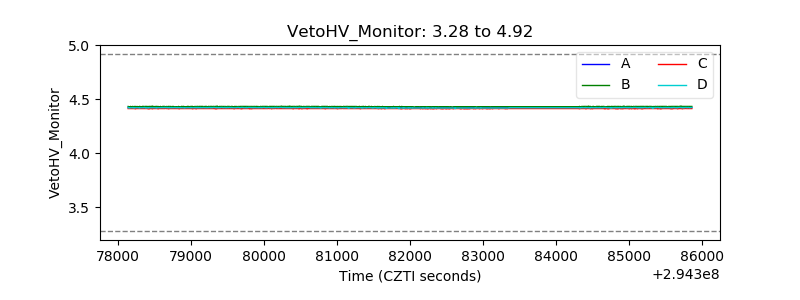 |
| Veto LLD | 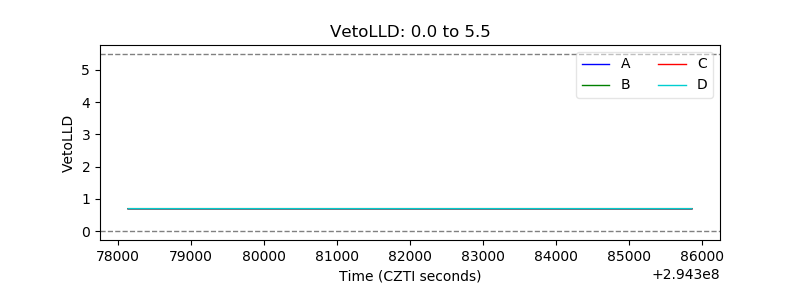 |
| Alpha Counter | 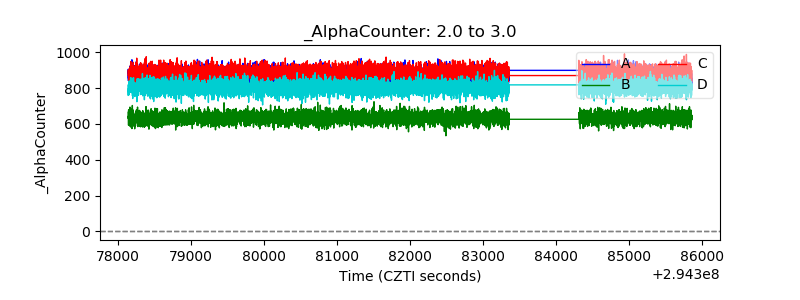 |
| _CPM_Rate | 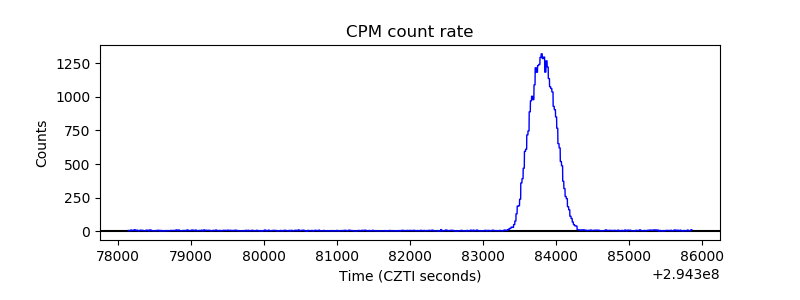 |
| CZT Counter | 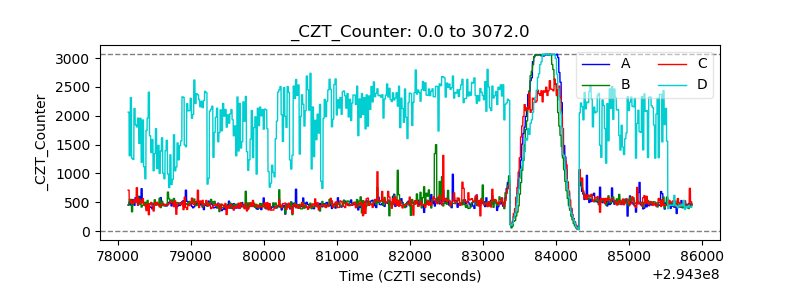 |
| +2.5 Volts monitor |  |
| +5 Volts monitor |  |
| _ROLL_ROT | 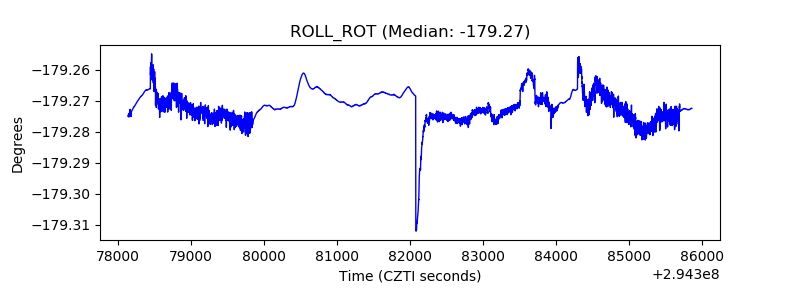 |
| _Roll_DEC | 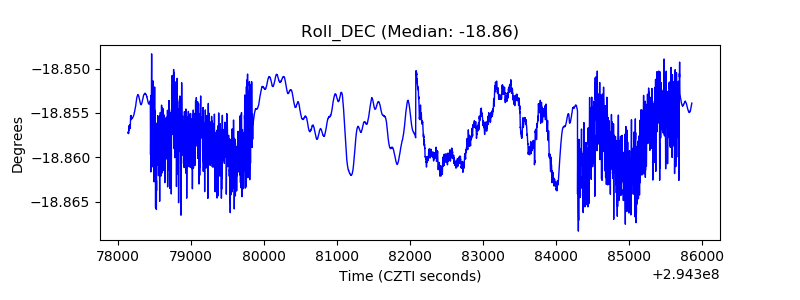 |
| _Roll_RA | 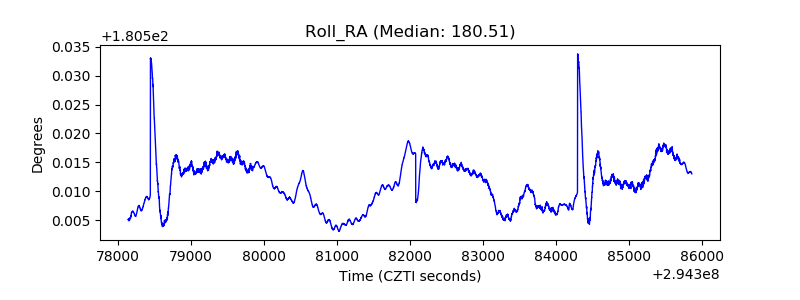 |
| Veto Counter | 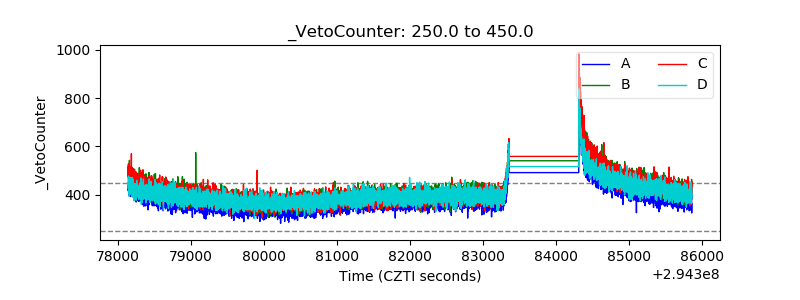 |