| Param | Original file | Final file |
|---|---|---|
| Filename | modeM0/AS1A05_104T06_9000002878_19407cztM0_level2.evt | modeM0/AS1A05_104T06_9000002878_19407cztM0_level2_quad_clean.evt |
| Size (bytes) | 608,319,360 | 63,264,960 |
| Size | 580.1 MB | 60.3 MB |
| Events in quadrant A | 3,384,438 | 392,196 |
| Events in quadrant B | 3,449,979 | 393,954 |
| Events in quadrant C | 3,382,743 | 374,727 |
| Events in quadrant D | 7,757,523 | 293,027 |
| Mode M9 | |||
|---|---|---|---|
| Quadrant | BADHDUFLAG | Total packets | Discarded packets |
| A | 0 | 15 | 0 |
| B | 0 | 16 | 0 |
| C | 0 | 16 | 0 |
| D | 0 | 16 | 0 |
| Mode SS | |||
|---|---|---|---|
| Quadrant | BADHDUFLAG | Total packets | Discarded packets |
| A | 0 | 134 | 0 |
| B | 0 | 134 | 0 |
| C | 0 | 134 | 0 |
| D | 0 | 134 | 0 |
| Mode M0 | |||
|---|---|---|---|
| Quadrant | BADHDUFLAG | Total packets | Discarded packets |
| A | 0 | 14139 | 2 |
| B | 0 | 14228 | 2 |
| C | 0 | 13965 | 2 |
| D | 0 | 27492 | 2 |
| Quadrant | Total seconds | Saturated seconds | Saturation percentage |
|---|---|---|---|
| A | 6612 | 50 | 0.756201% |
| B | 6612 | 45 | 0.680581% |
| C | 6612 | 70 | 1.058681% |
| D | 6612 | 1912 | 28.917120% |
Noise dominated data is calculated using 1-second bins in cleaned event files. If a bin has >2000 counts, and if more than 50% of those come from <1% of pixels, then it is considered to be noise-dominated and hence unusable.
| Quadrant | # 1 sec bins | Bins with >0 counts | Bins with >2000 counts | High rate bins dominated by noise | Noise dominated (total time) | Noise dominated (detector-on time) | Marked lightcurve |
|---|---|---|---|---|---|---|---|
| A | 7732 | 6613 | 16 | 16 | 0.21% | 0.24% | 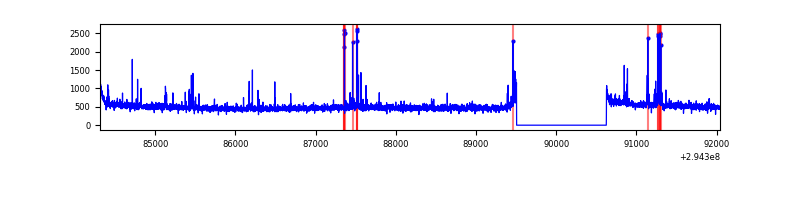 |
| B | 7732 | 6613 | 1 | 1 | 0.01% | 0.02% | 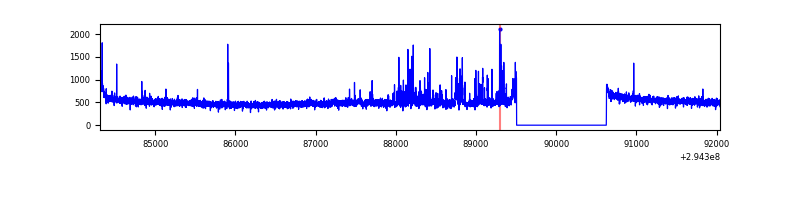 |
| C | 7732 | 6612 | 6 | 6 | 0.08% | 0.09% | 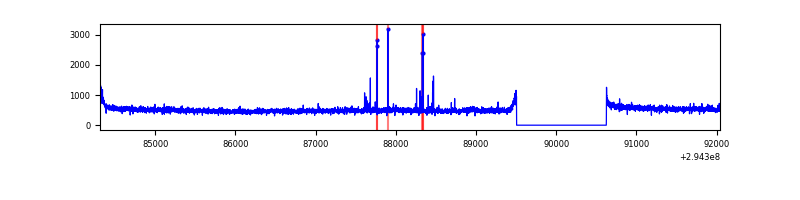 |
| D | 7732 | 6612 | 1695 | 1695 | 21.92% | 25.64% | 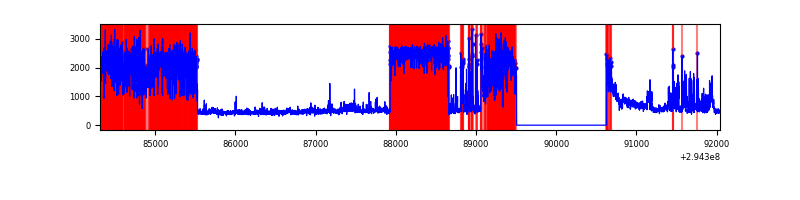 |
Top three noisy pixels from each quadrant. If the there are fewer than three noisy pixels in the level2.evt file, extra rows are filled as -1
| Pixel properties | Quadrant properties | ||||||
|---|---|---|---|---|---|---|---|
| Quadrant | DetID | PixID | Counts | Sigma | Mean | Median | Sigma |
| A | 5 | 16 | 131763 | 774.85 | 840 | 824 | 169.0 |
| A | 13 | 254 | 10403 | 56.69 | 840 | 824 | 169.0 |
| A | 12 | 96 | 9519 | 51.45 | 840 | 824 | 169.0 |
| B | 7 | 220 | 59409 | 369.68 | 839 | 819 | 158.5 |
| B | 0 | 197 | 30725 | 188.69 | 839 | 819 | 158.5 |
| B | 0 | 230 | 26819 | 164.05 | 839 | 819 | 158.5 |
| C | 14 | 238 | 124951 | 665.24 | 800 | 806 | 186.6 |
| C | 3 | 233 | 91486 | 485.92 | 800 | 806 | 186.6 |
| C | 0 | 207 | 39400 | 206.81 | 800 | 806 | 186.6 |
| D | 10 | 66 | 4785399 | 27803.86 | 706 | 685 | 172.1 |
| D | 7 | 238 | 223175 | 1292.88 | 706 | 685 | 172.1 |
| D | 1 | 52 | 63473 | 364.86 | 706 | 685 | 172.1 |
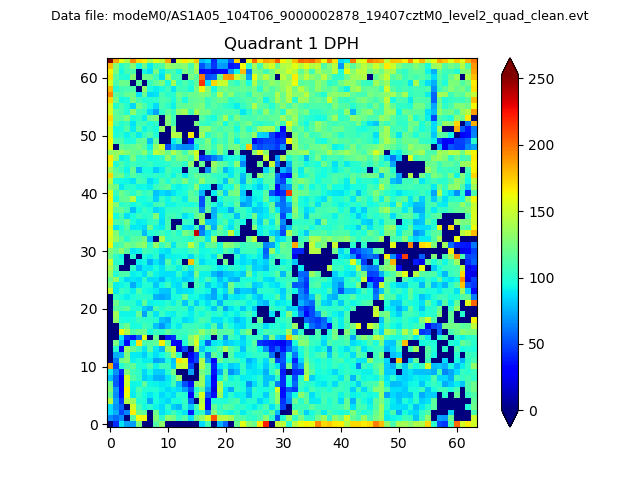
Histogram calculated using DETX and DETY for each event in the final _common_clean file
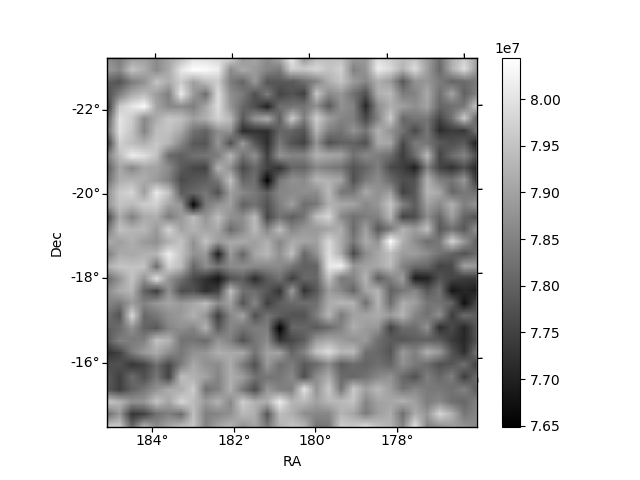
| Quadrant A |  |
 |
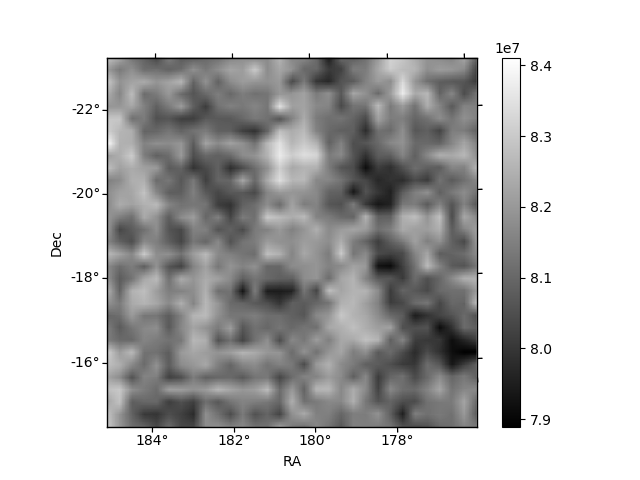
Quadrant B |
|---|---|---|---|
| Quadrant D | 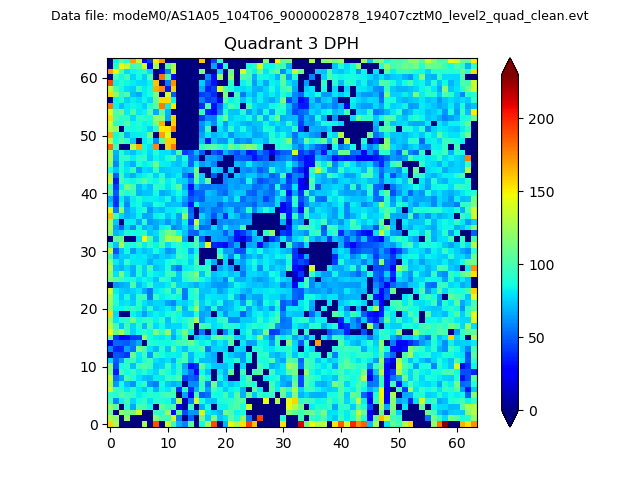 |
 |
Quadrant C |
| Plot type | Count rate plots | Images |
|---|---|---|
| Comparison with Poisson distribution Blue bars denote a histogram of data divided into 1 sec bins. Red curve is a Poisson curve with rate = median count rate of data. |
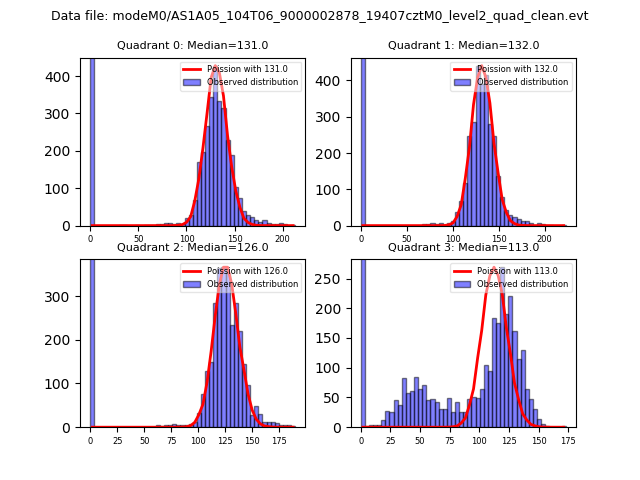 |
 |
| Quadrant-wise count rates Data is divided into 100 sec bins |
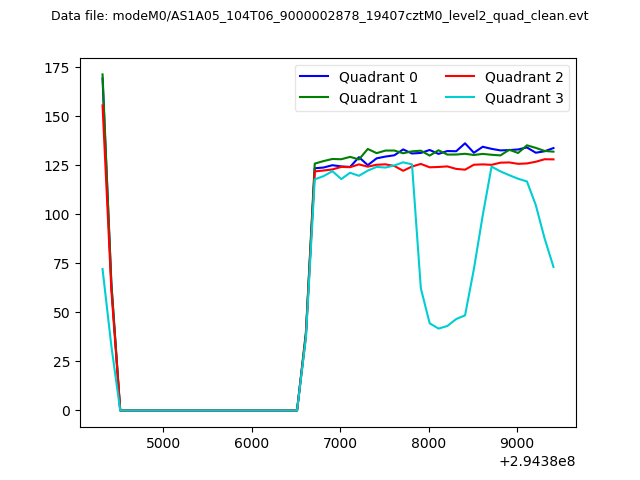 |
|
| Module-wise count rates for Quadrant A Data is divided into 100 sec bins |
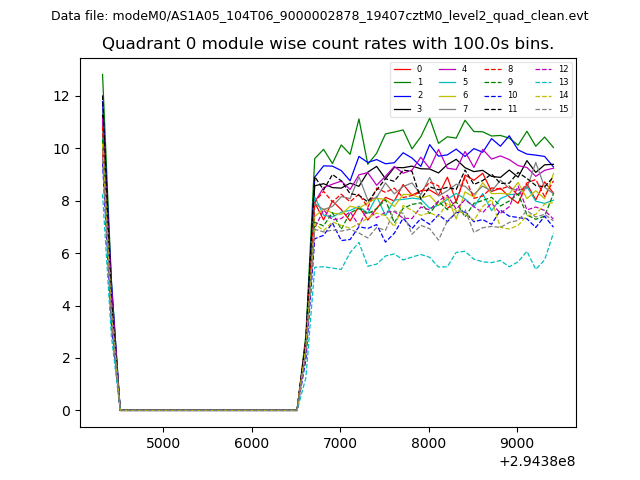 |
 |
| Module-wise count rates for Quadrant B Data is divided into 100 sec bins |
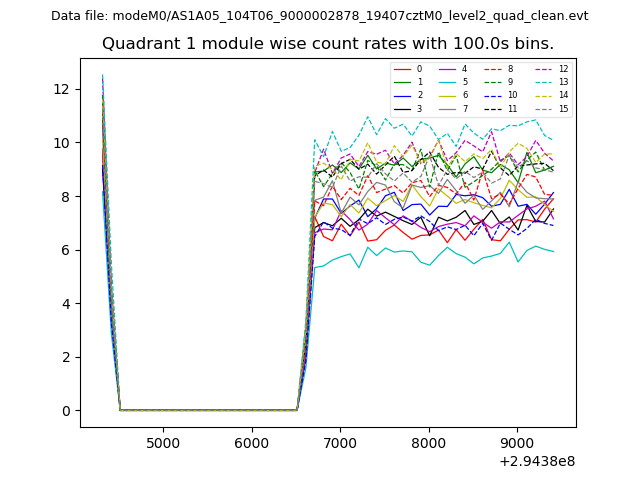 |
 |
| Module-wise count rates for Quadrant C Data is divided into 100 sec bins |
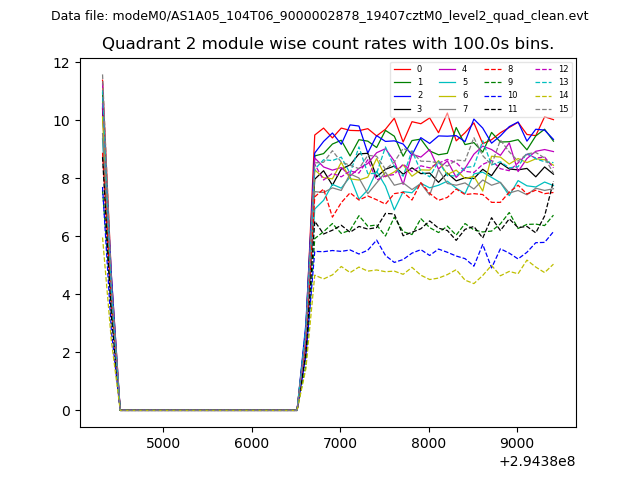 |
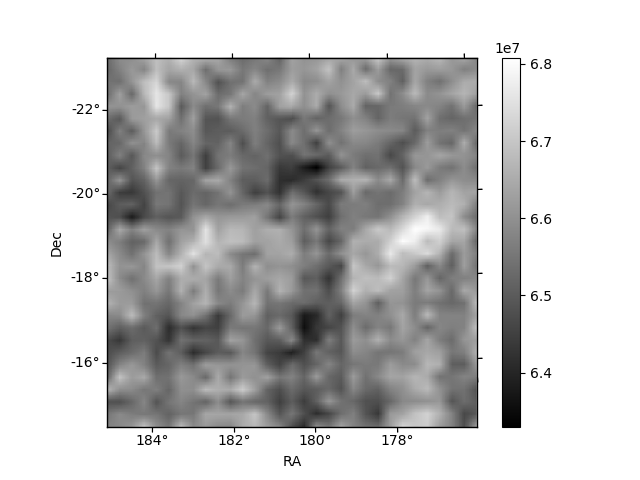 |
| Module-wise count rates for Quadrant D Data is divided into 100 sec bins |
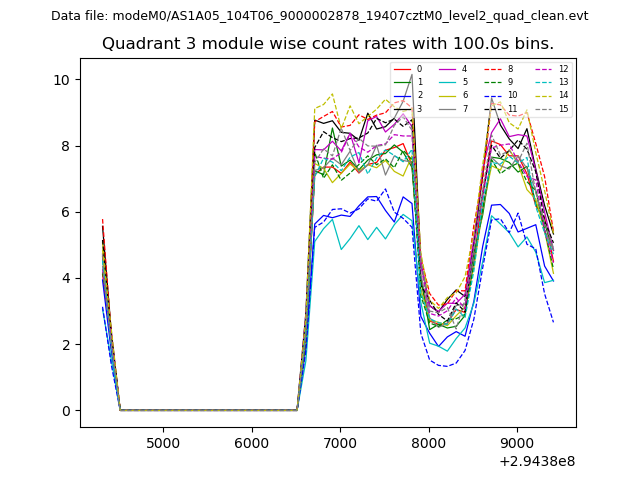 |
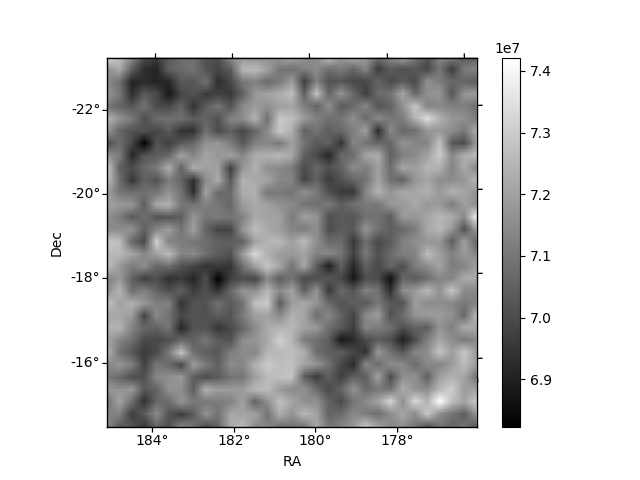 |
| Parameter | Plot |
|---|---|
| CZT HV Monitor | 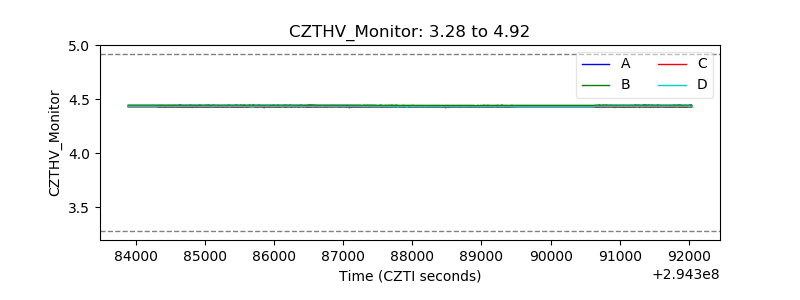 |
| D_VDD | 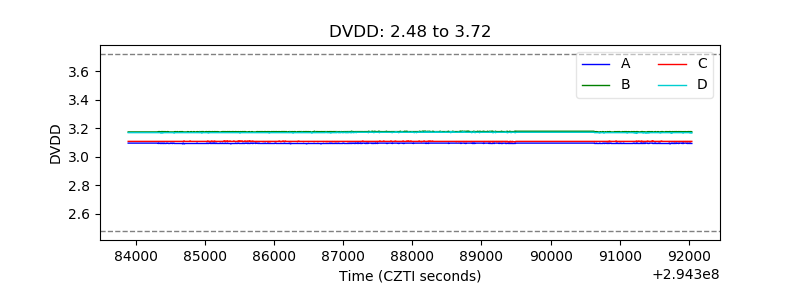 |
| Temperature 1 | 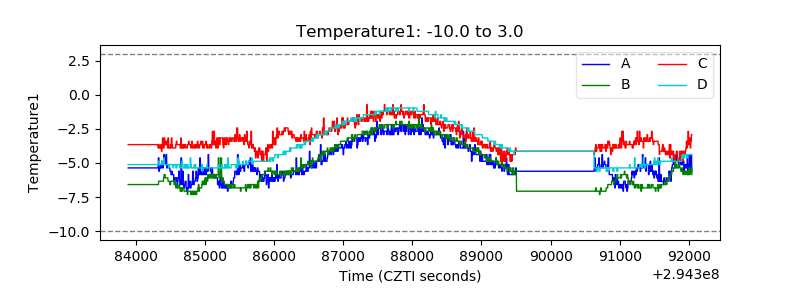 |
| Veto HV Monitor | 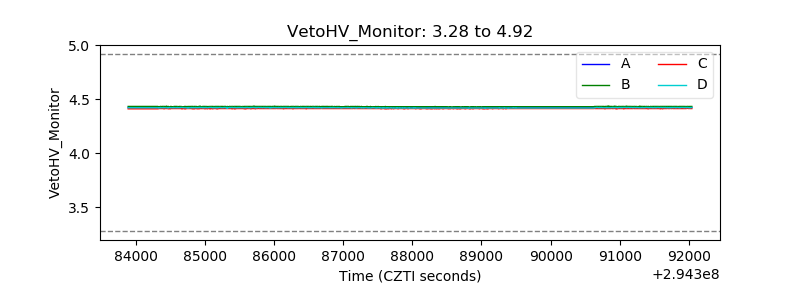 |
| Veto LLD | 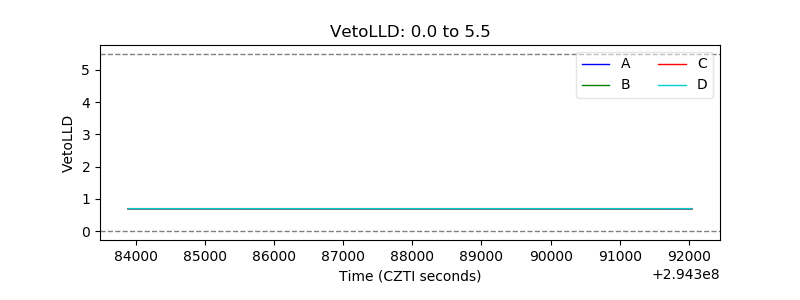 |
| Alpha Counter | 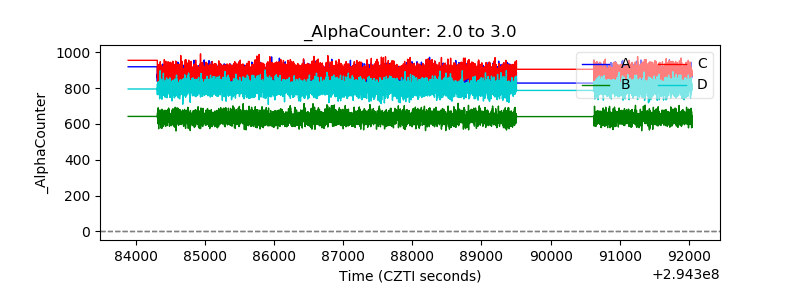 |
| _CPM_Rate | 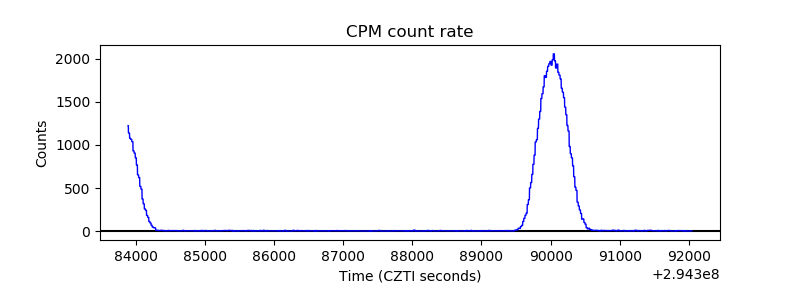 |
| CZT Counter |  |
| +2.5 Volts monitor |  |
| +5 Volts monitor | 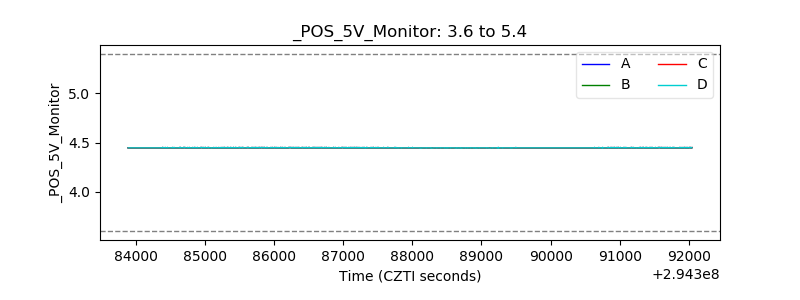 |
| _ROLL_ROT |  |
| _Roll_DEC | 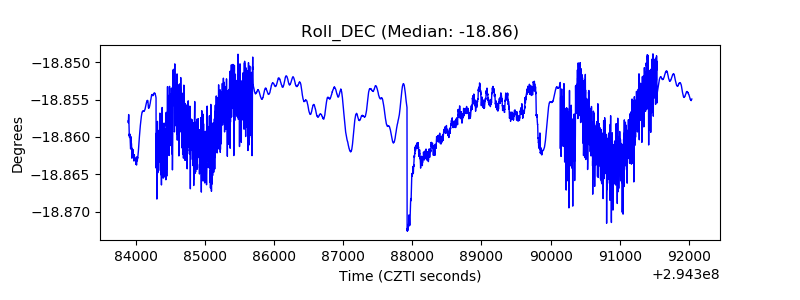 |
| _Roll_RA |  |
| Veto Counter | 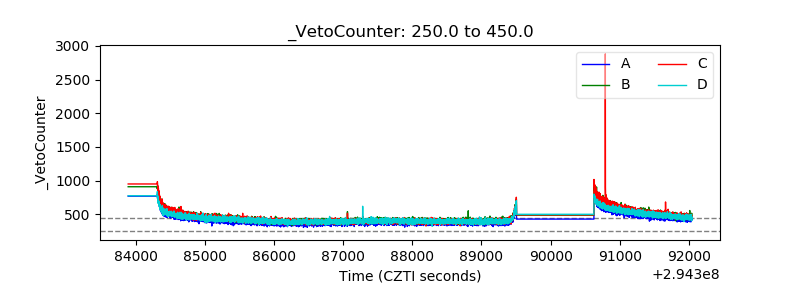 |