| Param | Original file | Final file |
|---|---|---|
| Filename | modeM0/AS1A05_104T06_9000002878_19408cztM0_level2.evt | modeM0/AS1A05_104T06_9000002878_19408cztM0_level2_quad_clean.evt |
| Size (bytes) | 619,430,400 | 68,172,480 |
| Size | 590.7 MB | 65.0 MB |
| Events in quadrant A | 3,395,165 | 429,324 |
| Events in quadrant B | 3,428,350 | 428,505 |
| Events in quadrant C | 3,378,079 | 409,077 |
| Events in quadrant D | 8,131,597 | 356,967 |
| Mode M9 | |||
|---|---|---|---|
| Quadrant | BADHDUFLAG | Total packets | Discarded packets |
| A | 0 | 16 | 0 |
| B | 0 | 17 | 0 |
| C | 0 | 17 | 0 |
| D | 0 | 17 | 0 |
| Mode SS | |||
|---|---|---|---|
| Quadrant | BADHDUFLAG | Total packets | Discarded packets |
| A | 0 | 128 | 0 |
| B | 0 | 128 | 0 |
| C | 0 | 128 | 0 |
| D | 0 | 128 | 0 |
| Mode M0 | |||
|---|---|---|---|
| Quadrant | BADHDUFLAG | Total packets | Discarded packets |
| A | 0 | 13918 | 2 |
| B | 0 | 14052 | 2 |
| C | 0 | 13861 | 2 |
| D | 0 | 28568 | 2 |
| Quadrant | Total seconds | Saturated seconds | Saturation percentage |
|---|---|---|---|
| A | 6303 | 69 | 1.094717% |
| B | 6303 | 87 | 1.380295% |
| C | 6303 | 101 | 1.602412% |
| D | 6303 | 1282 | 20.339521% |
Noise dominated data is calculated using 1-second bins in cleaned event files. If a bin has >2000 counts, and if more than 50% of those come from <1% of pixels, then it is considered to be noise-dominated and hence unusable.
| Quadrant | # 1 sec bins | Bins with >0 counts | Bins with >2000 counts | High rate bins dominated by noise | Noise dominated (total time) | Noise dominated (detector-on time) | Marked lightcurve |
|---|---|---|---|---|---|---|---|
| A | 7498 | 6303 | 10 | 10 | 0.13% | 0.16% | 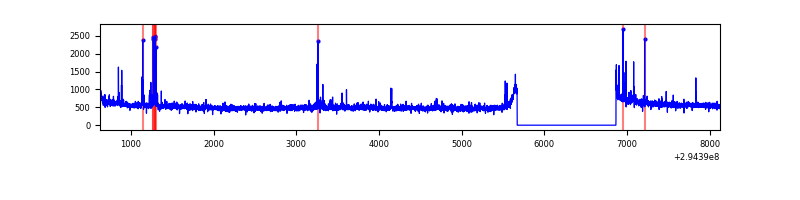 |
| B | 7498 | 6303 | 15 | 15 | 0.20% | 0.24% | 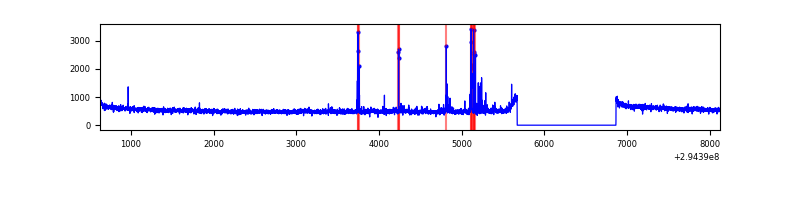 |
| C | 7498 | 6303 | 0 | 0 | 0.00% | 0.00% | 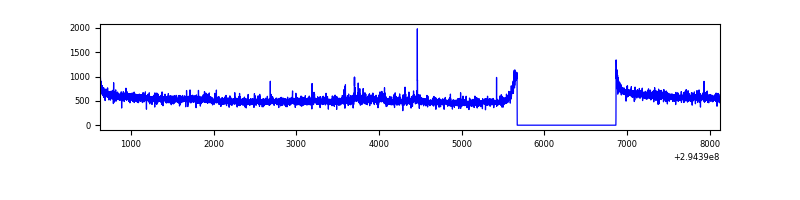 |
| D | 7498 | 6303 | 1126 | 1126 | 15.02% | 17.86% | 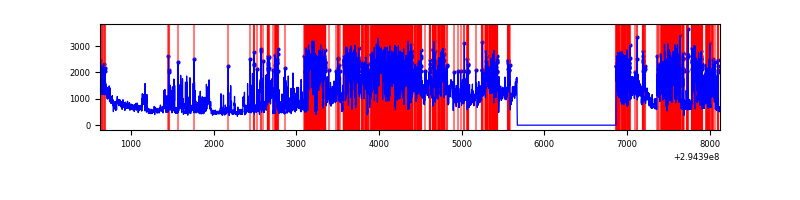 |
Top three noisy pixels from each quadrant. If the there are fewer than three noisy pixels in the level2.evt file, extra rows are filled as -1
| Pixel properties | Quadrant properties | ||||||
|---|---|---|---|---|---|---|---|
| Quadrant | DetID | PixID | Counts | Sigma | Mean | Median | Sigma |
| A | 5 | 16 | 90585 | 528.54 | 848 | 831 | 169.8 |
| A | 12 | 96 | 26312 | 150.05 | 848 | 831 | 169.8 |
| A | 13 | 254 | 10228 | 55.34 | 848 | 831 | 169.8 |
| B | 0 | 197 | 36061 | 223.55 | 842 | 824 | 157.6 |
| B | 15 | 32 | 33093 | 204.72 | 842 | 824 | 157.6 |
| B | 7 | 220 | 23885 | 146.3 | 842 | 824 | 157.6 |
| C | 14 | 238 | 128665 | 689.34 | 804 | 810 | 185.5 |
| C | 3 | 233 | 102772 | 549.73 | 804 | 810 | 185.5 |
| C | 13 | 61 | 5643 | 26.06 | 804 | 810 | 185.5 |
| D | 10 | 66 | 4604919 | 25059.01 | 762 | 741 | 183.7 |
| D | 5 | 222 | 473050 | 2570.62 | 762 | 741 | 183.7 |
| D | 7 | 238 | 138282 | 748.59 | 762 | 741 | 183.7 |
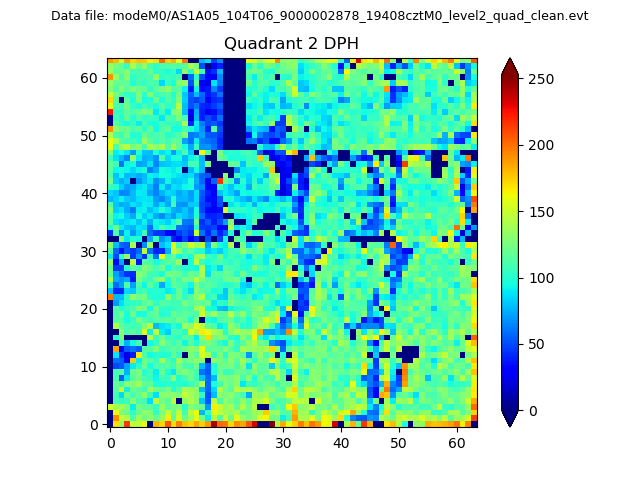
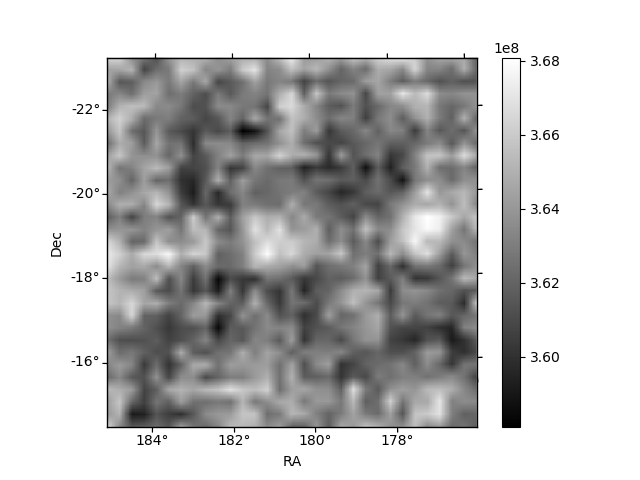
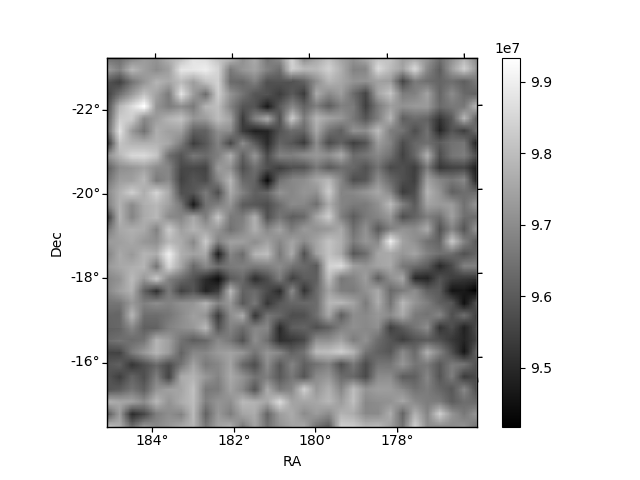
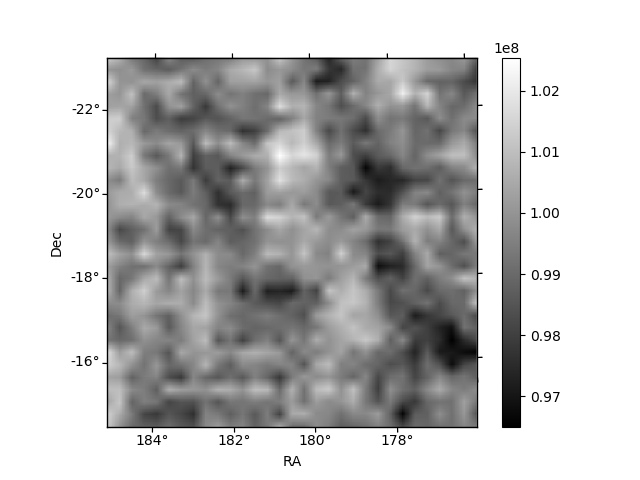
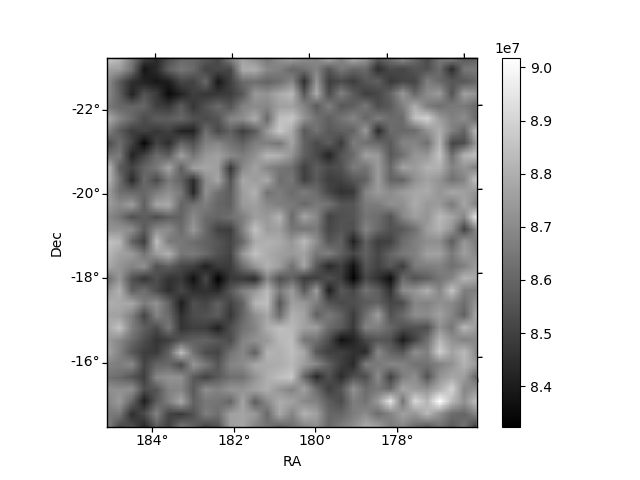
Histogram calculated using DETX and DETY for each event in the final _common_clean file
| Quadrant A | 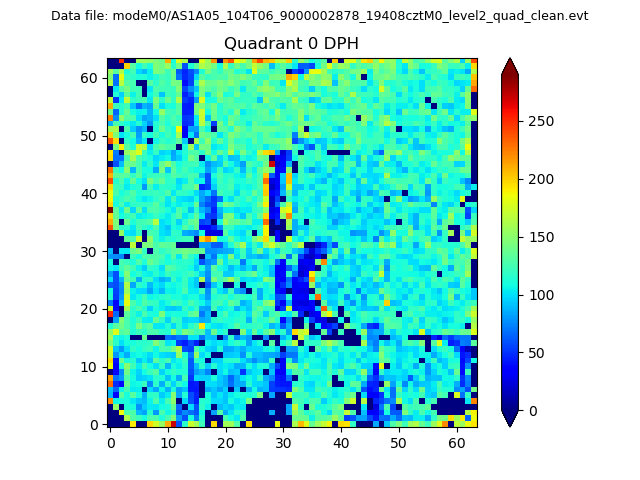 |
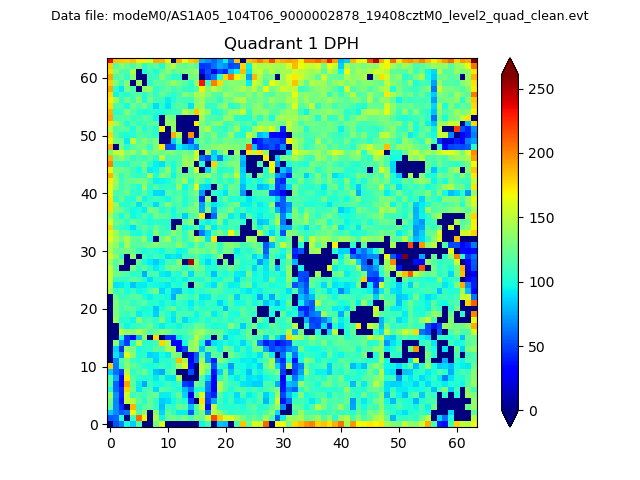 |
Quadrant B |
|---|---|---|---|
| Quadrant D | 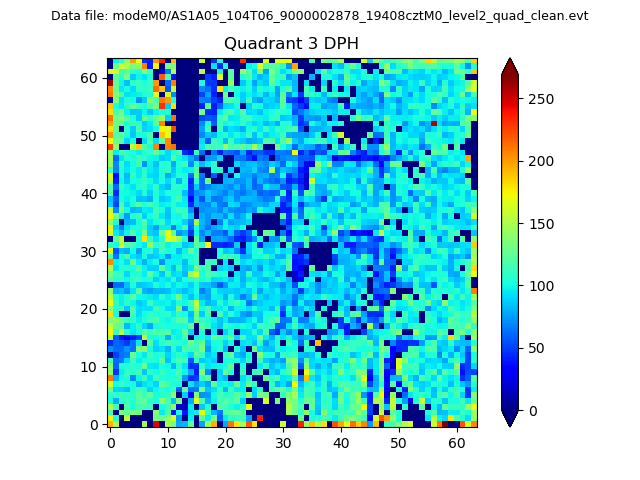 |
 |
Quadrant C |
| Plot type | Count rate plots | Images |
|---|---|---|
| Comparison with Poisson distribution Blue bars denote a histogram of data divided into 1 sec bins. Red curve is a Poisson curve with rate = median count rate of data. |
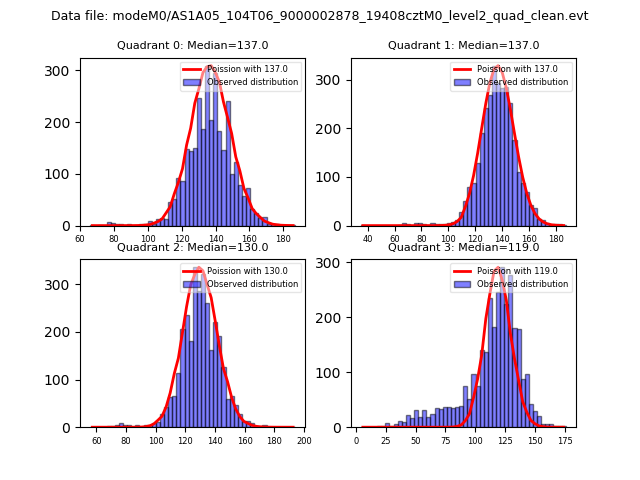 |
 |
| Quadrant-wise count rates Data is divided into 100 sec bins |
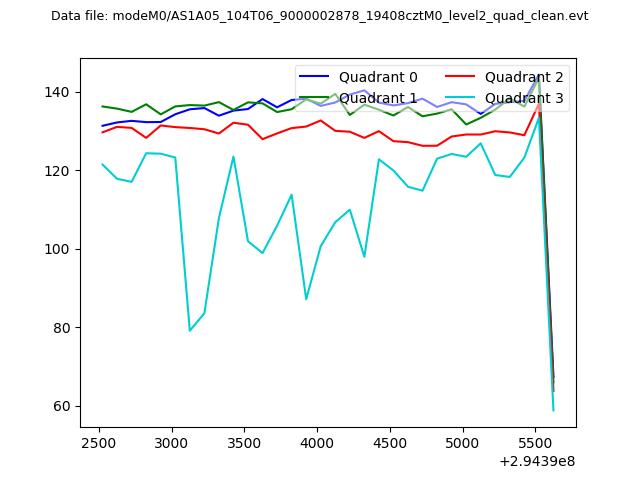 |
|
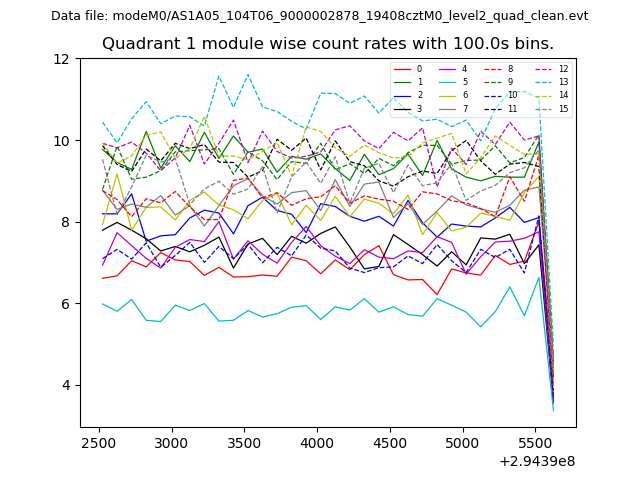
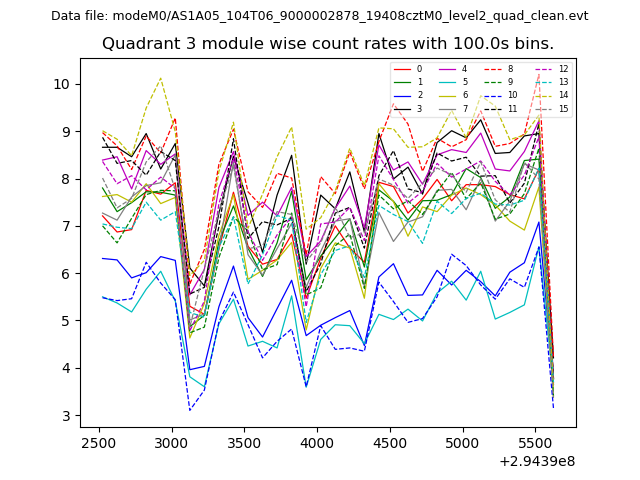
| Module-wise count rates for Quadrant A Data is divided into 100 sec bins |
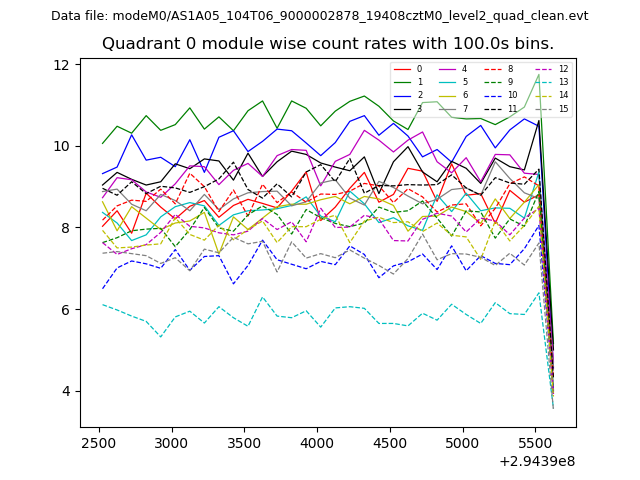 |
 |
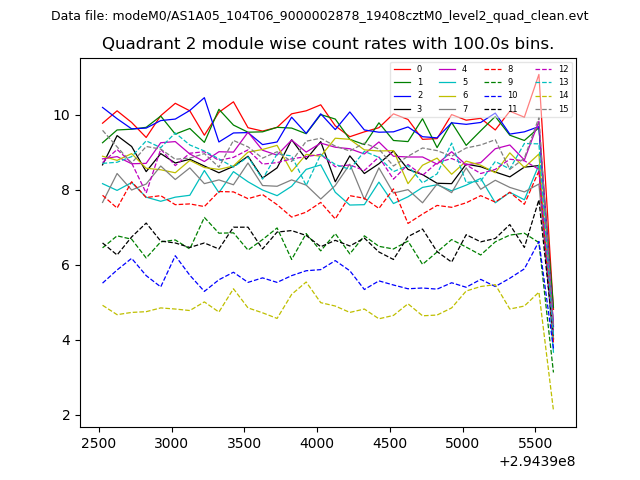
| Module-wise count rates for Quadrant B Data is divided into 100 sec bins |
 |
 |
| Module-wise count rates for Quadrant C Data is divided into 100 sec bins |
 |
 |
| Module-wise count rates for Quadrant D Data is divided into 100 sec bins |
 |
 |
| Parameter | Plot |
|---|---|
| CZT HV Monitor | 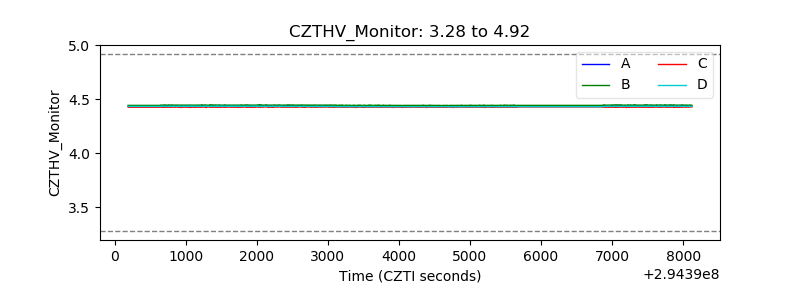 |
| D_VDD | 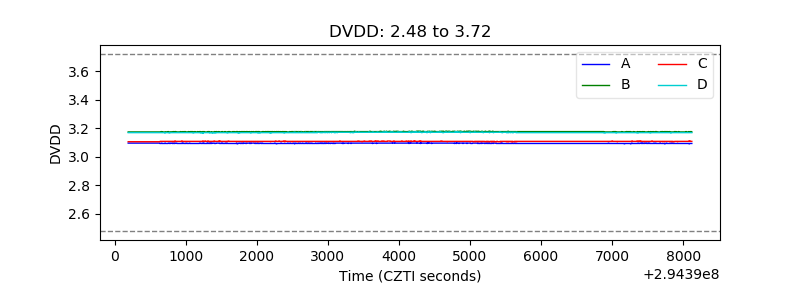 |
| Temperature 1 | 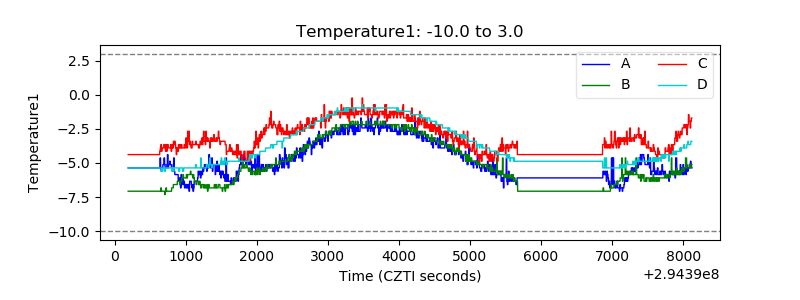 |
| Veto HV Monitor | 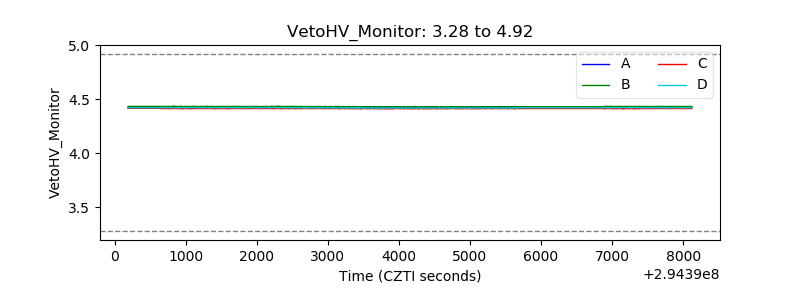 |
| Veto LLD | 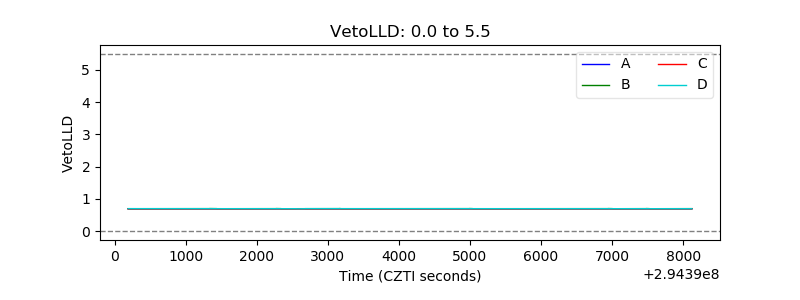 |
| Alpha Counter | 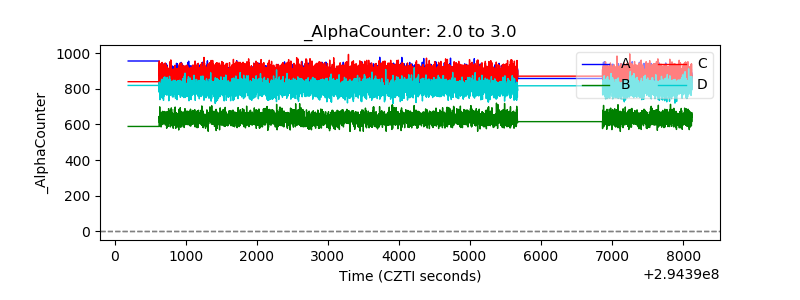 |
| _CPM_Rate | 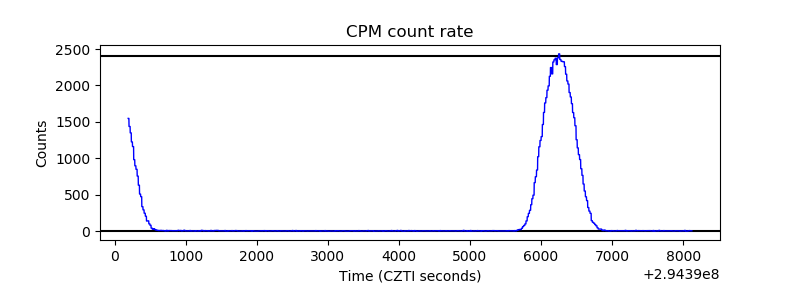 |
| CZT Counter | 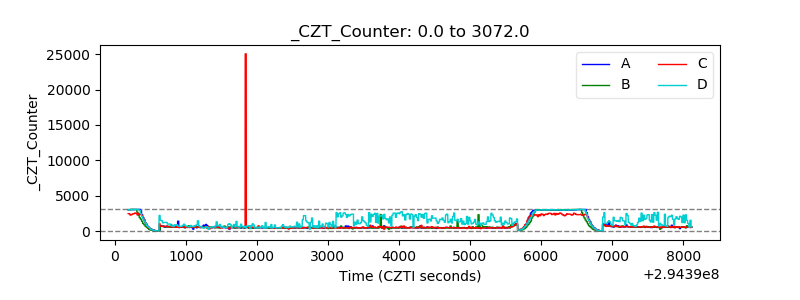 |
| +2.5 Volts monitor |  |
| +5 Volts monitor | 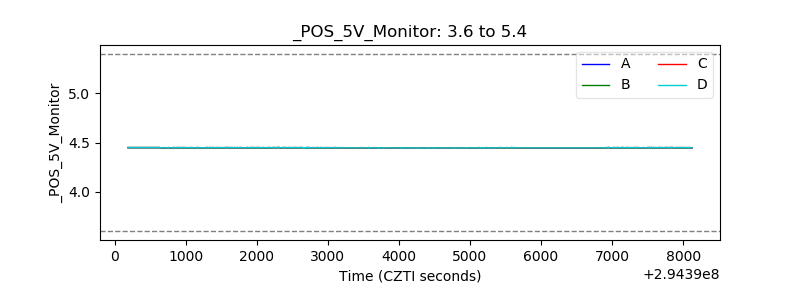 |
| _ROLL_ROT | 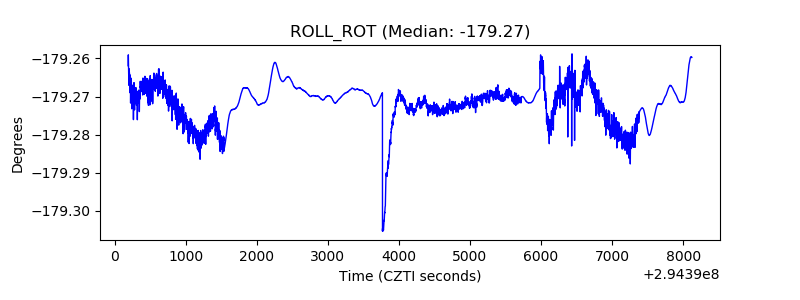 |
| _Roll_DEC | 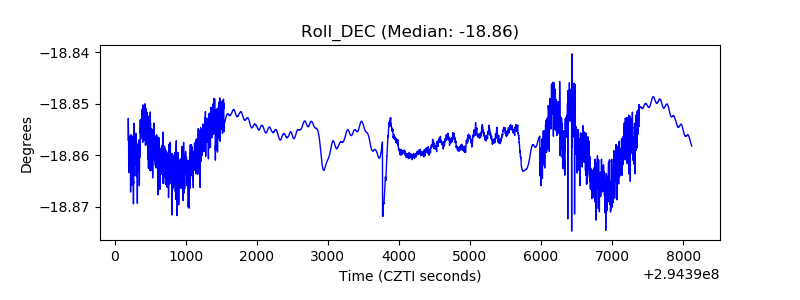 |
| _Roll_RA | 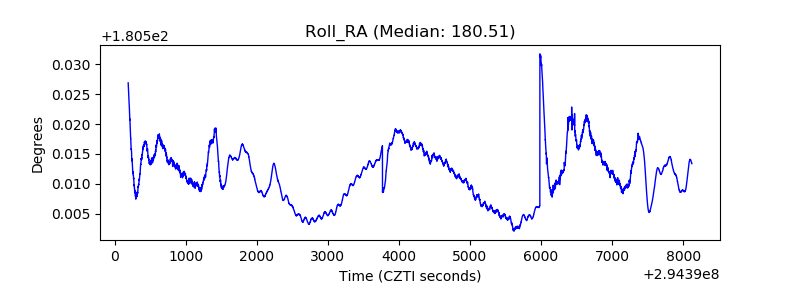 |
| Veto Counter | 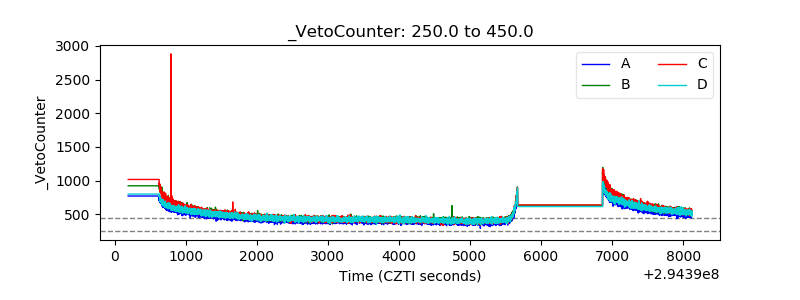 |