| Param | Original file | Final file |
|---|---|---|
| Filename | modeM0/AS1A05_104T06_9000002878_19409cztM0_level2.evt | modeM0/AS1A05_104T06_9000002878_19409cztM0_level2_quad_clean.evt |
| Size (bytes) | 455,728,320 | 57,098,880 |
| Size | 434.6 MB | 54.5 MB |
| Events in quadrant A | 2,268,480 | 390,085 |
| Events in quadrant B | 2,286,349 | 392,568 |
| Events in quadrant C | 2,251,560 | 370,745 |
| Events in quadrant D | 6,709,988 | 278,826 |
| Mode M9 | |||
|---|---|---|---|
| Quadrant | BADHDUFLAG | Total packets | Discarded packets |
| A | 0 | 5 | 0 |
| B | 0 | 6 | 0 |
| C | 0 | 6 | 0 |
| D | 0 | 6 | 0 |
| Mode SS | |||
|---|---|---|---|
| Quadrant | BADHDUFLAG | Total packets | Discarded packets |
| A | 0 | 84 | 0 |
| B | 0 | 84 | 0 |
| C | 0 | 84 | 0 |
| D | 0 | 84 | 0 |
| Mode M0 | |||
|---|---|---|---|
| Quadrant | BADHDUFLAG | Total packets | Discarded packets |
| A | 0 | 9172 | 1 |
| B | 0 | 9310 | 1 |
| C | 0 | 9202 | 1 |
| D | 0 | 22848 | 1 |
| Quadrant | Total seconds | Saturated seconds | Saturation percentage |
|---|---|---|---|
| A | 4201 | 31 | 0.737920% |
| B | 4201 | 27 | 0.642704% |
| C | 4201 | 49 | 1.166389% |
| D | 4201 | 1707 | 40.633183% |
Noise dominated data is calculated using 1-second bins in cleaned event files. If a bin has >2000 counts, and if more than 50% of those come from <1% of pixels, then it is considered to be noise-dominated and hence unusable.
| Quadrant | # 1 sec bins | Bins with >0 counts | Bins with >2000 counts | High rate bins dominated by noise | Noise dominated (total time) | Noise dominated (detector-on time) | Marked lightcurve |
|---|---|---|---|---|---|---|---|
| A | 4201 | 4201 | 4 | 4 | 0.10% | 0.10% | 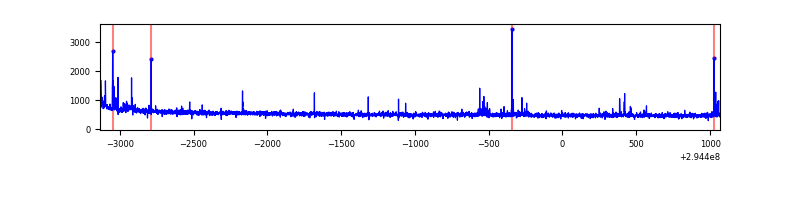 |
| B | 4201 | 4201 | 3 | 3 | 0.07% | 0.07% | 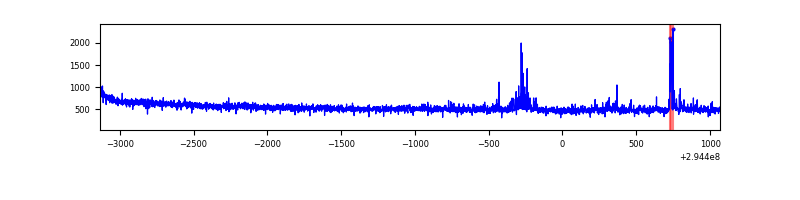 |
| C | 4201 | 4201 | 1 | 1 | 0.02% | 0.02% | 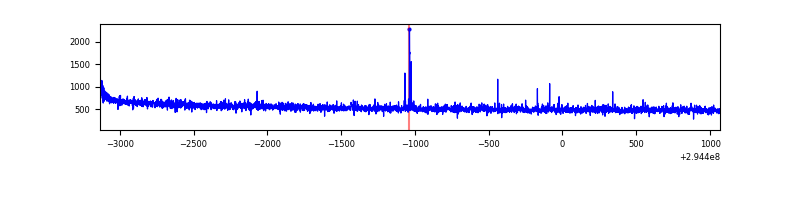 |
| D | 4200 | 4200 | 1548 | 1548 | 36.86% | 36.86% | 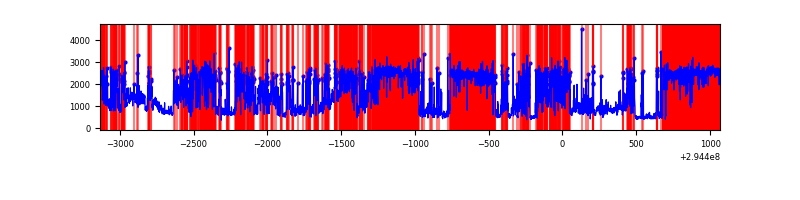 |
Top three noisy pixels from each quadrant. If the there are fewer than three noisy pixels in the level2.evt file, extra rows are filled as -1
| Pixel properties | Quadrant properties | ||||||
|---|---|---|---|---|---|---|---|
| Quadrant | DetID | PixID | Counts | Sigma | Mean | Median | Sigma |
| A | 5 | 16 | 64882 | 567.45 | 570 | 561 | 113.4 |
| A | 13 | 254 | 6380 | 51.34 | 570 | 561 | 113.4 |
| A | 0 | 226 | 4985 | 39.03 | 570 | 561 | 113.4 |
| B | 0 | 190 | 26451 | 247.23 | 564 | 552 | 104.8 |
| B | 7 | 220 | 21081 | 195.97 | 564 | 552 | 104.8 |
| B | 12 | 111 | 12002 | 109.3 | 564 | 552 | 104.8 |
| C | 14 | 238 | 86329 | 692.15 | 538 | 544 | 123.9 |
| C | 3 | 233 | 44236 | 352.52 | 538 | 544 | 123.9 |
| C | 0 | 207 | 16170 | 126.08 | 538 | 544 | 123.9 |
| D | 10 | 66 | 4510488 | 40175.58 | 464 | 451 | 112.3 |
| D | 5 | 222 | 195470 | 1737.24 | 464 | 451 | 112.3 |
| D | 7 | 238 | 178678 | 1587.65 | 464 | 451 | 112.3 |
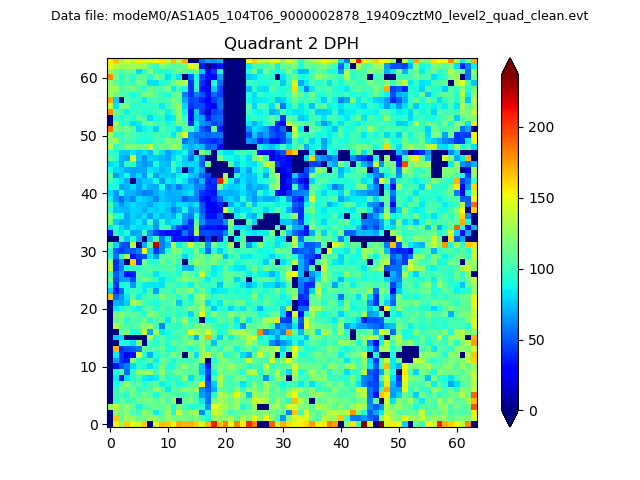
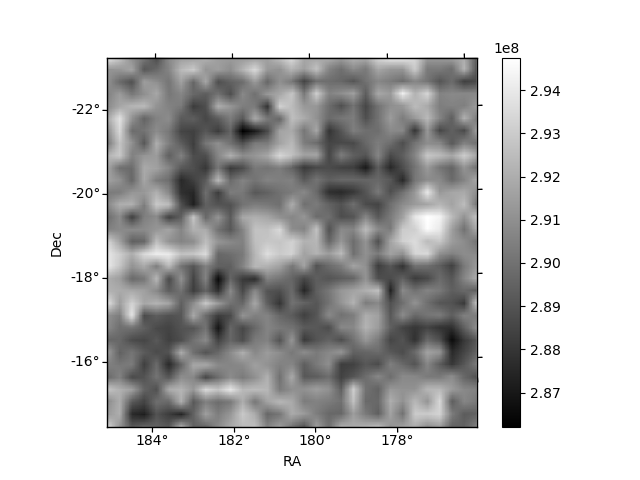
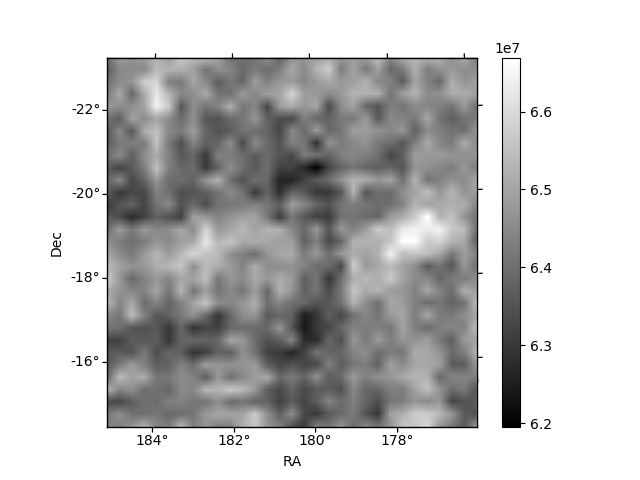
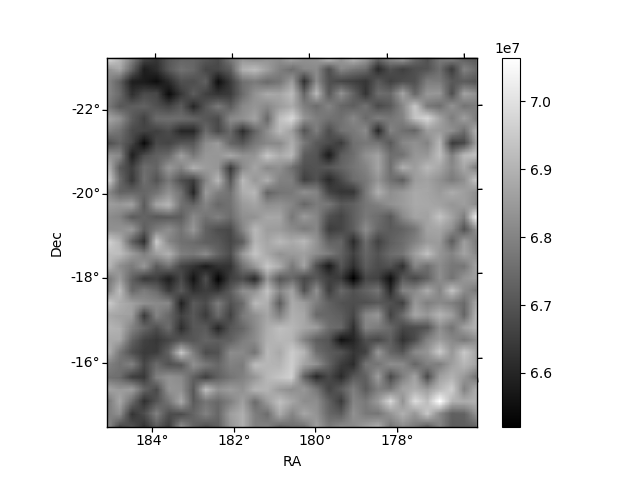
Histogram calculated using DETX and DETY for each event in the final _common_clean file
| Quadrant A | 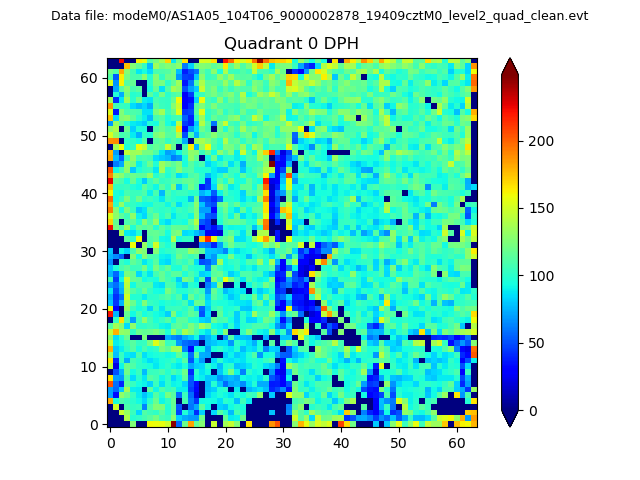 |
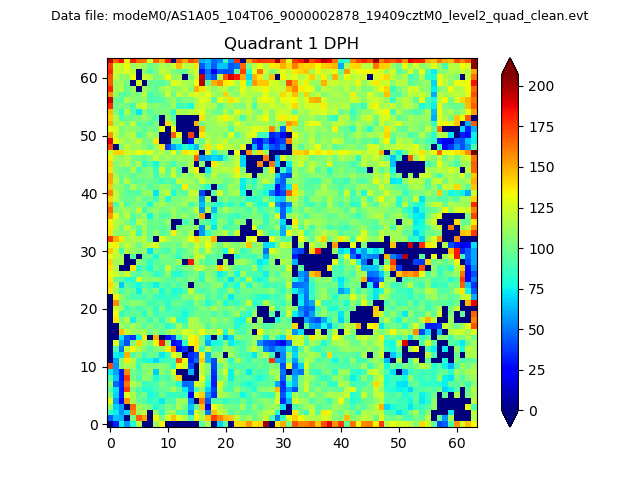 |
Quadrant B |
|---|---|---|---|
| Quadrant D | 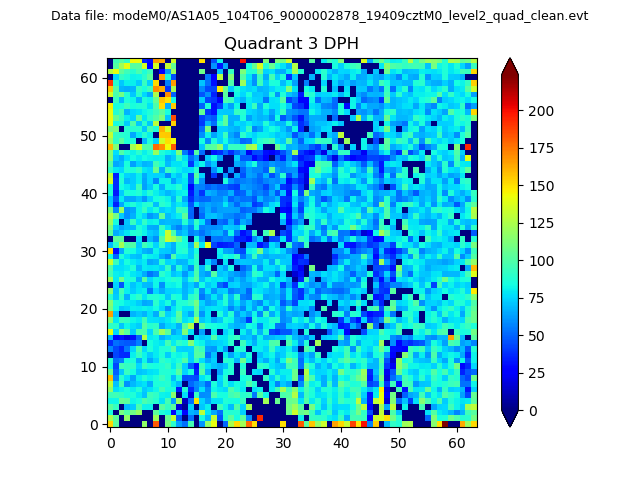 |
 |
Quadrant C |
| Plot type | Count rate plots | Images |
|---|---|---|
| Comparison with Poisson distribution Blue bars denote a histogram of data divided into 1 sec bins. Red curve is a Poisson curve with rate = median count rate of data. |
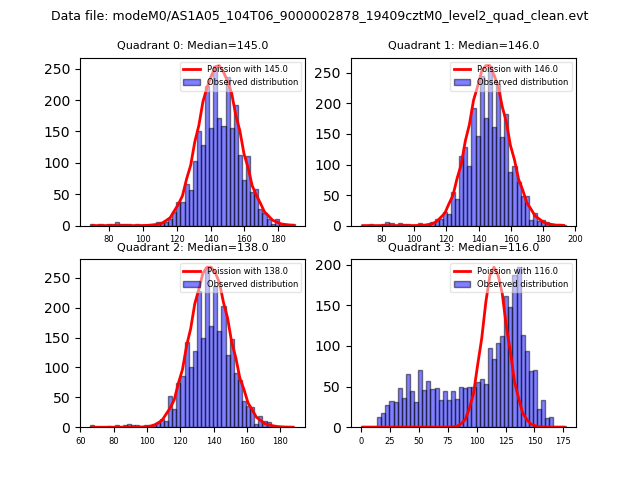 |
 |
| Quadrant-wise count rates Data is divided into 100 sec bins |
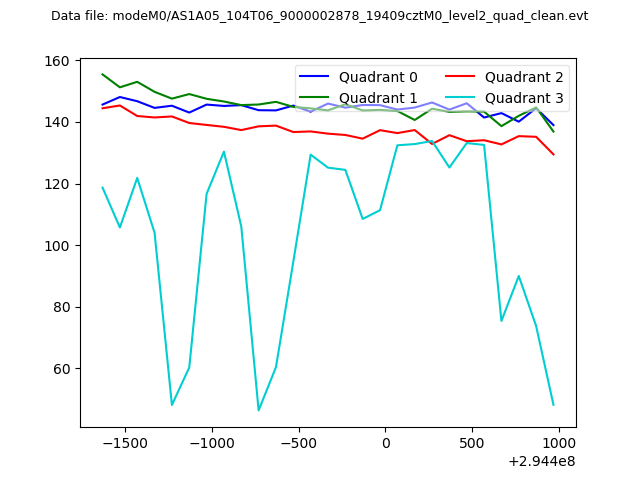 |
|
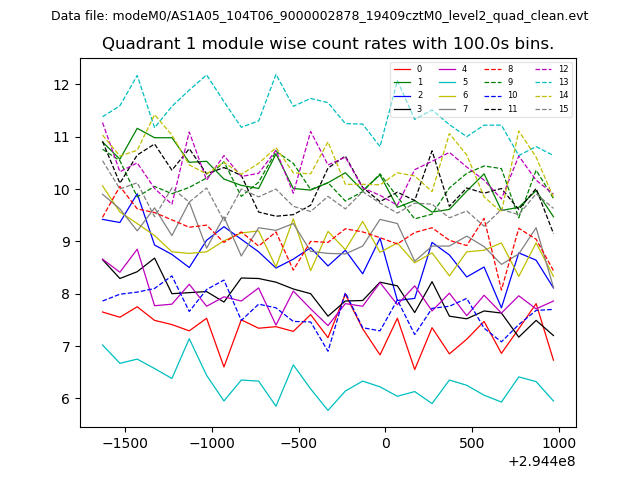
| Module-wise count rates for Quadrant A Data is divided into 100 sec bins |
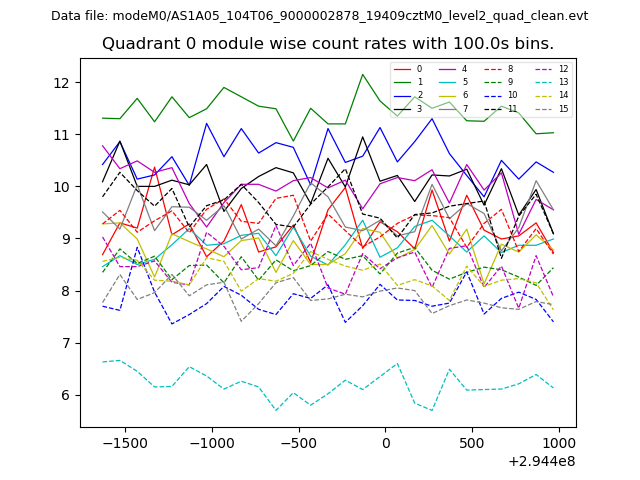 |
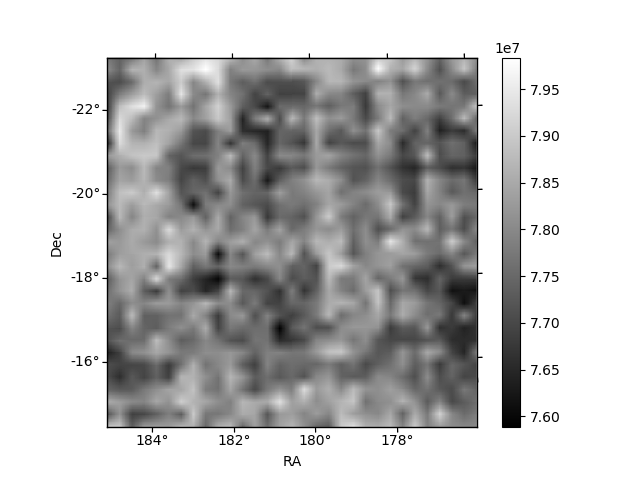 |
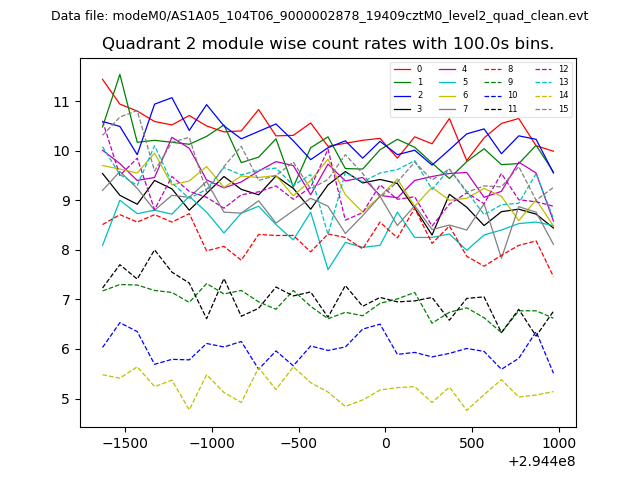
| Module-wise count rates for Quadrant B Data is divided into 100 sec bins |
 |
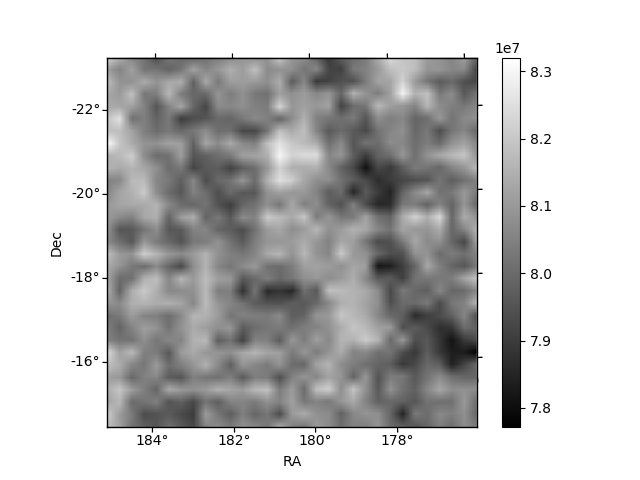 |
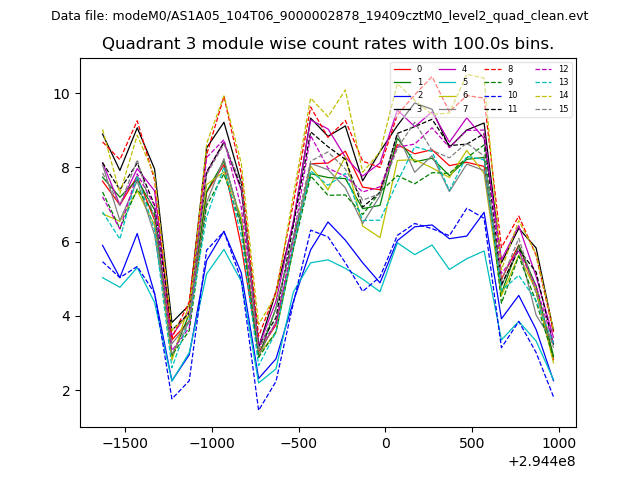
| Module-wise count rates for Quadrant C Data is divided into 100 sec bins |
 |
 |
| Module-wise count rates for Quadrant D Data is divided into 100 sec bins |
 |
 |
| Parameter | Plot |
|---|---|
| CZT HV Monitor | 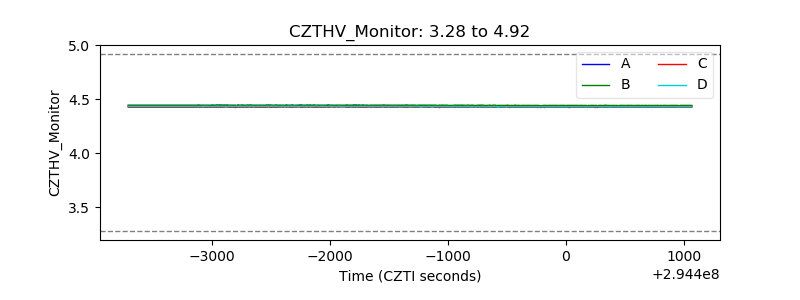 |
| D_VDD | 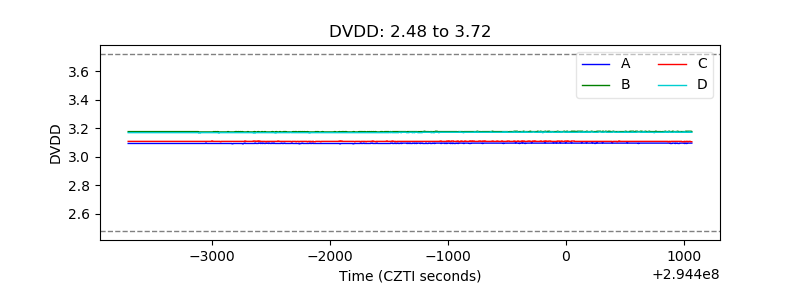 |
| Temperature 1 | 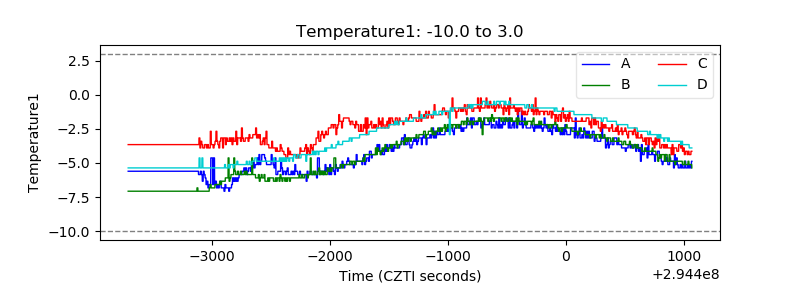 |
| Veto HV Monitor | 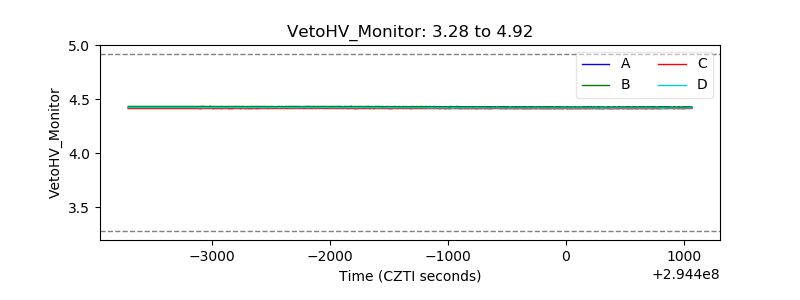 |
| Veto LLD | 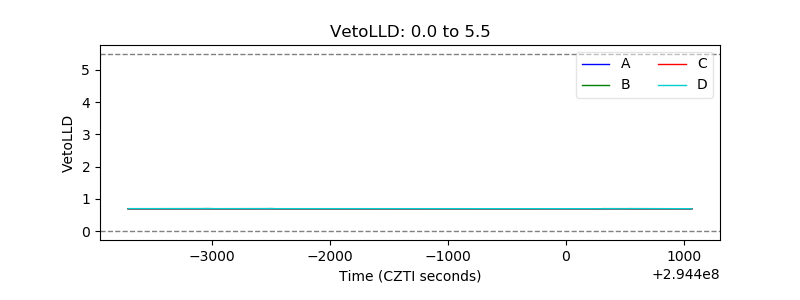 |
| Alpha Counter | 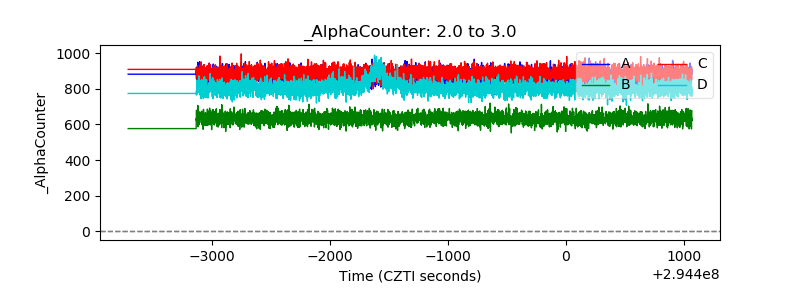 |
| _CPM_Rate | 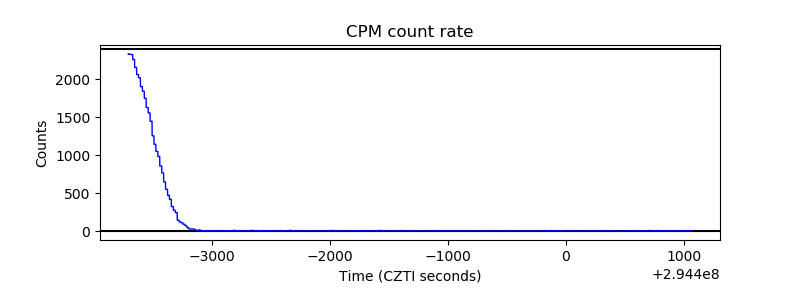 |
| CZT Counter | 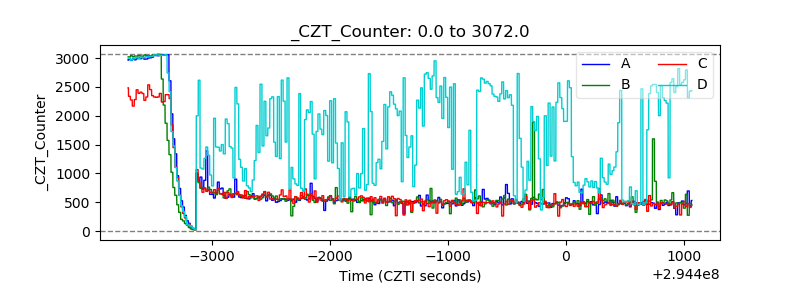 |
| +2.5 Volts monitor |  |
| +5 Volts monitor |  |
| _ROLL_ROT | 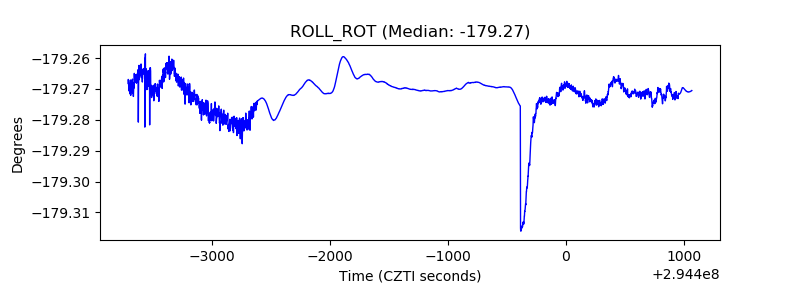 |
| _Roll_DEC | 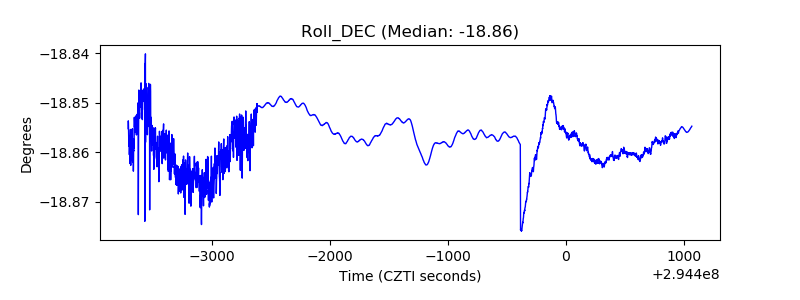 |
| _Roll_RA | 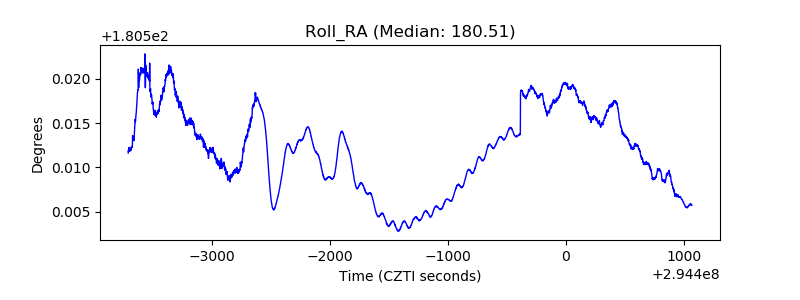 |
| Veto Counter | 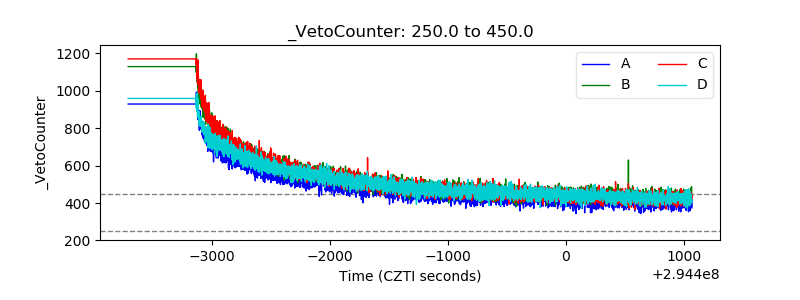 |