| Param | Original file | Final file |
|---|---|---|
| Filename | modeM0/AS1A05_226T09_9000002884cztM0_level2.fits | modeM0/AS1A05_226T09_9000002884cztM0_level2_quad_clean.evt |
| Size (bytes) | 334,817,280 | 293,342,400 |
| Size | 319.3 MB | 279.8 MB |
| Events in quadrant A | 2,092,110 | 1,812,693 |
| Events in quadrant B | 2,002,054 | 1,783,516 |
| Events in quadrant C | 2,016,394 | 1,675,335 |
| Events in quadrant D | 1,554,172 | 1,138,916 |
| Mode M0 | |||
|---|---|---|---|
| Quadrant | BADHDUFLAG | Total packets | Discarded packets |
| A | 0 | 74115 | 0 |
| B | 0 | 76759 | 0 |
| C | 0 | 74240 | 0 |
| D | 0 | 132434 | 0 |
| Mode M9 | |||
|---|---|---|---|
| Quadrant | BADHDUFLAG | Total packets | Discarded packets |
| A | 0 | 39 | 0 |
| B | 0 | 39 | 0 |
| C | 0 | 39 | 0 |
| D | 0 | 39 | 0 |
| Mode SS | |||
|---|---|---|---|
| Quadrant | BADHDUFLAG | Total packets | Discarded packets |
| A | 0 | 730 | 0 |
| B | 0 | 730 | 0 |
| C | 0 | 730 | 0 |
| D | 0 | 730 | 0 |
| Quadrant | Total seconds | Saturated seconds | Saturation percentage |
|---|---|---|---|
| A | 36000 | 139 | 0.386111% |
| B | 36000 | 331 | 0.919444% |
| C | 36000 | 282 | 0.783333% |
| D | 36000 | 7206 | 20.016667% |
Noise dominated data is calculated using 1-second bins in cleaned event files. If a bin has >2000 counts, and if more than 50% of those come from <1% of pixels, then it is considered to be noise-dominated and hence unusable.
| Quadrant | # 1 sec bins | Bins with >0 counts | Bins with >2000 counts | High rate bins dominated by noise | Noise dominated (total time) | Noise dominated (detector-on time) | Marked lightcurve |
|---|---|---|---|---|---|---|---|
| A | 39850 | 35998 | 0 | 0 | 0.00% | 0.00% | 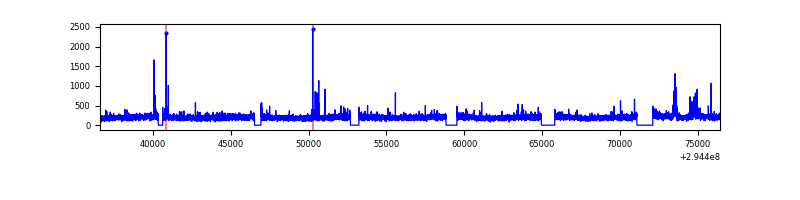 |
| B | 39850 | 35995 | 0 | 0 | 0.00% | 0.00% | 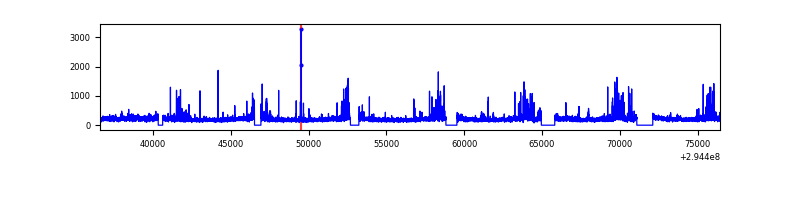 |
| C | 39850 | 35997 | 0 | 0 | 0.00% | 0.00% | 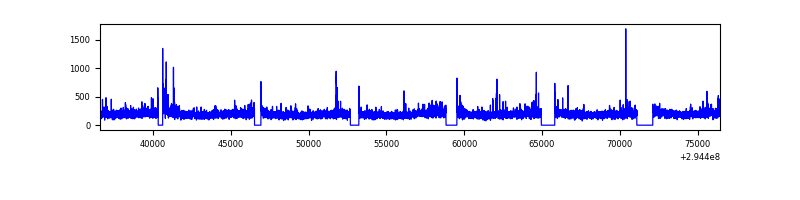 |
| D | 39850 | 35810 | 0 | 0 | 0.00% | 0.00% | 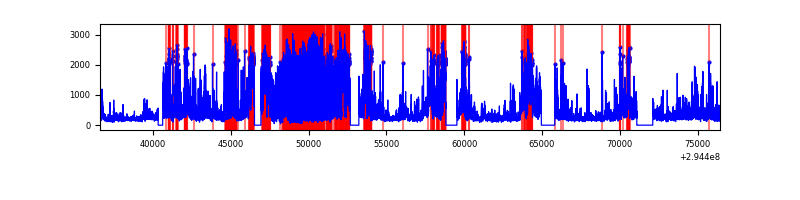 |
Top three noisy pixels from each quadrant. If the there are fewer than three noisy pixels in the level2.evt file, extra rows are filled as -1
| Pixel properties | Quadrant properties | ||||||
|---|---|---|---|---|---|---|---|
| Quadrant | DetID | PixID | Counts | Sigma | Mean | Median | Sigma |
| A | 0 | 29 | 2119 | 11.85 | 545 | 510 | 135.8 |
| A | 7 | 110 | 1781 | 9.36 | 545 | 510 | 135.8 |
| A | 0 | 30 | 1625 | 8.21 | 545 | 510 | 135.8 |
| B | 2 | 9 | 1701 | 11.25 | 528 | 503 | 106.4 |
| B | 2 | 8 | 1491 | 9.28 | 528 | 503 | 106.4 |
| B | 5 | 225 | 1359 | 8.04 | 528 | 503 | 106.4 |
| C | 12 | 241 | 1447 | 7.02 | 532 | 496 | 135.6 |
| C | 9 | 233 | 1366 | 6.42 | 532 | 496 | 135.6 |
| C | 2 | 191 | 1342 | 6.24 | 532 | 496 | 135.6 |
| D | 3 | 14 | 1152 | 6.31 | 444 | 404 | 118.6 |
| D | 1 | 19 | 1105 | 5.91 | 444 | 404 | 118.6 |
| D | 6 | 38 | 1087 | 5.76 | 444 | 404 | 118.6 |
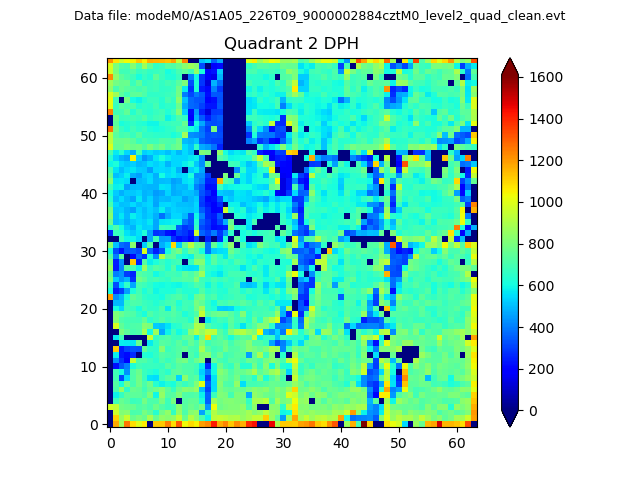
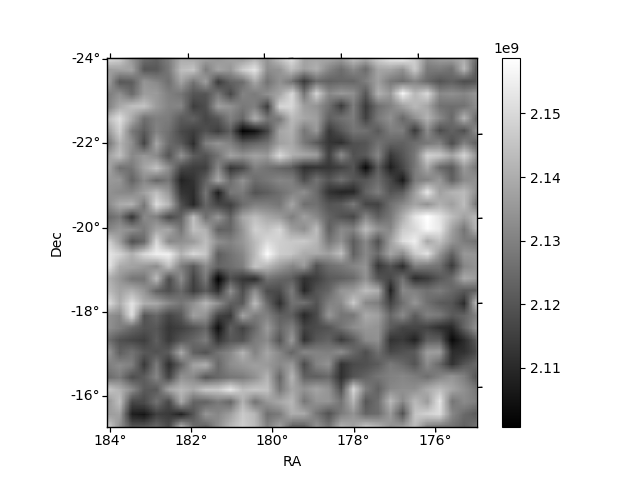
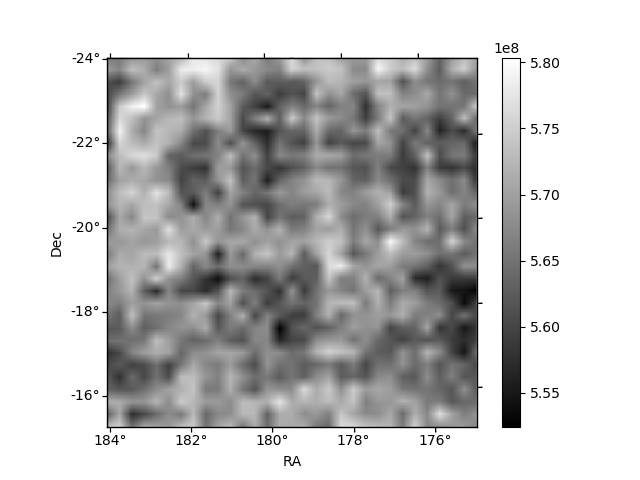
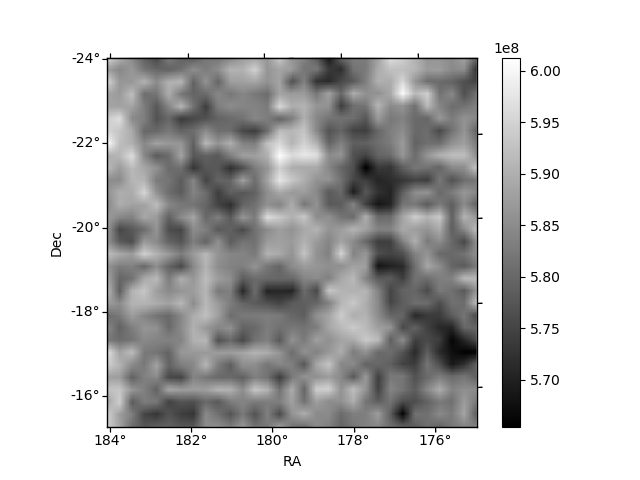
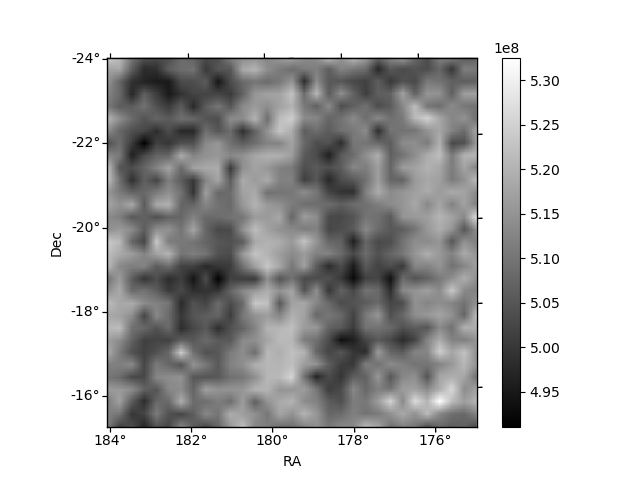
Histogram calculated using DETX and DETY for each event in the final _common_clean file
| Quadrant A | 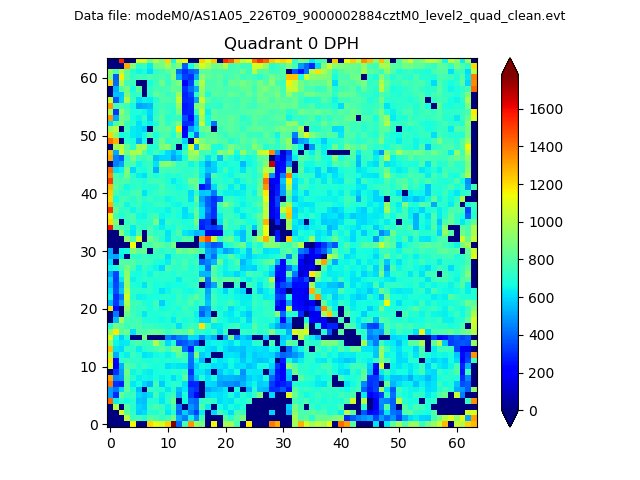 |
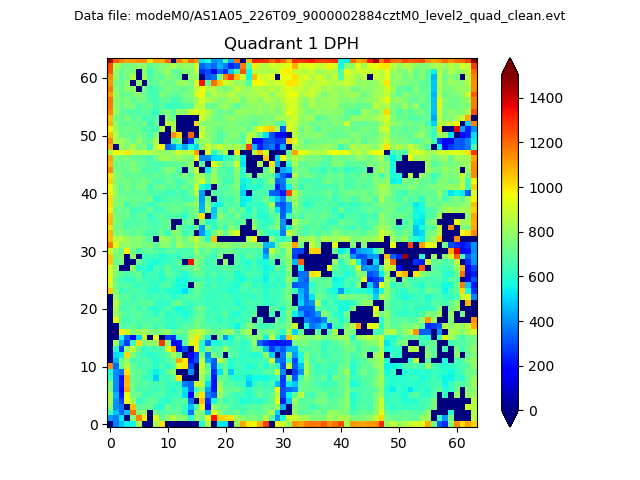 |
Quadrant B |
|---|---|---|---|
| Quadrant D | 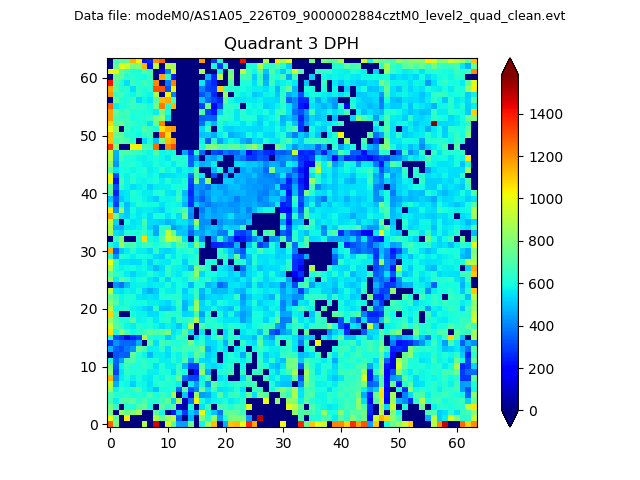 |
 |
Quadrant C |
| Plot type | Count rate plots | Images |
|---|---|---|
| Comparison with Poisson distribution Blue bars denote a histogram of data divided into 1 sec bins. Red curve is a Poisson curve with rate = median count rate of data. |
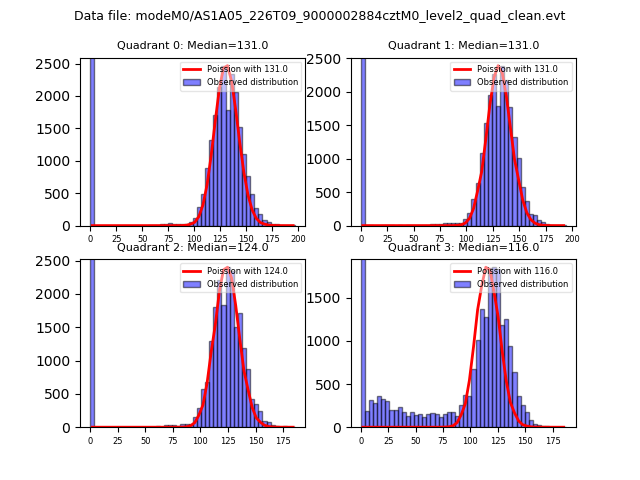 |
 |
| Quadrant-wise count rates Data is divided into 100 sec bins |
 |
|
| Module-wise count rates for Quadrant A Data is divided into 100 sec bins |
 |
 |
| Module-wise count rates for Quadrant B Data is divided into 100 sec bins |
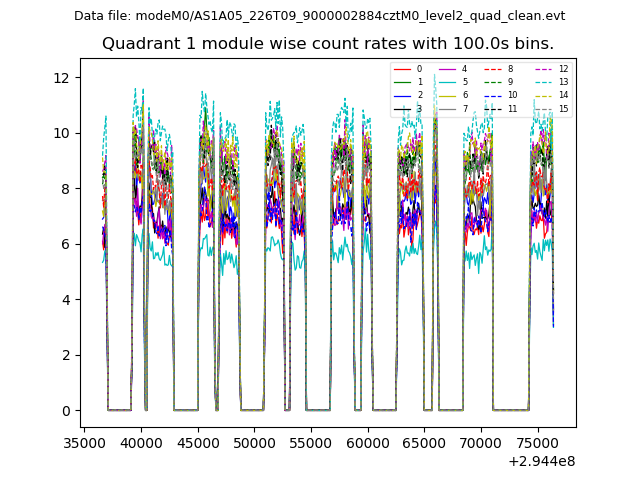 |
 |
| Module-wise count rates for Quadrant C Data is divided into 100 sec bins |
 |
 |
| Module-wise count rates for Quadrant D Data is divided into 100 sec bins |
 |
 |
| Parameter | Plot |
|---|---|
| CZT HV Monitor | 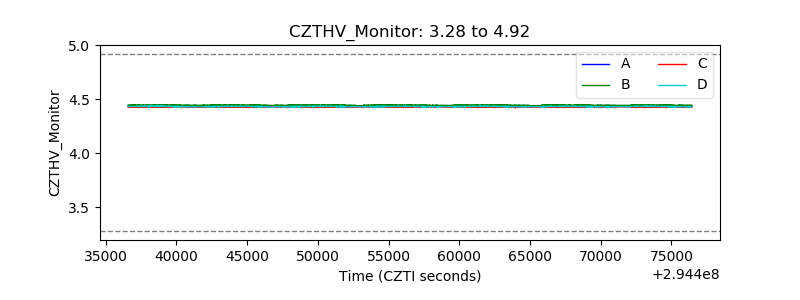 |
| D_VDD | 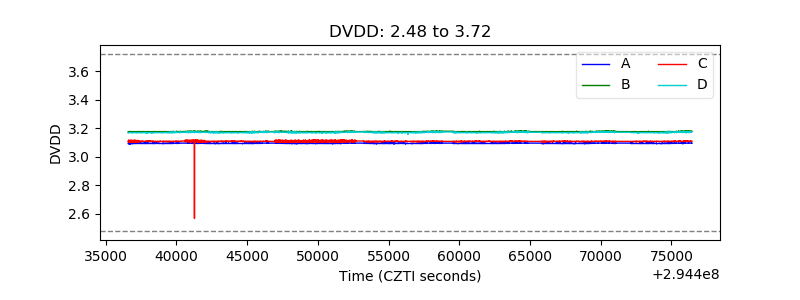 |
| Temperature 1 | 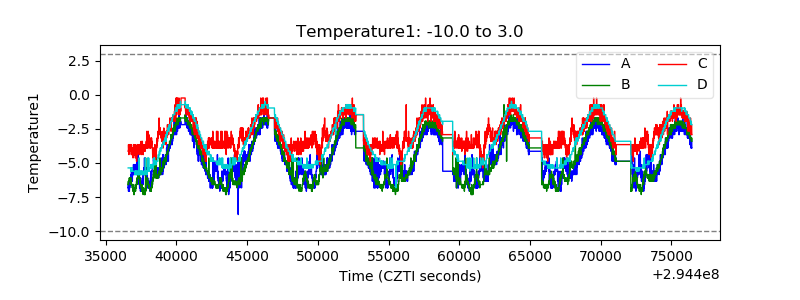 |
| Veto HV Monitor | 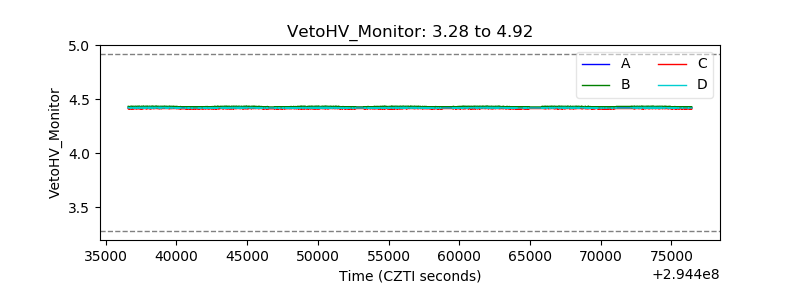 |
| Veto LLD |  |
| Alpha Counter | 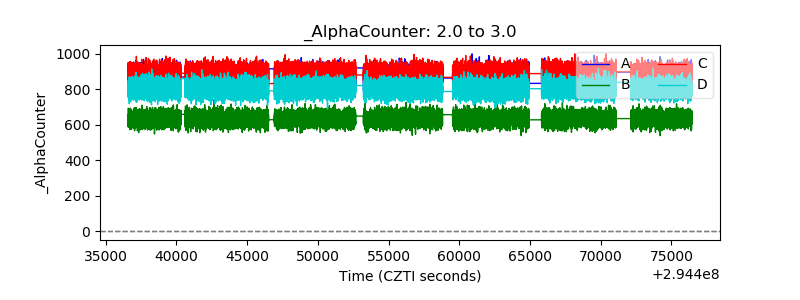 |
| _CPM_Rate | 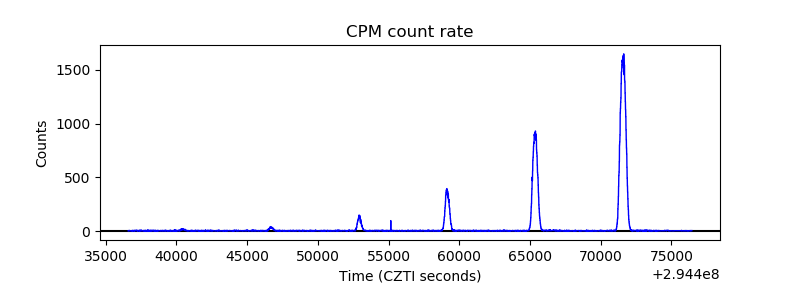 |
| CZT Counter |  |
| +2.5 Volts monitor |  |
| +5 Volts monitor |  |
| _ROLL_ROT | 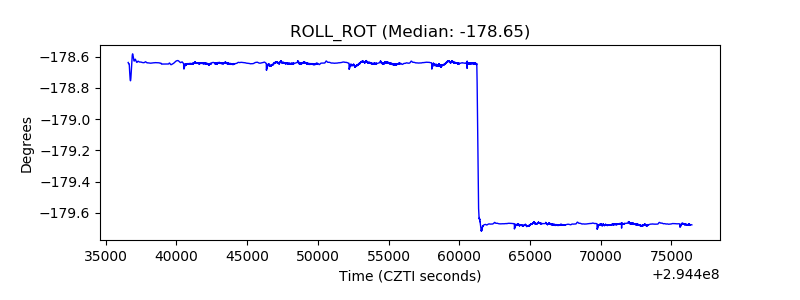 |
| _Roll_DEC | 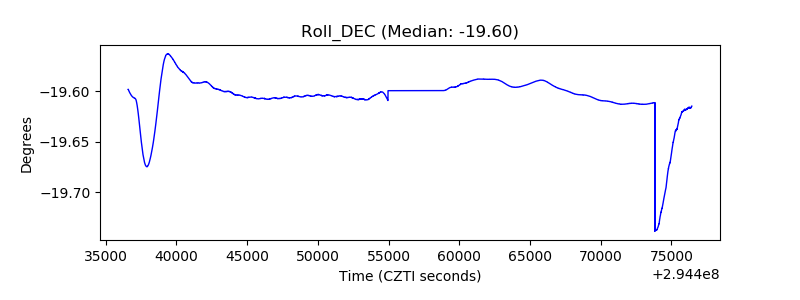 |
| _Roll_RA | 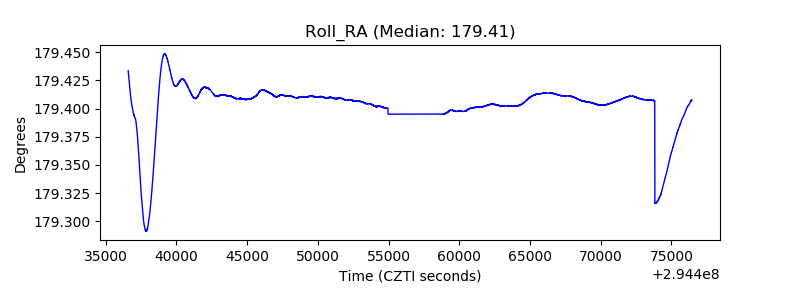 |
| Veto Counter | 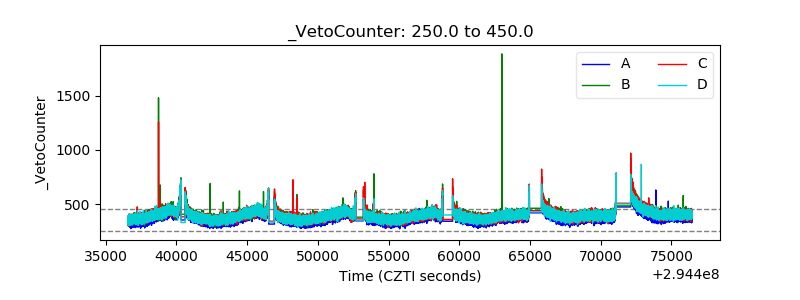 |