| Param | Original file | Final file |
|---|---|---|
| Filename | modeM0/AS1A05_226T09_9000002884_19415cztM0_level2.evt | modeM0/AS1A05_226T09_9000002884_19415cztM0_level2_quad_clean.evt |
| Size (bytes) | 391,484,160 | 63,489,600 |
| Size | 373.3 MB | 60.5 MB |
| Events in quadrant A | 2,549,612 | 403,160 |
| Events in quadrant B | 2,712,942 | 404,268 |
| Events in quadrant C | 2,666,983 | 380,084 |
| Events in quadrant D | 3,567,635 | 365,070 |
| Mode M0 | |||
|---|---|---|---|
| Quadrant | BADHDUFLAG | Total packets | Discarded packets |
| A | 0 | 11018 | 1 |
| B | 0 | 11299 | 2 |
| C | 0 | 11262 | 1 |
| D | 0 | 14147 | 1 |
| Mode M9 | |||
|---|---|---|---|
| Quadrant | BADHDUFLAG | Total packets | Discarded packets |
| A | 0 | 3 | 0 |
| B | 0 | 3 | 0 |
| C | 0 | 3 | 0 |
| D | 0 | 3 | 0 |
| Mode SS | |||
|---|---|---|---|
| Quadrant | BADHDUFLAG | Total packets | Discarded packets |
| A | 0 | 106 | 0 |
| B | 0 | 106 | 0 |
| C | 0 | 106 | 0 |
| D | 0 | 106 | 0 |
| Quadrant | Total seconds | Saturated seconds | Saturation percentage |
|---|---|---|---|
| A | 5283 | 35 | 0.662502% |
| B | 5282 | 49 | 0.927679% |
| C | 5282 | 65 | 1.230594% |
| D | 5282 | 180 | 3.407800% |
Noise dominated data is calculated using 1-second bins in cleaned event files. If a bin has >2000 counts, and if more than 50% of those come from <1% of pixels, then it is considered to be noise-dominated and hence unusable.
| Quadrant | # 1 sec bins | Bins with >0 counts | Bins with >2000 counts | High rate bins dominated by noise | Noise dominated (total time) | Noise dominated (detector-on time) | Marked lightcurve |
|---|---|---|---|---|---|---|---|
| A | 5573 | 5284 | 3 | 3 | 0.05% | 0.06% | 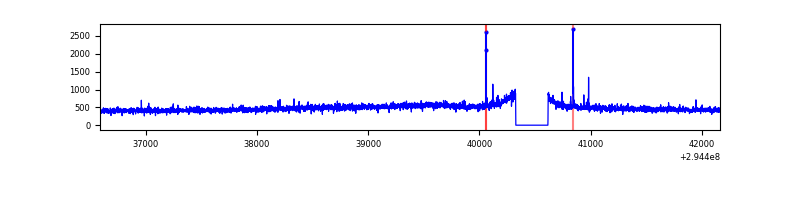 |
| B | 5572 | 5283 | 3 | 3 | 0.05% | 0.06% | 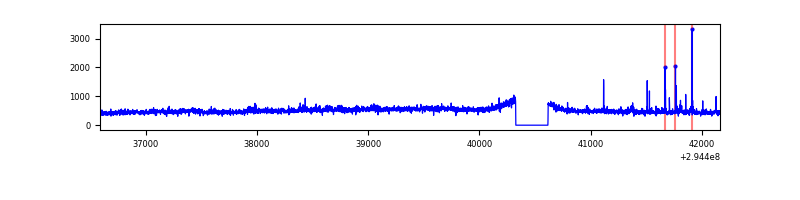 |
| C | 5572 | 5283 | 1 | 1 | 0.02% | 0.02% | 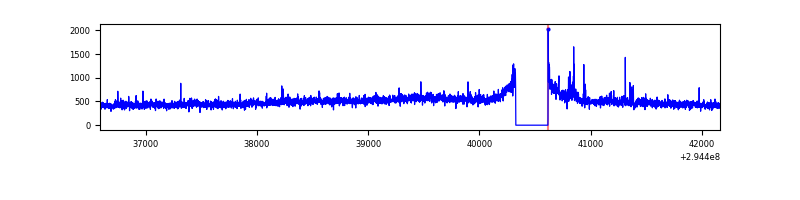 |
| D | 5571 | 5282 | 162 | 162 | 2.91% | 3.07% | 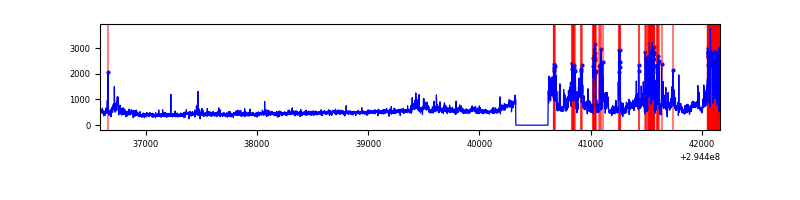 |
Top three noisy pixels from each quadrant. If the there are fewer than three noisy pixels in the level2.evt file, extra rows are filled as -1
| Pixel properties | Quadrant properties | ||||||
|---|---|---|---|---|---|---|---|
| Quadrant | DetID | PixID | Counts | Sigma | Mean | Median | Sigma |
| A | 12 | 96 | 17226 | 123.94 | 655 | 641 | 133.8 |
| A | 13 | 254 | 8488 | 58.64 | 655 | 641 | 133.8 |
| A | 0 | 226 | 5798 | 38.54 | 655 | 641 | 133.8 |
| B | 0 | 198 | 82401 | 646.21 | 652 | 633 | 126.5 |
| B | 4 | 174 | 36844 | 286.18 | 652 | 633 | 126.5 |
| B | 12 | 111 | 15090 | 114.25 | 652 | 633 | 126.5 |
| C | 3 | 233 | 111034 | 756.96 | 620 | 623 | 145.9 |
| C | 14 | 238 | 94841 | 645.94 | 620 | 623 | 145.9 |
| C | 9 | 221 | 23848 | 159.23 | 620 | 623 | 145.9 |
| D | 7 | 238 | 857234 | 5631.36 | 623 | 604 | 152.1 |
| D | 1 | 52 | 284163 | 1864.07 | 623 | 604 | 152.1 |
| D | 2 | 234 | 21711 | 138.75 | 623 | 604 | 152.1 |
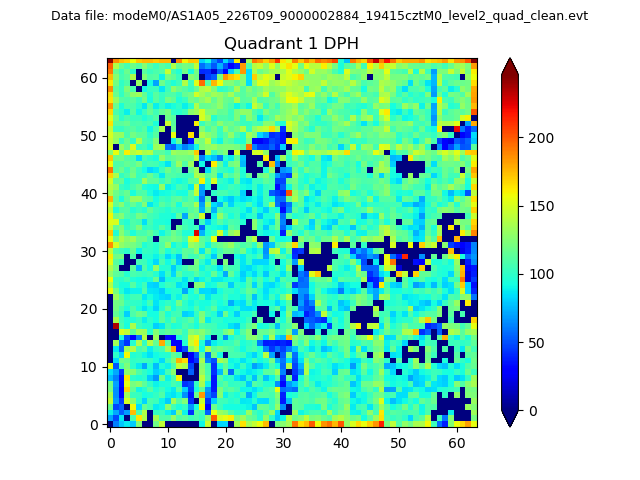
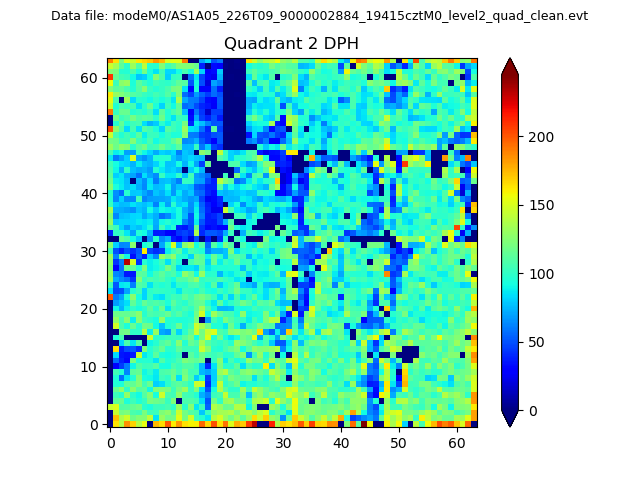
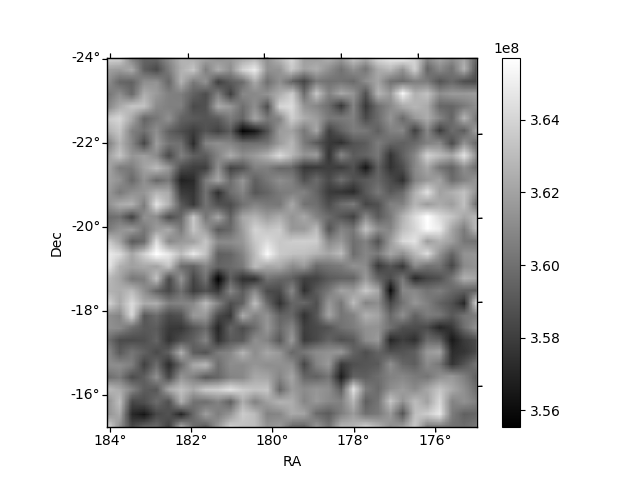
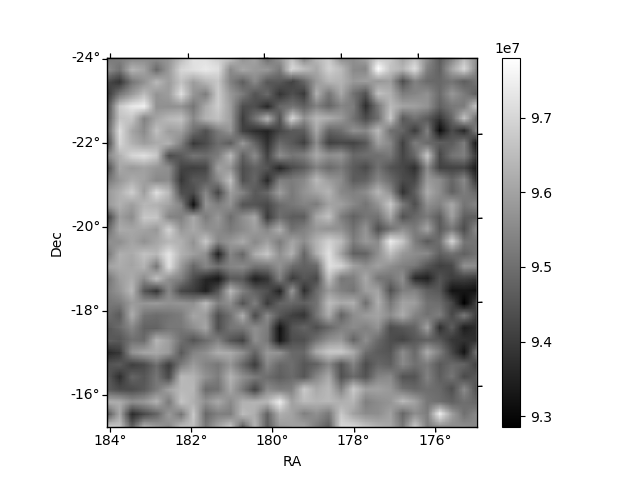
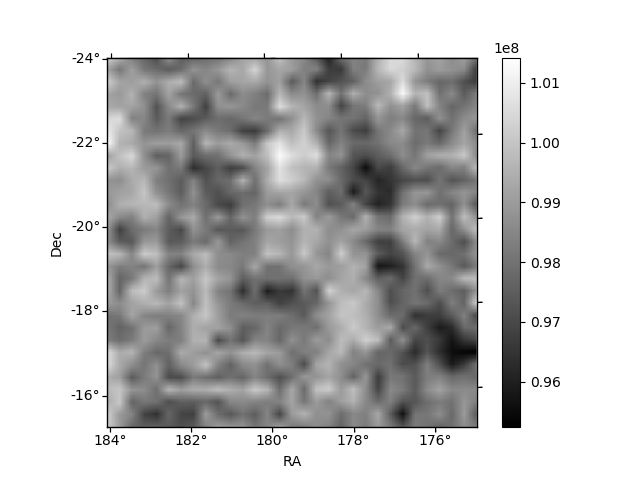
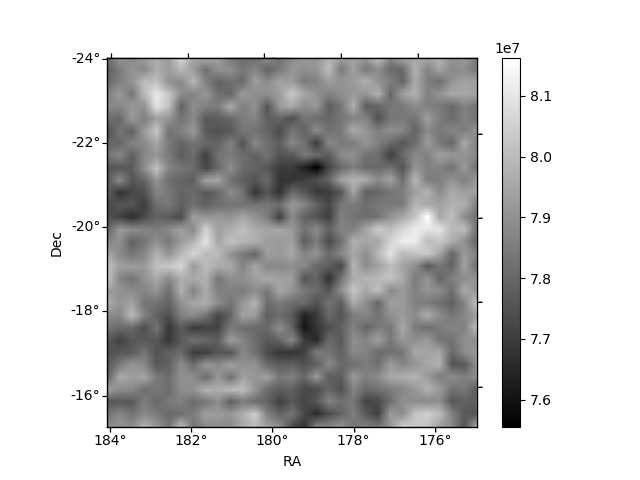
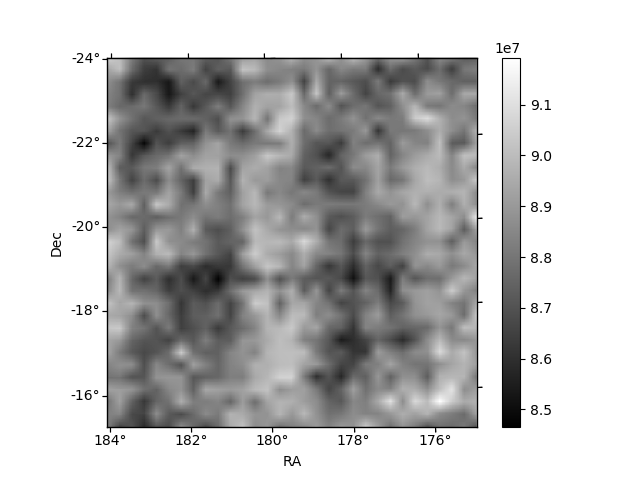
Histogram calculated using DETX and DETY for each event in the final _common_clean file
| Quadrant A |  |
 |
Quadrant B |
|---|---|---|---|
| Quadrant D | 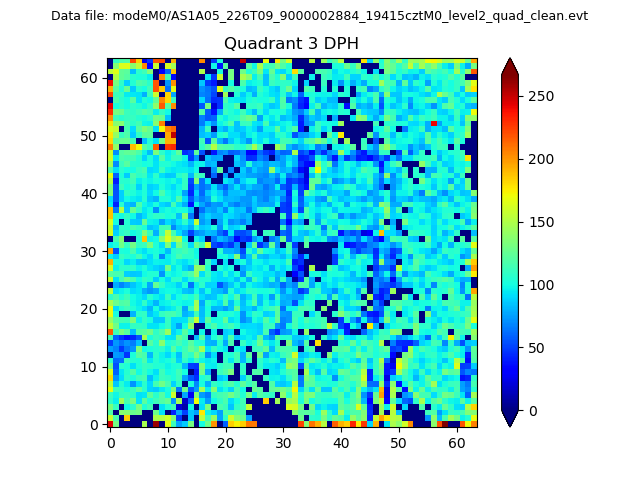 |
 |
Quadrant C |
| Plot type | Count rate plots | Images |
|---|---|---|
| Comparison with Poisson distribution Blue bars denote a histogram of data divided into 1 sec bins. Red curve is a Poisson curve with rate = median count rate of data. |
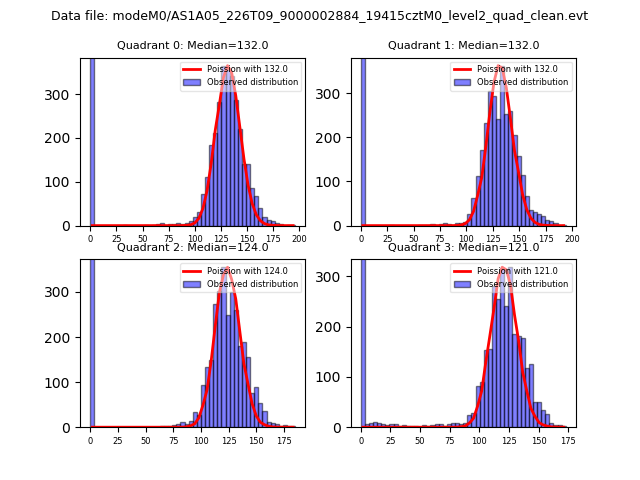 |
 |
| Quadrant-wise count rates Data is divided into 100 sec bins |
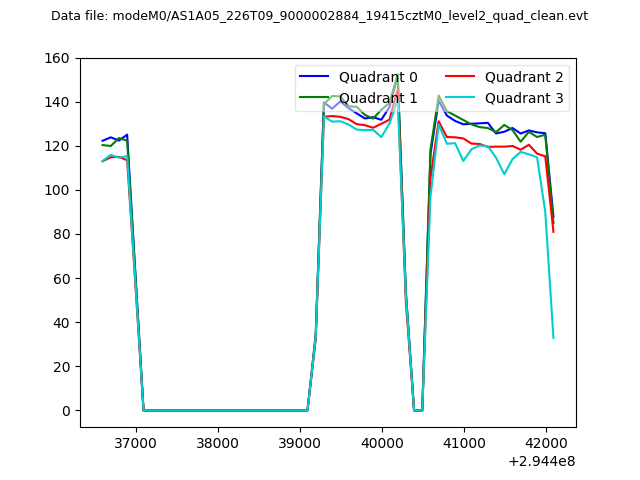 |
|
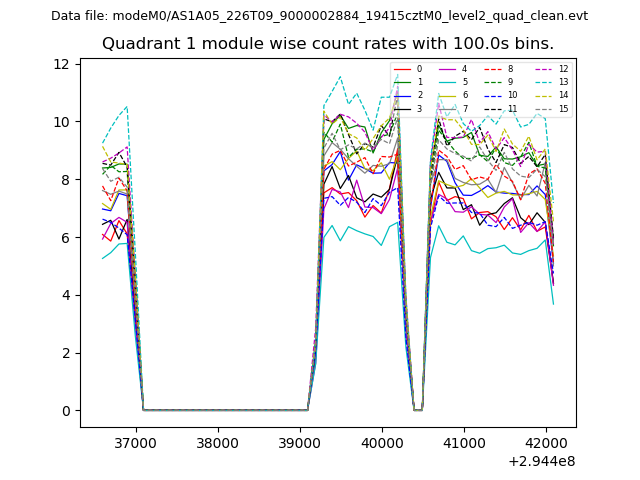
| Module-wise count rates for Quadrant A Data is divided into 100 sec bins |
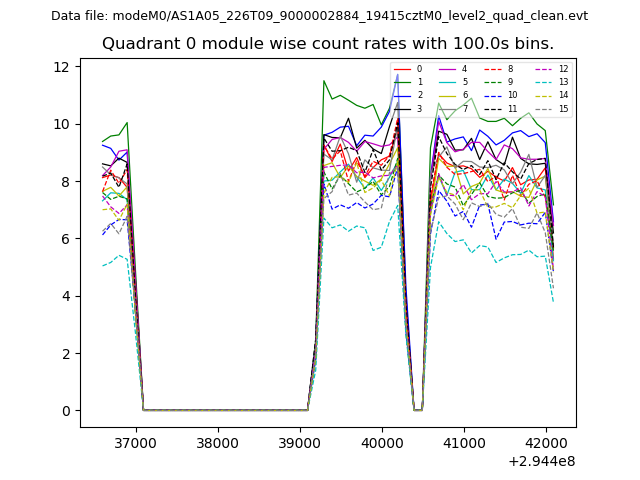 |
 |
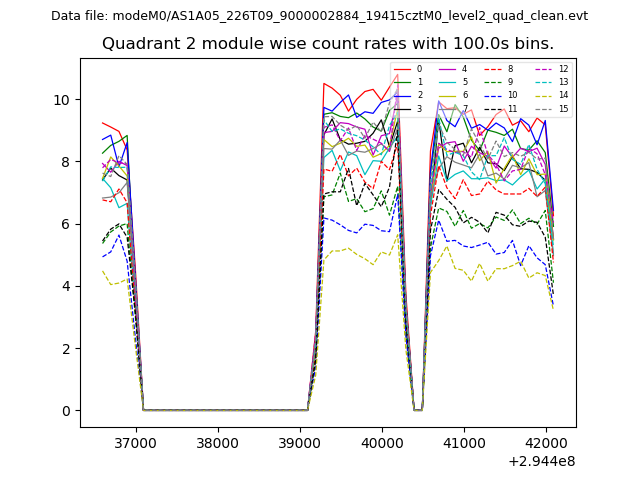
| Module-wise count rates for Quadrant B Data is divided into 100 sec bins |
 |
 |
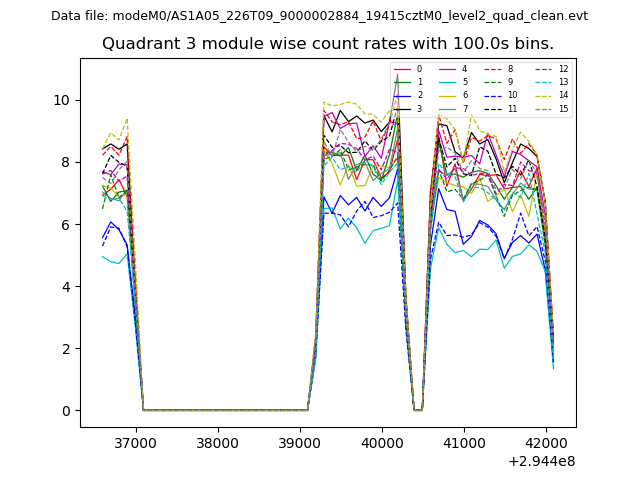
| Module-wise count rates for Quadrant C Data is divided into 100 sec bins |
 |
 |
| Module-wise count rates for Quadrant D Data is divided into 100 sec bins |
 |
 |
| Parameter | Plot |
|---|---|
| CZT HV Monitor | 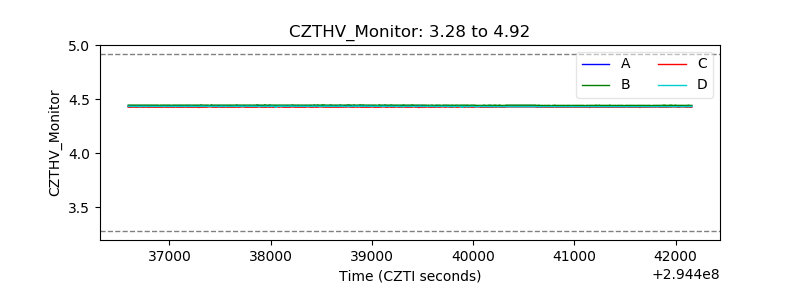 |
| D_VDD | 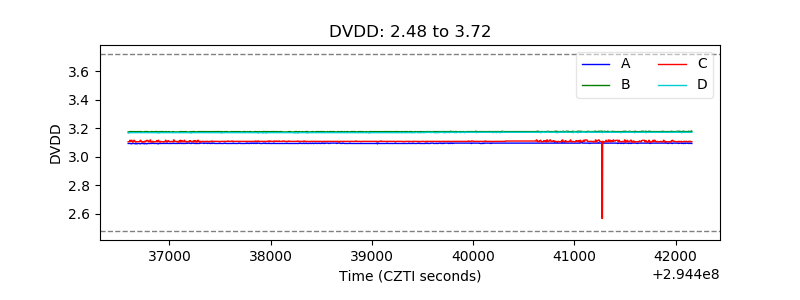 |
| Temperature 1 | 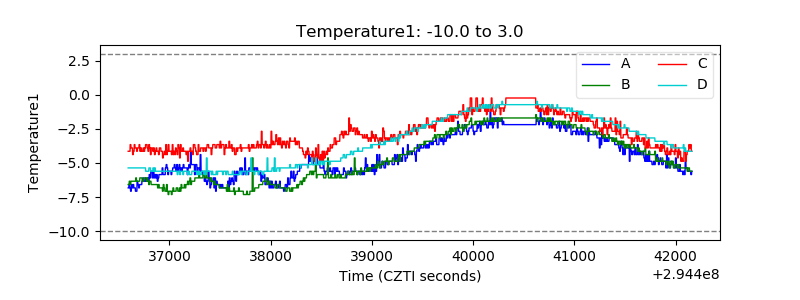 |
| Veto HV Monitor | 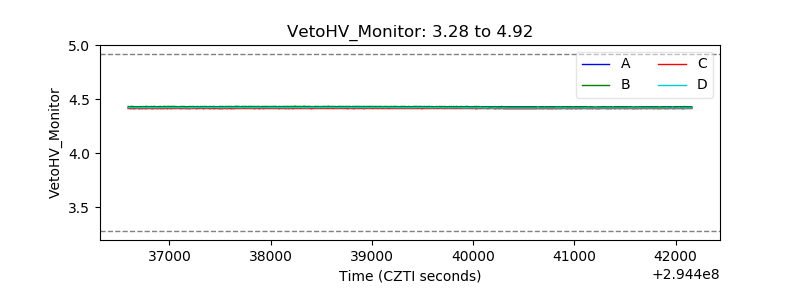 |
| Veto LLD | 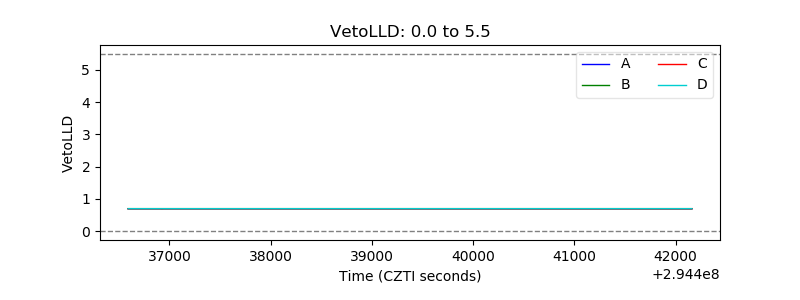 |
| Alpha Counter | 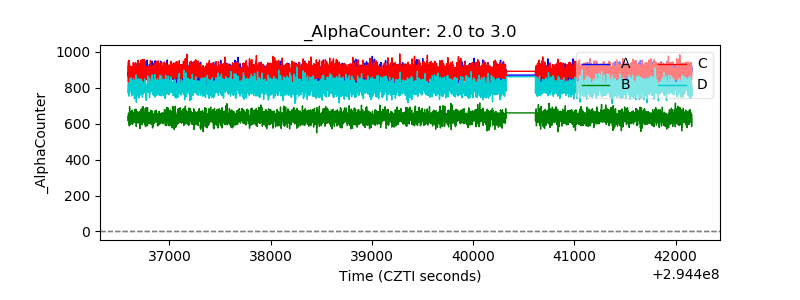 |
| _CPM_Rate | 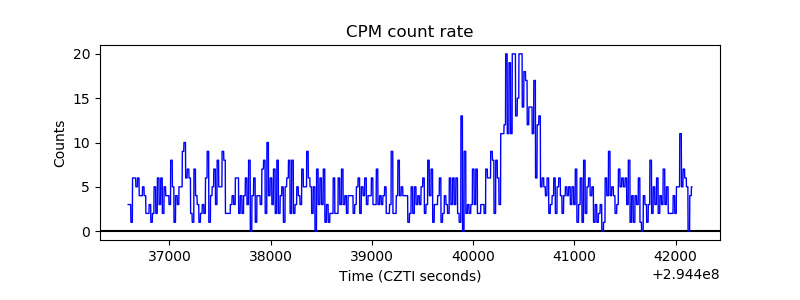 |
| CZT Counter | 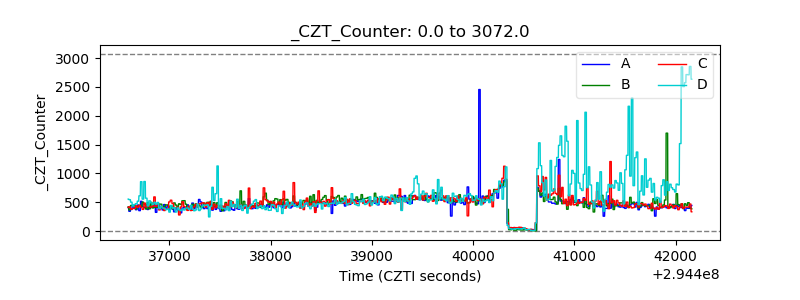 |
| +2.5 Volts monitor | 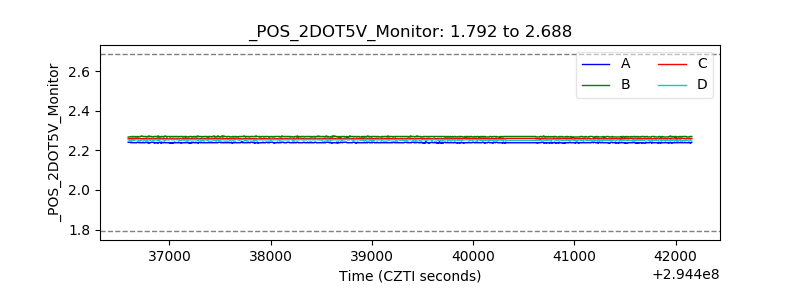 |
| +5 Volts monitor |  |
| _ROLL_ROT | 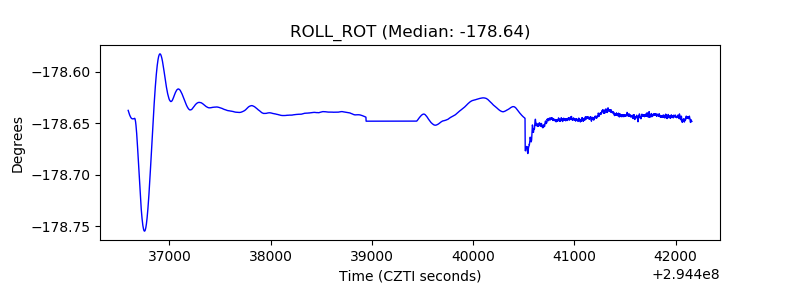 |
| _Roll_DEC | 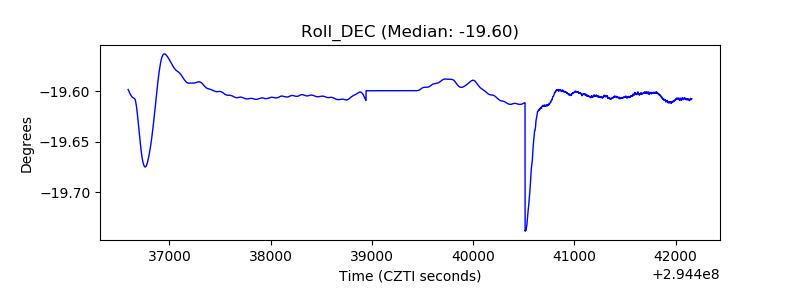 |
| _Roll_RA | 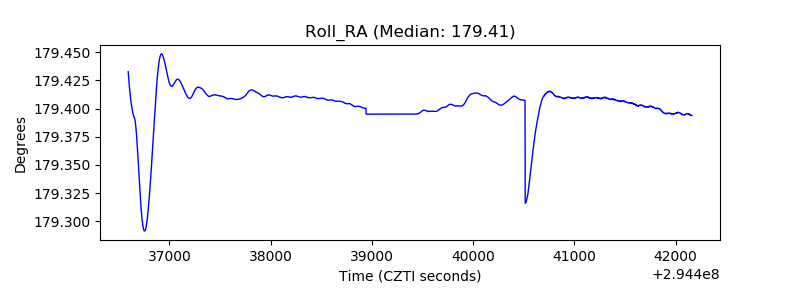 |
| Veto Counter | 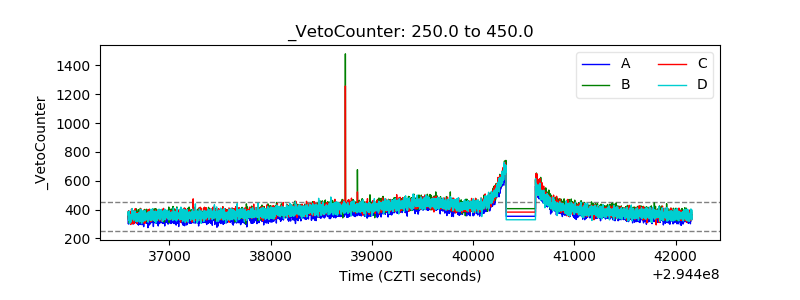 |