| Param | Original file | Final file |
|---|---|---|
| Filename | modeM0/AS1A05_226T09_9000002884_19418cztM0_level2.evt | modeM0/AS1A05_226T09_9000002884_19418cztM0_level2_quad_clean.evt |
| Size (bytes) | 1,303,344,000 | 160,862,400 |
| Size | 1.2 GB | 153.4 MB |
| Events in quadrant A | 6,251,101 | 1,094,295 |
| Events in quadrant B | 6,691,494 | 1,089,137 |
| Events in quadrant C | 6,392,357 | 1,031,117 |
| Events in quadrant D | 19,235,172 | 733,430 |
| Mode M0 | |||
|---|---|---|---|
| Quadrant | BADHDUFLAG | Total packets | Discarded packets |
| A | 0 | 27263 | 3 |
| B | 0 | 28441 | 3 |
| C | 0 | 27462 | 4 |
| D | 0 | 66334 | 3 |
| Mode M9 | |||
|---|---|---|---|
| Quadrant | BADHDUFLAG | Total packets | Discarded packets |
| A | 0 | 17 | 0 |
| B | 0 | 17 | 0 |
| C | 0 | 17 | 0 |
| D | 0 | 17 | 0 |
| Mode SS | |||
|---|---|---|---|
| Quadrant | BADHDUFLAG | Total packets | Discarded packets |
| A | 0 | 272 | 0 |
| B | 0 | 272 | 0 |
| C | 0 | 272 | 0 |
| D | 0 | 272 | 0 |
| Quadrant | Total seconds | Saturated seconds | Saturation percentage |
|---|---|---|---|
| A | 13353 | 52 | 0.389426% |
| B | 13354 | 136 | 1.018421% |
| C | 13353 | 103 | 0.771362% |
| D | 13353 | 5552 | 41.578671% |
Noise dominated data is calculated using 1-second bins in cleaned event files. If a bin has >2000 counts, and if more than 50% of those come from <1% of pixels, then it is considered to be noise-dominated and hence unusable.
| Quadrant | # 1 sec bins | Bins with >0 counts | Bins with >2000 counts | High rate bins dominated by noise | Noise dominated (total time) | Noise dominated (detector-on time) | Marked lightcurve |
|---|---|---|---|---|---|---|---|
| A | 15023 | 13355 | 5 | 5 | 0.03% | 0.04% | 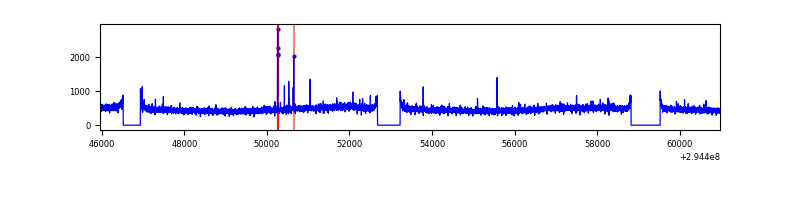 |
| B | 15024 | 13357 | 39 | 39 | 0.26% | 0.29% |  |
| C | 15023 | 13355 | 0 | 0 | 0.00% | 0.00% | 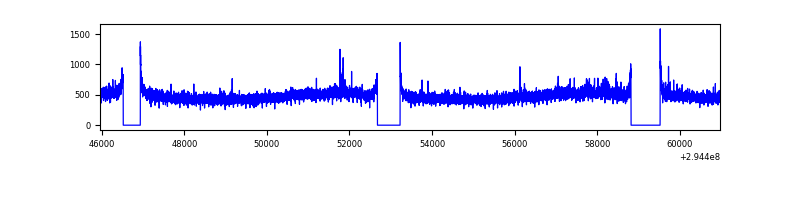 |
| D | 15023 | 13355 | 4637 | 4637 | 30.87% | 34.72% | 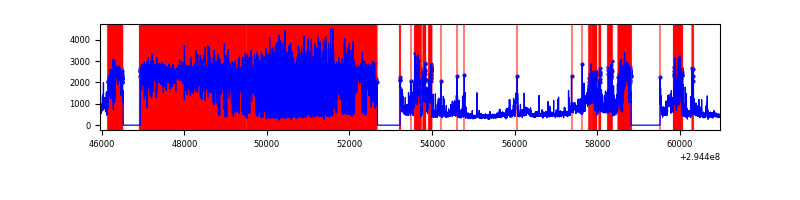 |
Top three noisy pixels from each quadrant. If the there are fewer than three noisy pixels in the level2.evt file, extra rows are filled as -1
| Pixel properties | Quadrant properties | ||||||
|---|---|---|---|---|---|---|---|
| Quadrant | DetID | PixID | Counts | Sigma | Mean | Median | Sigma |
| A | 12 | 96 | 25159 | 72.88 | 1608 | 1576 | 323.6 |
| A | 11 | 29 | 23511 | 67.79 | 1608 | 1576 | 323.6 |
| A | 13 | 254 | 21134 | 60.44 | 1608 | 1576 | 323.6 |
| B | 7 | 220 | 289510 | 936.97 | 1595 | 1553 | 307.3 |
| B | 0 | 230 | 48597 | 153.07 | 1595 | 1553 | 307.3 |
| B | 12 | 111 | 37486 | 116.92 | 1595 | 1553 | 307.3 |
| C | 14 | 238 | 238032 | 661.05 | 1523 | 1532 | 357.8 |
| C | 3 | 233 | 168899 | 467.81 | 1523 | 1532 | 357.8 |
| C | 9 | 221 | 19516 | 50.27 | 1523 | 1532 | 357.8 |
| D | 1 | 52 | 7967863 | 27220.58 | 1208 | 1175 | 292.7 |
| D | 7 | 238 | 6629059 | 22646.15 | 1208 | 1175 | 292.7 |
| D | 2 | 234 | 40995 | 136.06 | 1208 | 1175 | 292.7 |
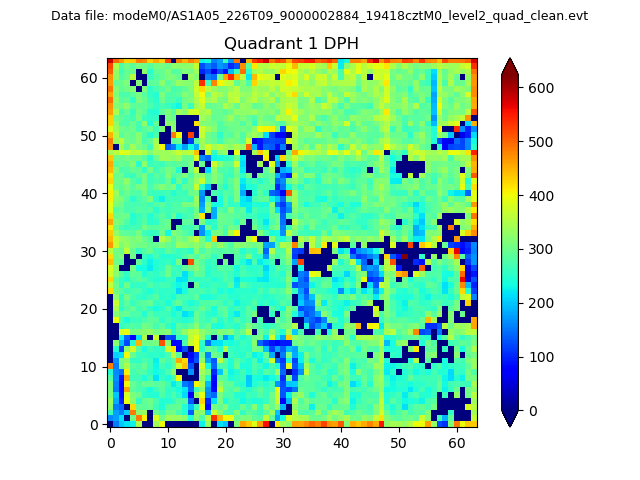
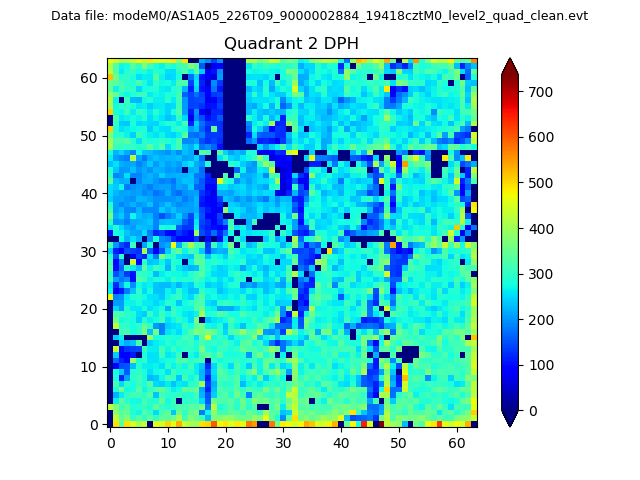
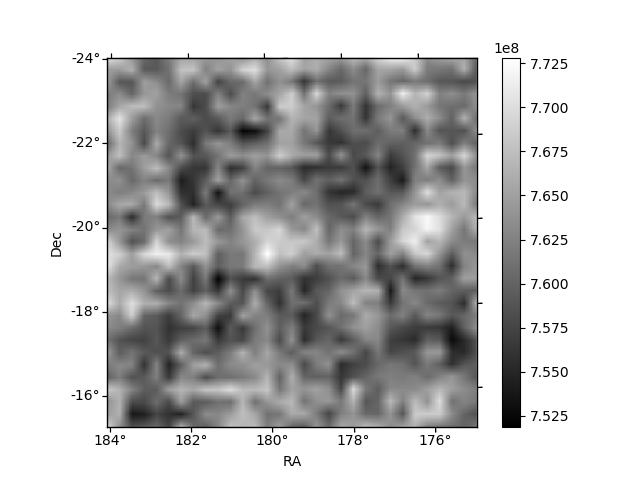
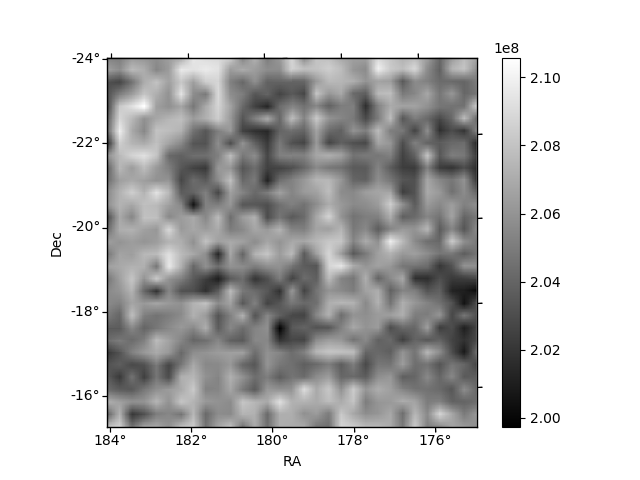
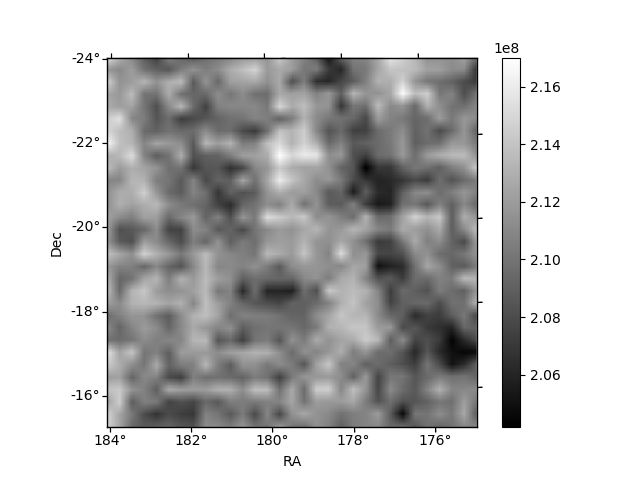
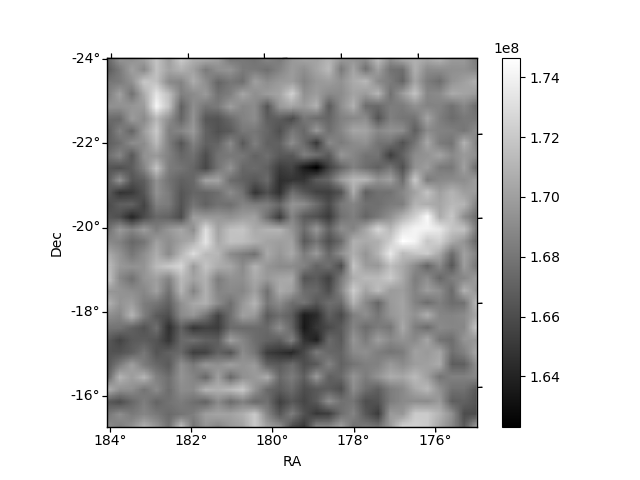
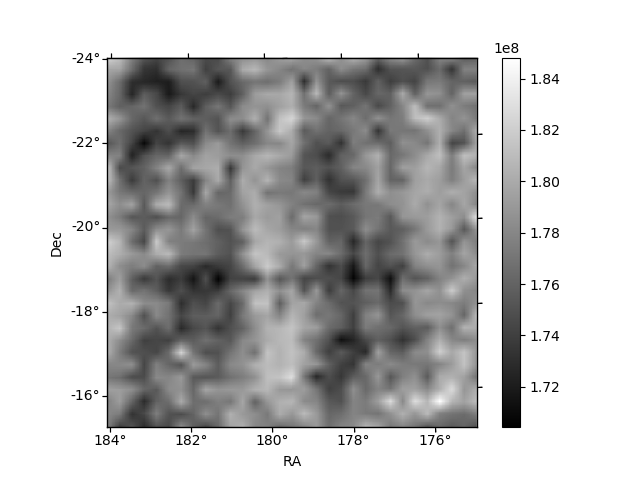
Histogram calculated using DETX and DETY for each event in the final _common_clean file
| Quadrant A | 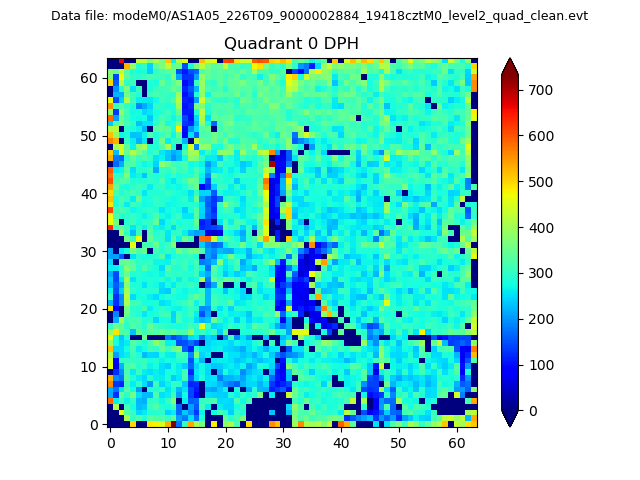 |
 |
Quadrant B |
|---|---|---|---|
| Quadrant D | 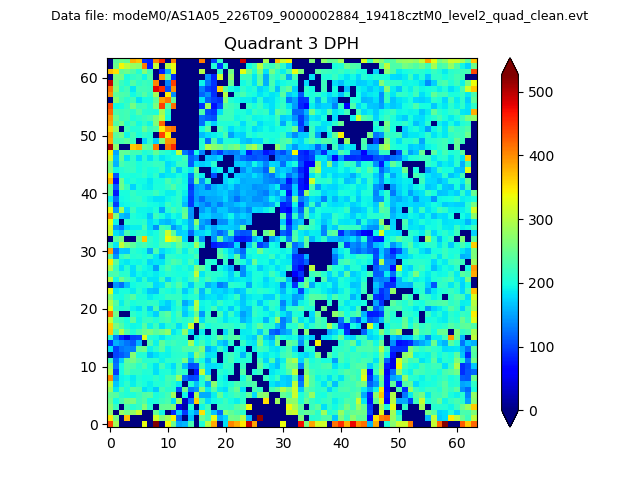 |
 |
Quadrant C |
| Plot type | Count rate plots | Images |
|---|---|---|
| Comparison with Poisson distribution Blue bars denote a histogram of data divided into 1 sec bins. Red curve is a Poisson curve with rate = median count rate of data. |
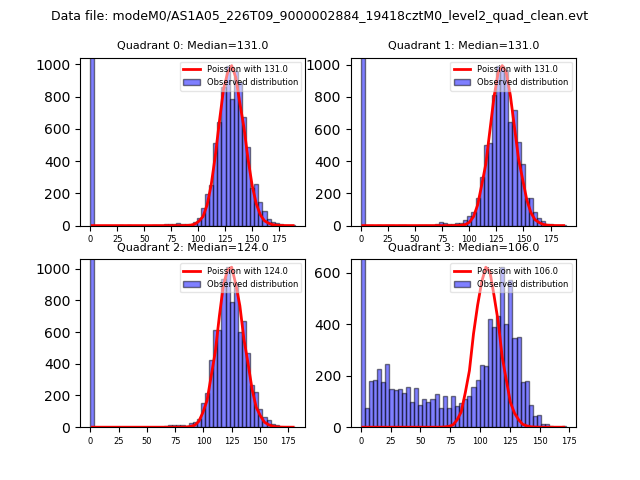 |
 |
| Quadrant-wise count rates Data is divided into 100 sec bins |
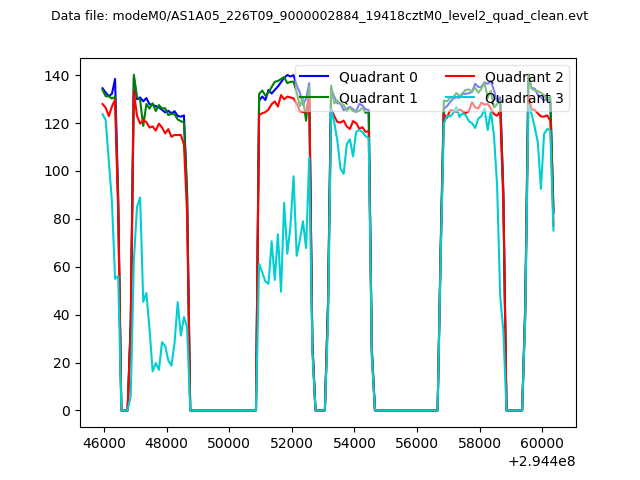 |
|
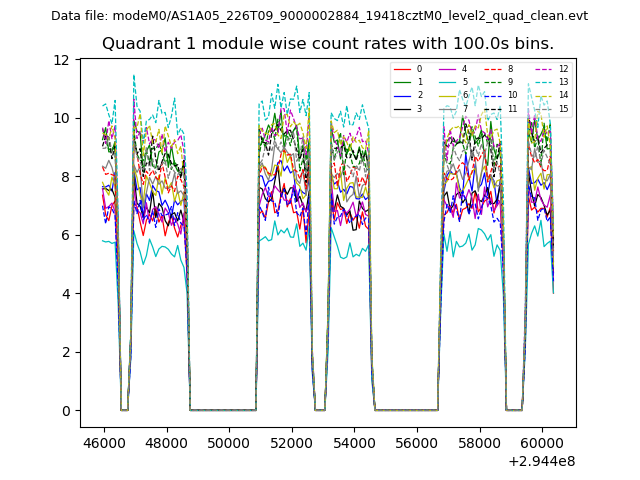
| Module-wise count rates for Quadrant A Data is divided into 100 sec bins |
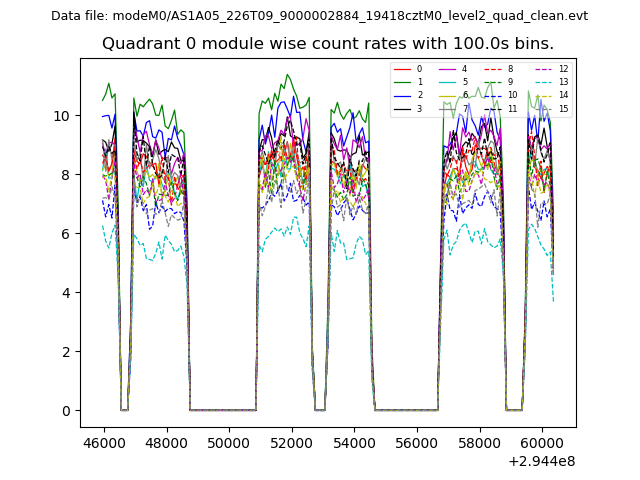 |
 |
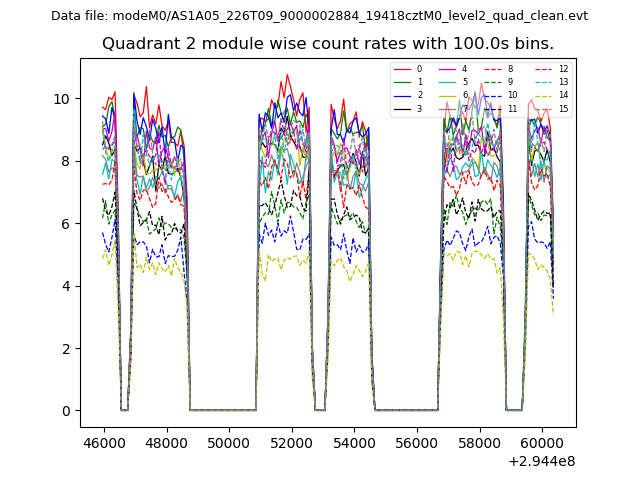
| Module-wise count rates for Quadrant B Data is divided into 100 sec bins |
 |
 |
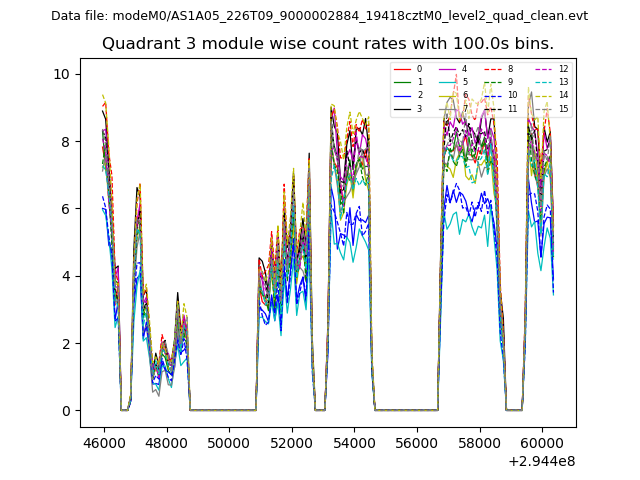
| Module-wise count rates for Quadrant C Data is divided into 100 sec bins |
 |
 |
| Module-wise count rates for Quadrant D Data is divided into 100 sec bins |
 |
 |
| Parameter | Plot |
|---|---|
| CZT HV Monitor | 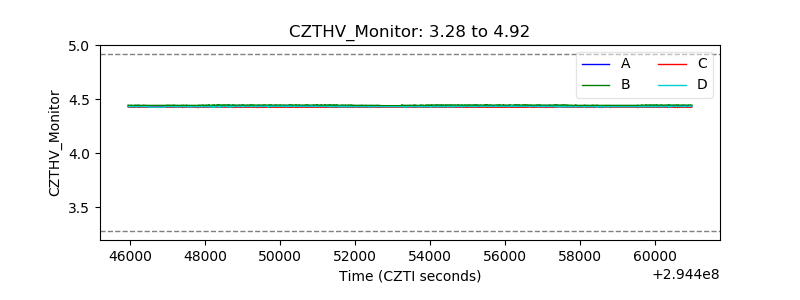 |
| D_VDD |  |
| Temperature 1 | 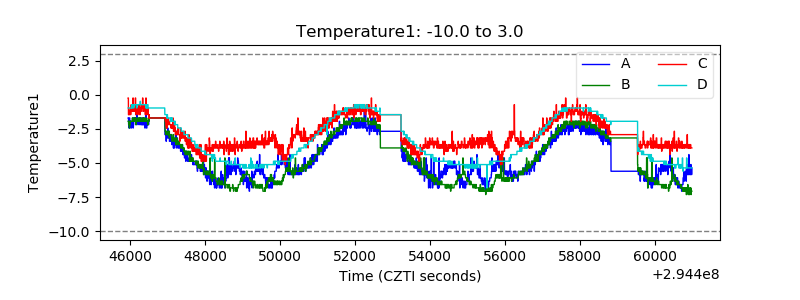 |
| Veto HV Monitor | 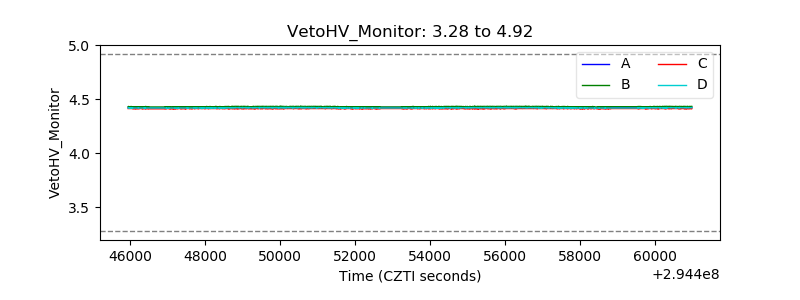 |
| Veto LLD |  |
| Alpha Counter | 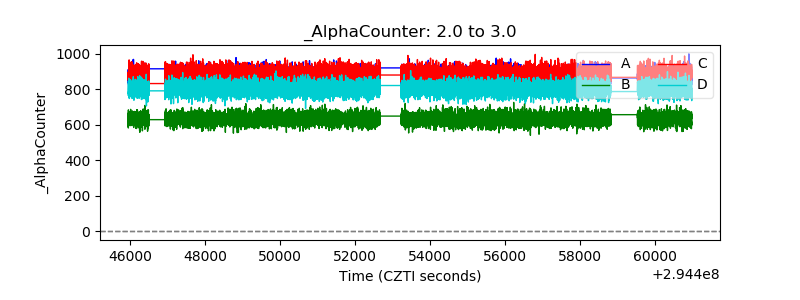 |
| _CPM_Rate | 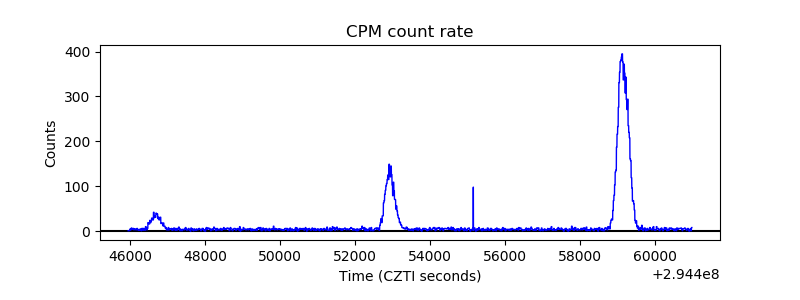 |
| CZT Counter | 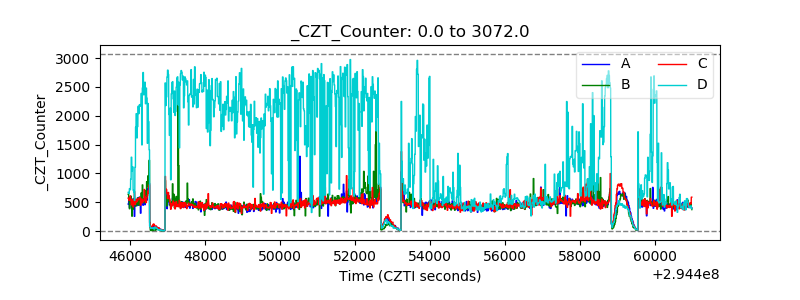 |
| +2.5 Volts monitor | 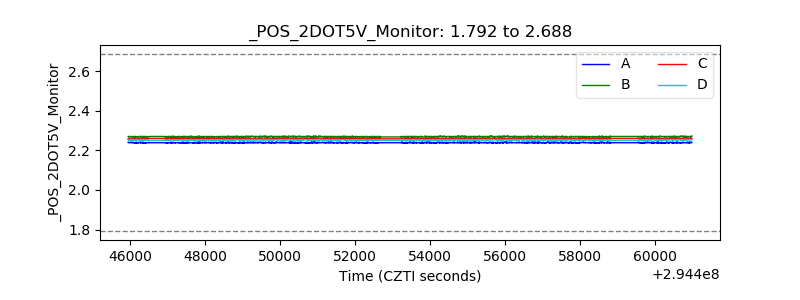 |
| +5 Volts monitor |  |
| _ROLL_ROT | 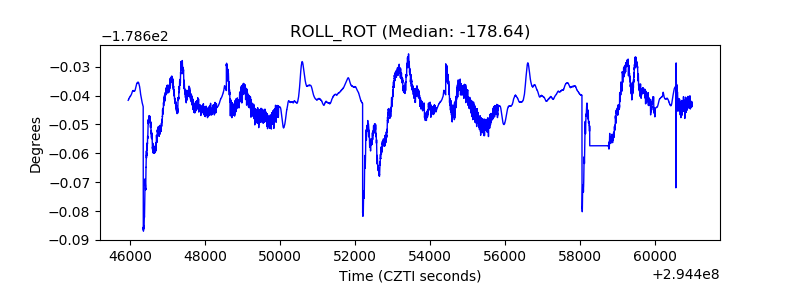 |
| _Roll_DEC | 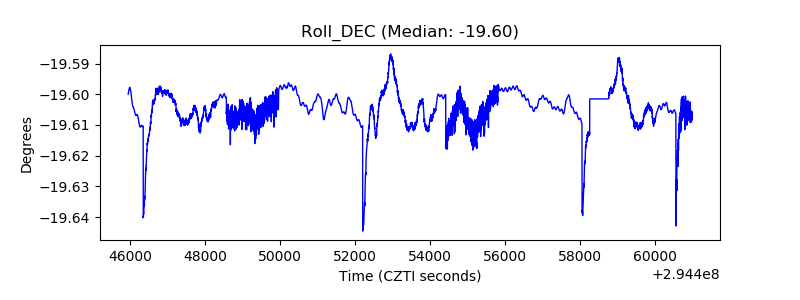 |
| _Roll_RA | 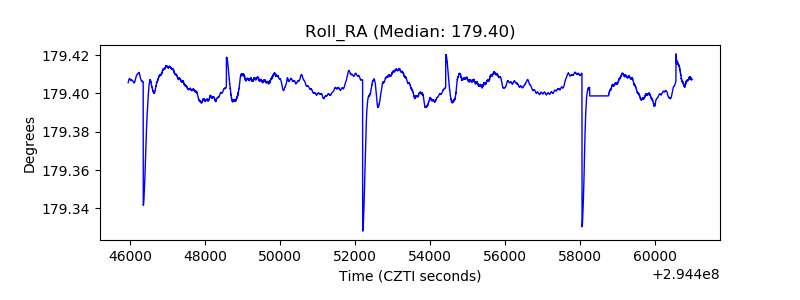 |
| Veto Counter | 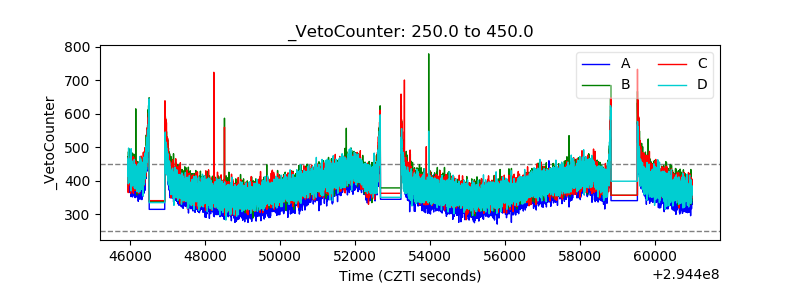 |