| Param | Original file | Final file |
|---|---|---|
| Filename | modeM0/AS1A05_226T09_9000002884_19419cztM0_level2.evt | modeM0/AS1A05_226T09_9000002884_19419cztM0_level2_quad_clean.evt |
| Size (bytes) | 609,094,080 | 83,905,920 |
| Size | 580.9 MB | 80.0 MB |
| Events in quadrant A | 3,471,527 | 550,750 |
| Events in quadrant B | 3,765,442 | 549,494 |
| Events in quadrant C | 3,577,357 | 521,170 |
| Events in quadrant D | 7,133,837 | 407,119 |
| Mode M0 | |||
|---|---|---|---|
| Quadrant | BADHDUFLAG | Total packets | Discarded packets |
| A | 0 | 14989 | 2 |
| B | 0 | 15730 | 2 |
| C | 0 | 15160 | 2 |
| D | 0 | 26132 | 2 |
| Mode M9 | |||
|---|---|---|---|
| Quadrant | BADHDUFLAG | Total packets | Discarded packets |
| A | 0 | 16 | 0 |
| B | 0 | 16 | 0 |
| C | 0 | 16 | 0 |
| D | 0 | 16 | 0 |
| Mode SS | |||
|---|---|---|---|
| Quadrant | BADHDUFLAG | Total packets | Discarded packets |
| A | 0 | 150 | 0 |
| B | 0 | 150 | 0 |
| C | 0 | 150 | 0 |
| D | 0 | 150 | 0 |
| Quadrant | Total seconds | Saturated seconds | Saturation percentage |
|---|---|---|---|
| A | 7354 | 40 | 0.543922% |
| B | 7355 | 83 | 1.128484% |
| C | 7355 | 72 | 0.978926% |
| D | 7355 | 1273 | 17.307954% |
Noise dominated data is calculated using 1-second bins in cleaned event files. If a bin has >2000 counts, and if more than 50% of those come from <1% of pixels, then it is considered to be noise-dominated and hence unusable.
| Quadrant | # 1 sec bins | Bins with >0 counts | Bins with >2000 counts | High rate bins dominated by noise | Noise dominated (total time) | Noise dominated (detector-on time) | Marked lightcurve |
|---|---|---|---|---|---|---|---|
| A | 8924 | 7355 | 0 | 0 | 0.00% | 0.00% | 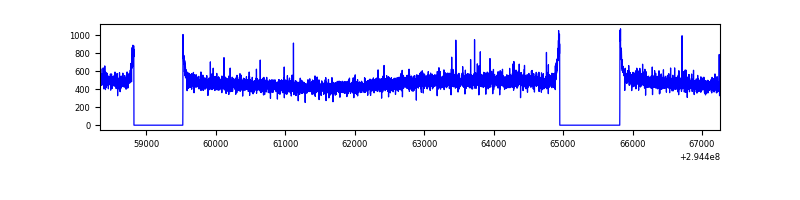 |
| B | 8925 | 7356 | 18 | 18 | 0.20% | 0.24% | 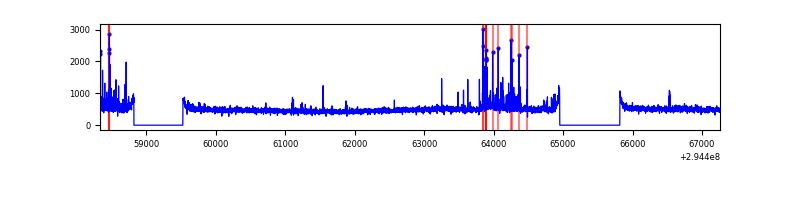 |
| C | 8925 | 7355 | 0 | 0 | 0.00% | 0.00% | 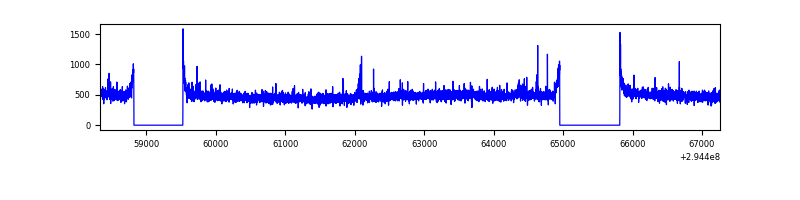 |
| D | 8925 | 7355 | 1216 | 1216 | 13.62% | 16.53% | 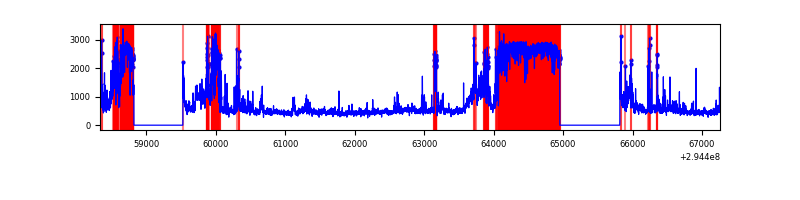 |
Top three noisy pixels from each quadrant. If the there are fewer than three noisy pixels in the level2.evt file, extra rows are filled as -1
| Pixel properties | Quadrant properties | ||||||
|---|---|---|---|---|---|---|---|
| Quadrant | DetID | PixID | Counts | Sigma | Mean | Median | Sigma |
| A | 11 | 29 | 13869 | 71.69 | 895 | 875 | 181.2 |
| A | 13 | 254 | 10239 | 51.67 | 895 | 875 | 181.2 |
| A | 0 | 226 | 7711 | 37.72 | 895 | 875 | 181.2 |
| B | 7 | 220 | 182120 | 1069.14 | 893 | 869 | 169.5 |
| B | 0 | 198 | 31547 | 180.96 | 893 | 869 | 169.5 |
| B | 0 | 230 | 26346 | 150.28 | 893 | 869 | 169.5 |
| C | 14 | 238 | 133072 | 669.67 | 848 | 857 | 197.4 |
| C | 3 | 233 | 103548 | 520.13 | 848 | 857 | 197.4 |
| C | 9 | 221 | 19637 | 95.12 | 848 | 857 | 197.4 |
| D | 7 | 238 | 3922245 | 20832.4 | 767 | 745 | 188.2 |
| D | 1 | 52 | 259436 | 1374.26 | 767 | 745 | 188.2 |
| D | 2 | 234 | 23492 | 120.84 | 767 | 745 | 188.2 |
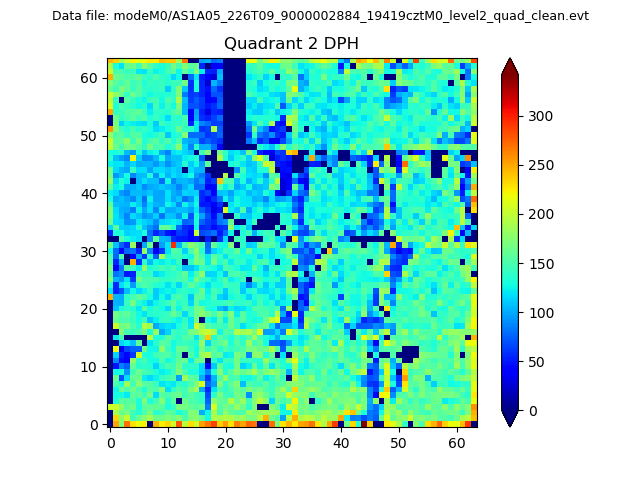
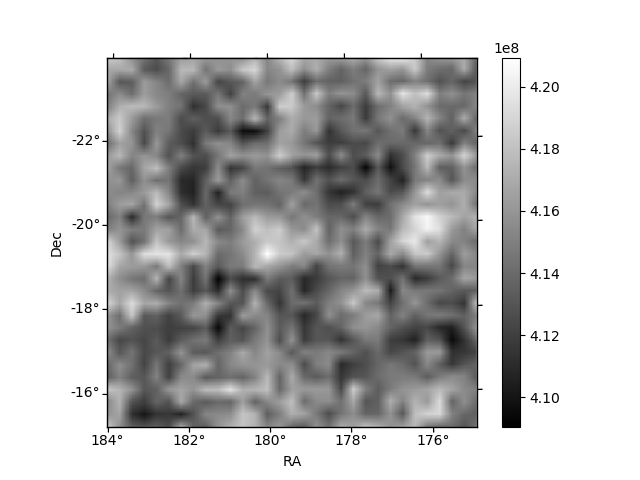
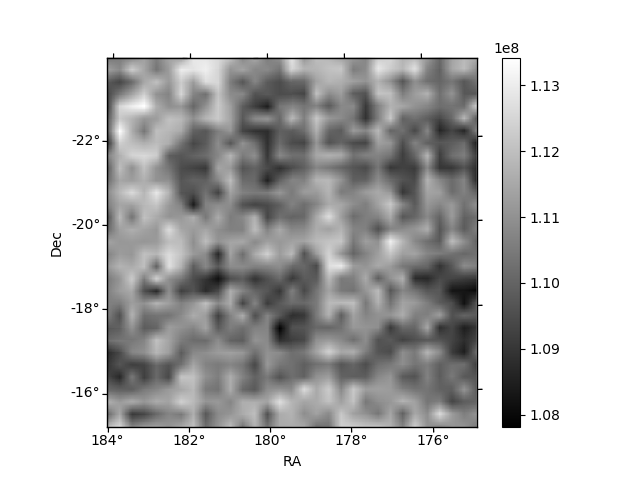
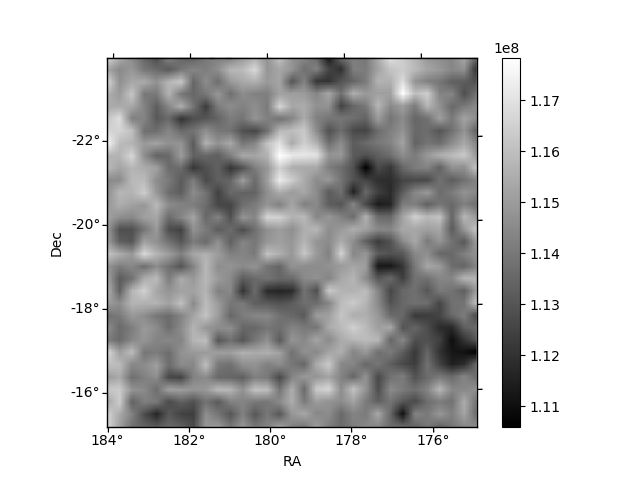
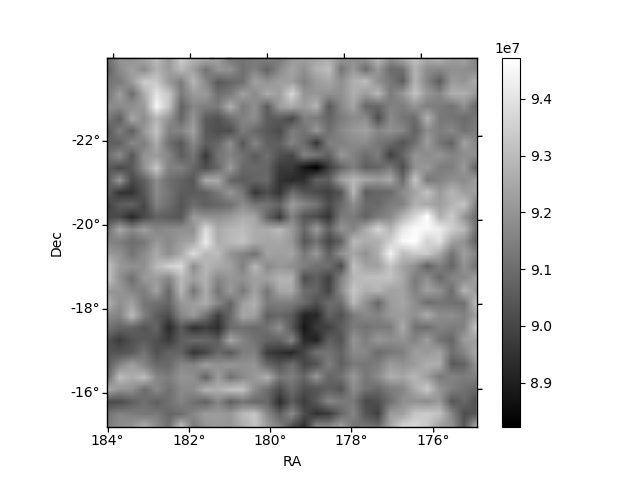
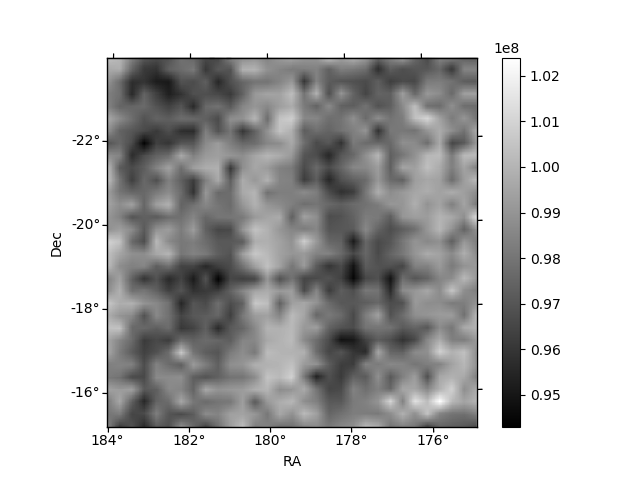
Histogram calculated using DETX and DETY for each event in the final _common_clean file
| Quadrant A | 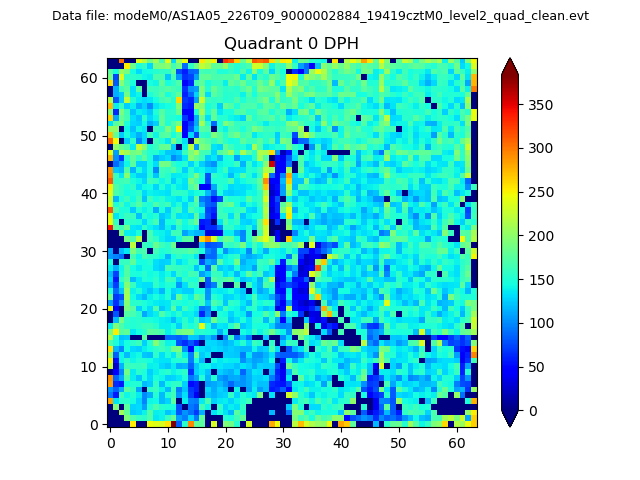 |
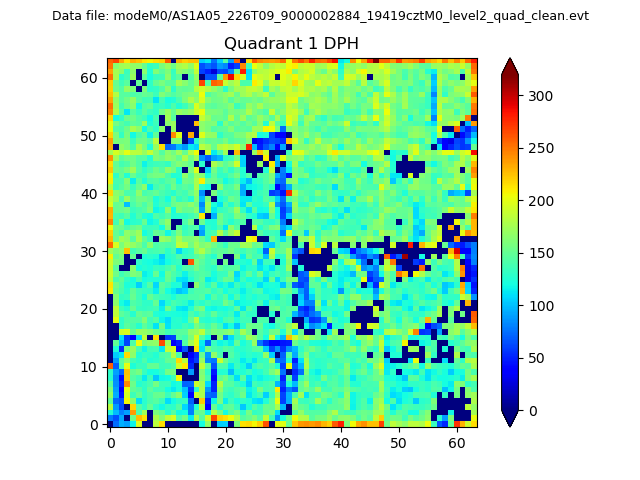 |
Quadrant B |
|---|---|---|---|
| Quadrant D | 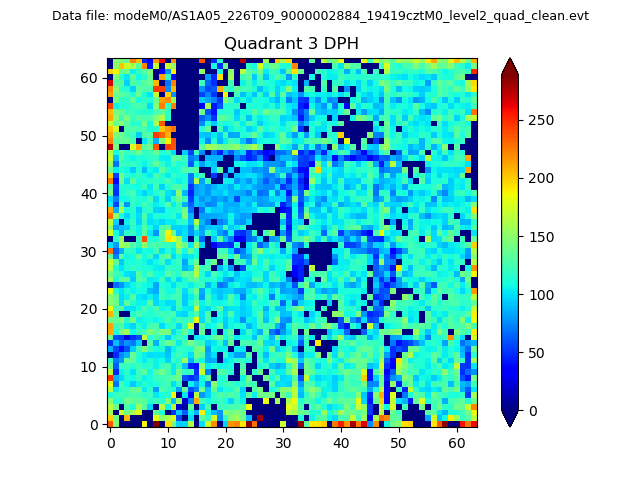 |
 |
Quadrant C |
| Plot type | Count rate plots | Images |
|---|---|---|
| Comparison with Poisson distribution Blue bars denote a histogram of data divided into 1 sec bins. Red curve is a Poisson curve with rate = median count rate of data. |
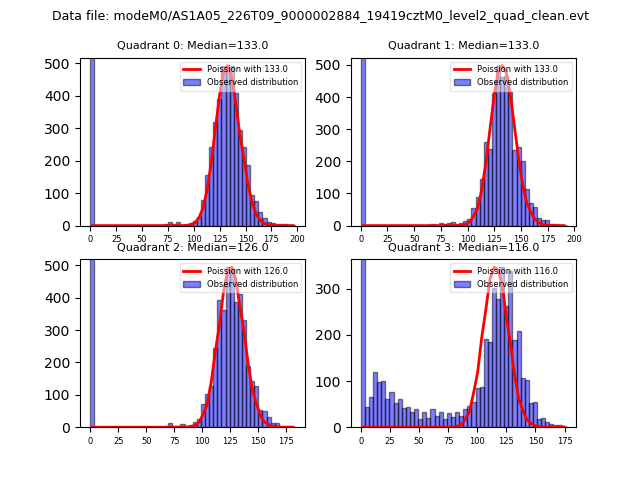 |
 |
| Quadrant-wise count rates Data is divided into 100 sec bins |
 |
|
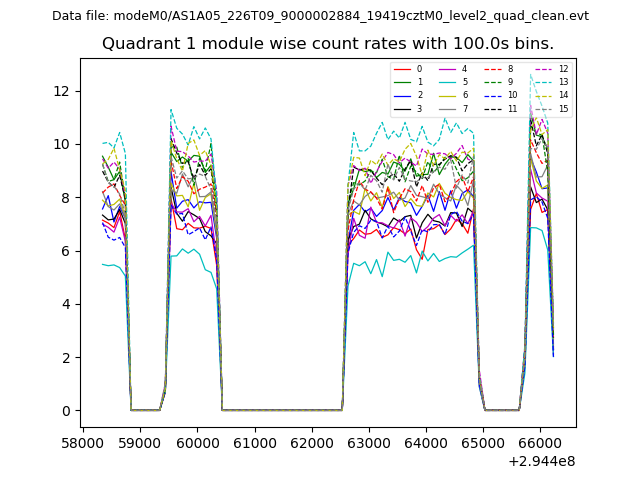
| Module-wise count rates for Quadrant A Data is divided into 100 sec bins |
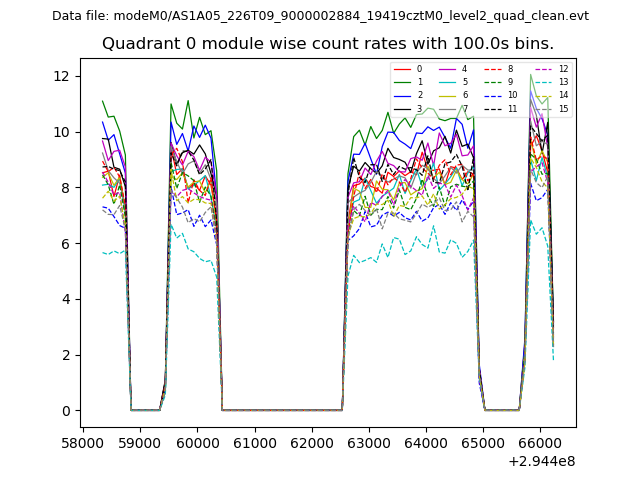 |
 |
| Module-wise count rates for Quadrant B Data is divided into 100 sec bins |
 |
 |
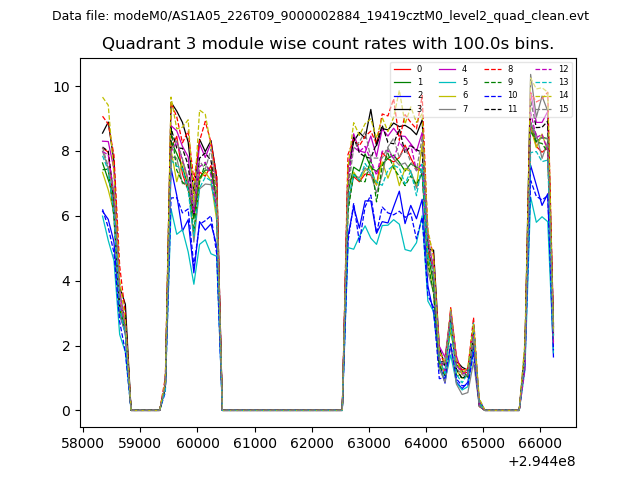
| Module-wise count rates for Quadrant C Data is divided into 100 sec bins |
 |
 |
| Module-wise count rates for Quadrant D Data is divided into 100 sec bins |
 |
 |
| Parameter | Plot |
|---|---|
| CZT HV Monitor |  |
| D_VDD | 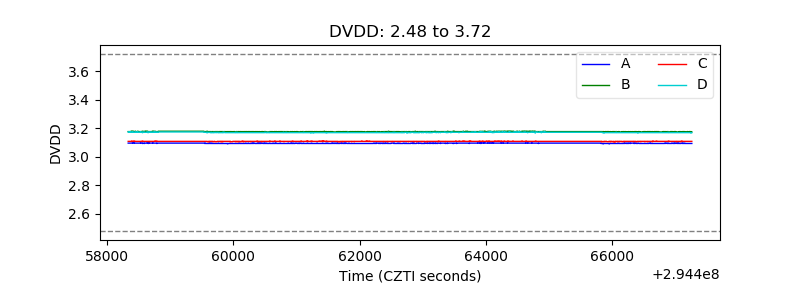 |
| Temperature 1 | 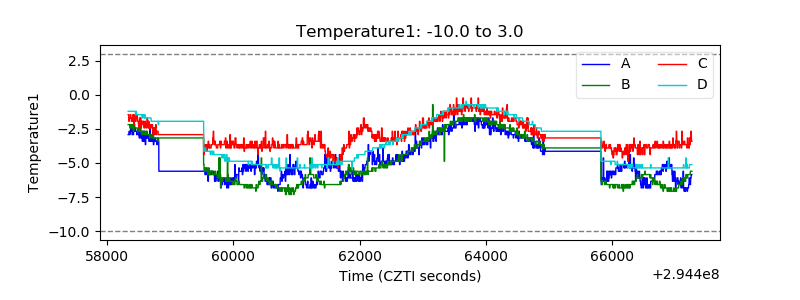 |
| Veto HV Monitor | 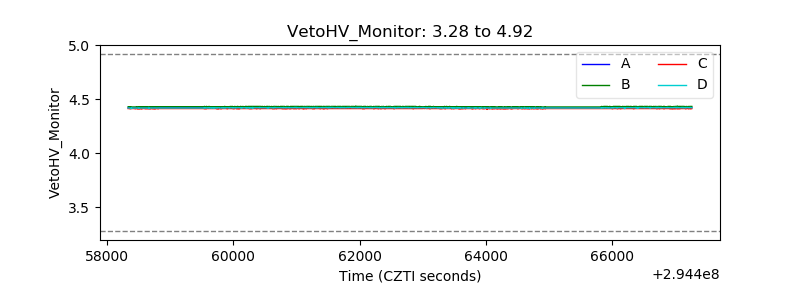 |
| Veto LLD | 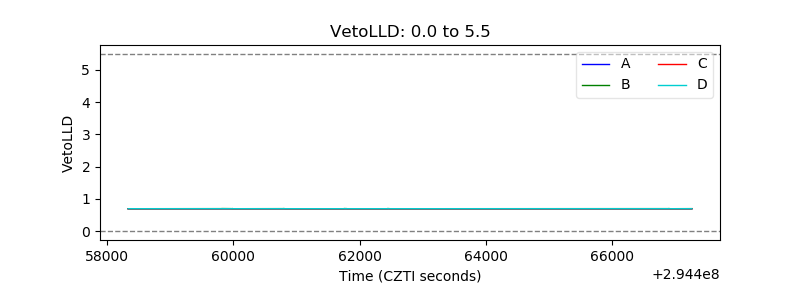 |
| Alpha Counter | 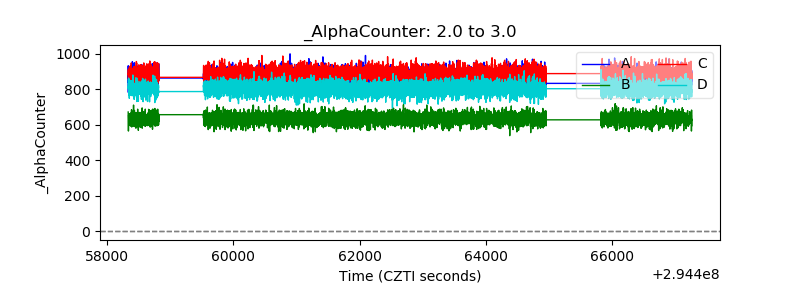 |
| _CPM_Rate | 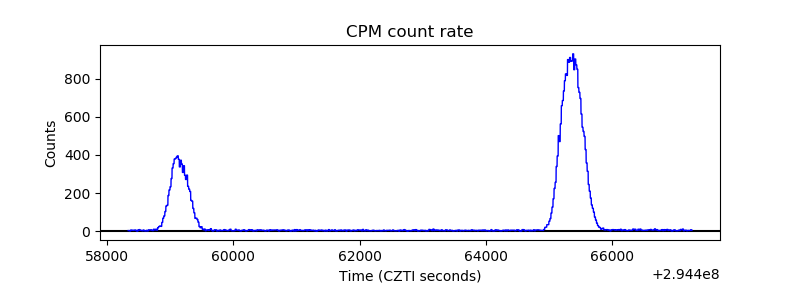 |
| CZT Counter | 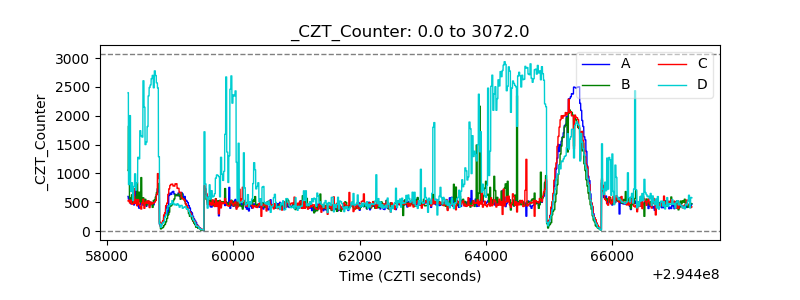 |
| +2.5 Volts monitor |  |
| +5 Volts monitor |  |
| _ROLL_ROT | 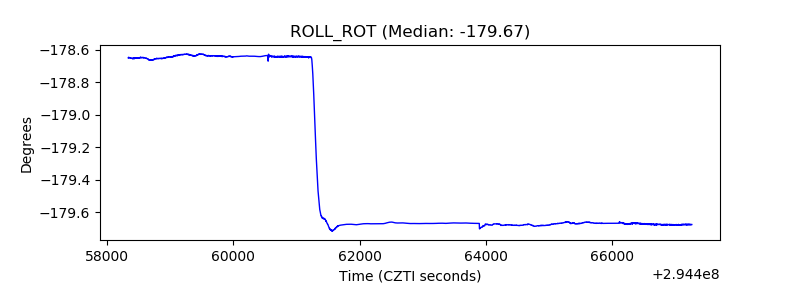 |
| _Roll_DEC | 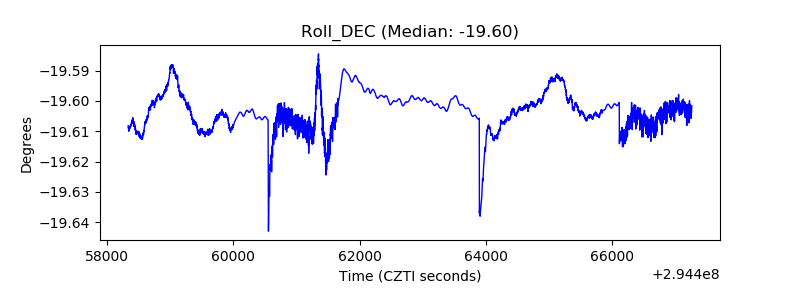 |
| _Roll_RA | 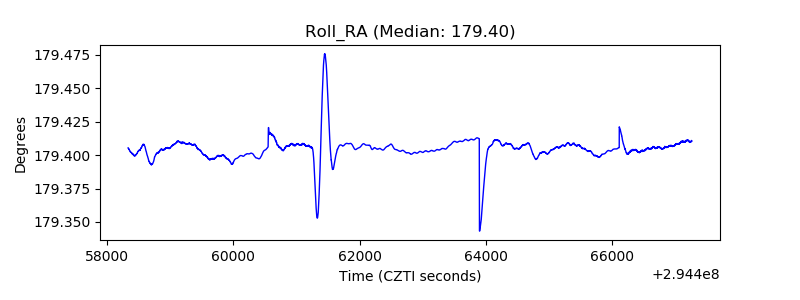 |
| Veto Counter |  |