| Param | Original file | Final file |
|---|---|---|
| Filename | modeM0/AS1A05_226T09_9000002884_19420cztM0_level2.evt | modeM0/AS1A05_226T09_9000002884_19420cztM0_level2_quad_clean.evt |
| Size (bytes) | 481,870,080 | 67,164,480 |
| Size | 459.5 MB | 64.1 MB |
| Events in quadrant A | 3,214,128 | 405,127 |
| Events in quadrant B | 3,499,801 | 404,676 |
| Events in quadrant C | 3,240,573 | 385,711 |
| Events in quadrant D | 4,187,034 | 373,920 |
| Mode M0 | |||
|---|---|---|---|
| Quadrant | BADHDUFLAG | Total packets | Discarded packets |
| A | 0 | 13704 | 2 |
| B | 0 | 14434 | 2 |
| C | 0 | 13702 | 2 |
| D | 0 | 16794 | 2 |
| Mode M9 | |||
|---|---|---|---|
| Quadrant | BADHDUFLAG | Total packets | Discarded packets |
| A | 0 | 17 | 0 |
| B | 0 | 18 | 0 |
| C | 0 | 18 | 0 |
| D | 0 | 18 | 0 |
| Mode SS | |||
|---|---|---|---|
| Quadrant | BADHDUFLAG | Total packets | Discarded packets |
| A | 0 | 136 | 0 |
| B | 0 | 136 | 0 |
| C | 0 | 136 | 0 |
| D | 0 | 136 | 0 |
| Quadrant | Total seconds | Saturated seconds | Saturation percentage |
|---|---|---|---|
| A | 6653 | 19 | 0.285585% |
| B | 6653 | 76 | 1.142342% |
| C | 6653 | 61 | 0.916880% |
| D | 6653 | 131 | 1.969037% |
Noise dominated data is calculated using 1-second bins in cleaned event files. If a bin has >2000 counts, and if more than 50% of those come from <1% of pixels, then it is considered to be noise-dominated and hence unusable.
| Quadrant | # 1 sec bins | Bins with >0 counts | Bins with >2000 counts | High rate bins dominated by noise | Noise dominated (total time) | Noise dominated (detector-on time) | Marked lightcurve |
|---|---|---|---|---|---|---|---|
| A | 7678 | 6653 | 0 | 0 | 0.00% | 0.00% | 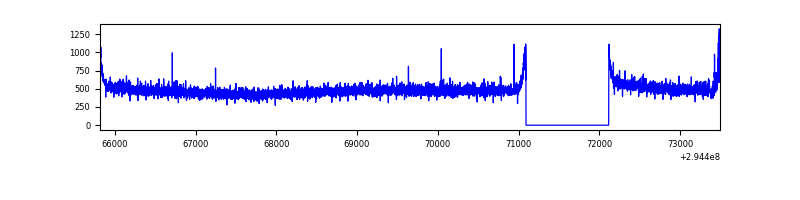 |
| B | 7678 | 6653 | 23 | 23 | 0.30% | 0.35% | 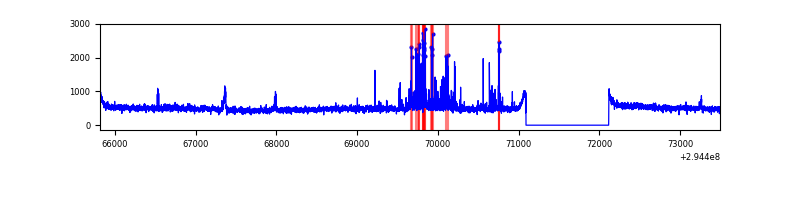 |
| C | 7678 | 6653 | 1 | 1 | 0.01% | 0.02% | 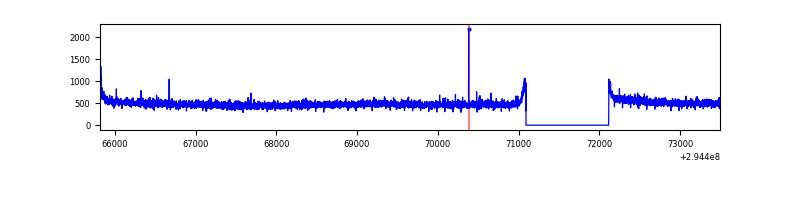 |
| D | 7678 | 6653 | 110 | 110 | 1.43% | 1.65% | 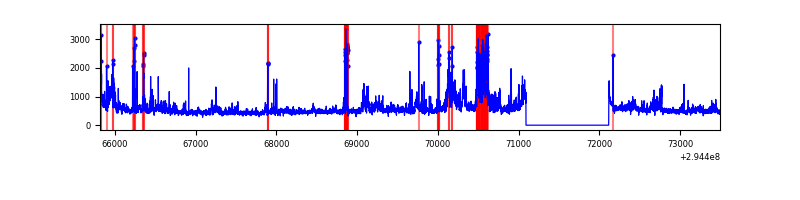 |
Top three noisy pixels from each quadrant. If the there are fewer than three noisy pixels in the level2.evt file, extra rows are filled as -1
| Pixel properties | Quadrant properties | ||||||
|---|---|---|---|---|---|---|---|
| Quadrant | DetID | PixID | Counts | Sigma | Mean | Median | Sigma |
| A | 9 | 143 | 23442 | 136.09 | 826 | 810 | 166.3 |
| A | 13 | 254 | 9053 | 49.57 | 826 | 810 | 166.3 |
| A | 0 | 226 | 7260 | 38.79 | 826 | 810 | 166.3 |
| B | 7 | 220 | 180450 | 1138.19 | 825 | 803 | 157.8 |
| B | 0 | 198 | 34557 | 213.85 | 825 | 803 | 157.8 |
| B | 0 | 230 | 34039 | 210.57 | 825 | 803 | 157.8 |
| C | 14 | 238 | 124007 | 669.29 | 787 | 790 | 184.1 |
| C | 3 | 233 | 30157 | 159.52 | 787 | 790 | 184.1 |
| C | 9 | 221 | 13383 | 68.4 | 787 | 790 | 184.1 |
| D | 7 | 238 | 743312 | 3856.54 | 790 | 766 | 192.5 |
| D | 1 | 52 | 260428 | 1348.6 | 790 | 766 | 192.5 |
| D | 12 | 218 | 170869 | 883.46 | 790 | 766 | 192.5 |
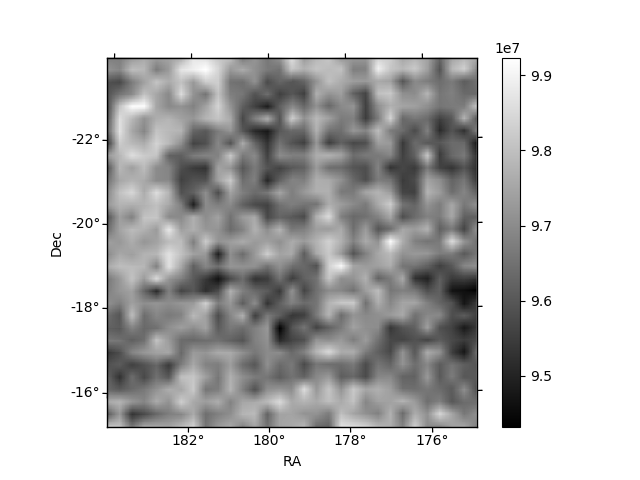
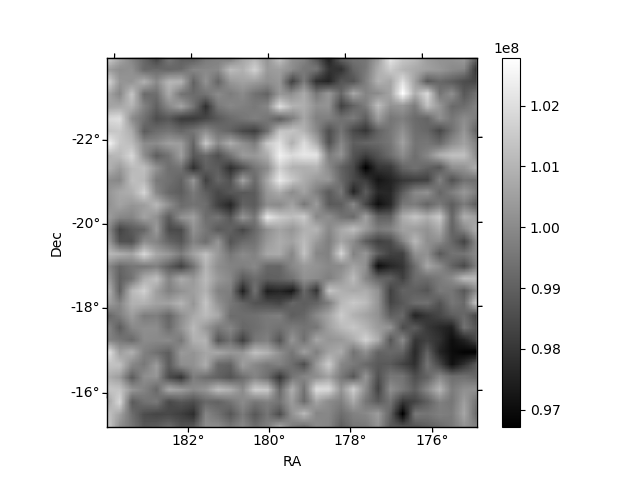
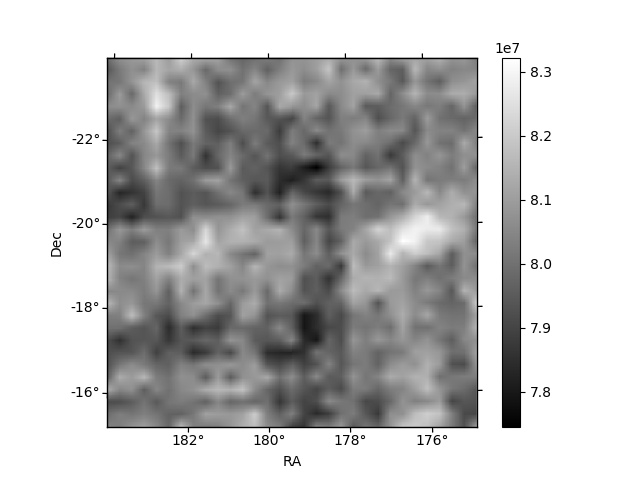
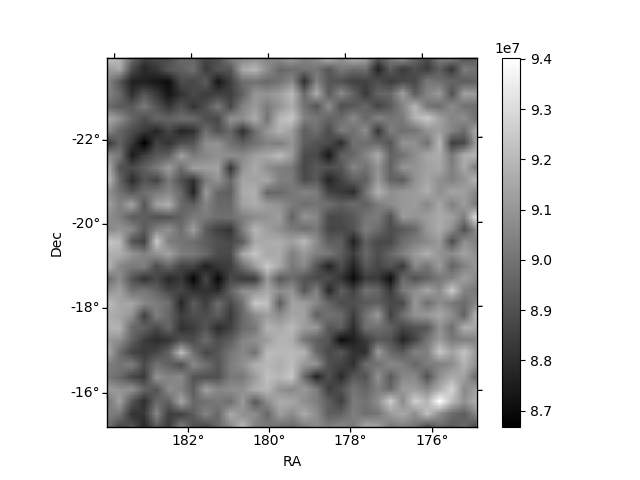
Histogram calculated using DETX and DETY for each event in the final _common_clean file
| Quadrant A | 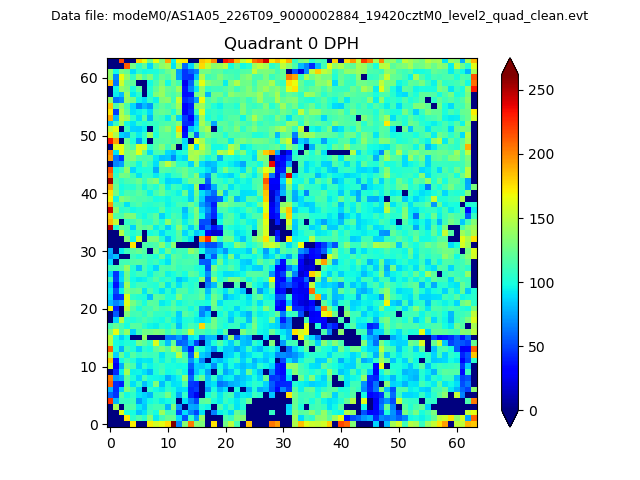 |
 |
Quadrant B |
|---|---|---|---|
| Quadrant D |  |
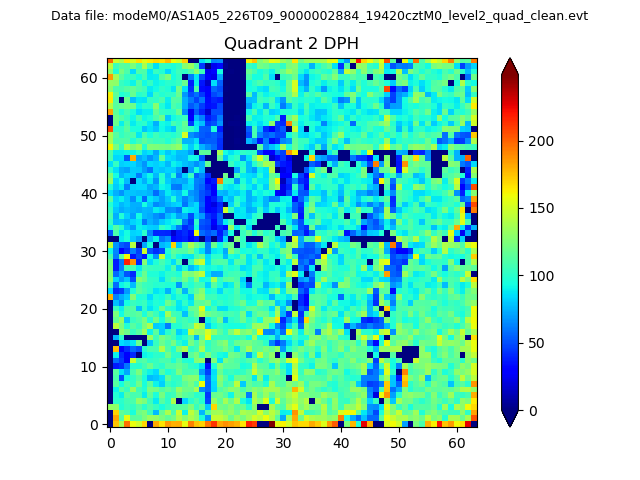 |
Quadrant C |
| Plot type | Count rate plots | Images |
|---|---|---|
| Comparison with Poisson distribution Blue bars denote a histogram of data divided into 1 sec bins. Red curve is a Poisson curve with rate = median count rate of data. |
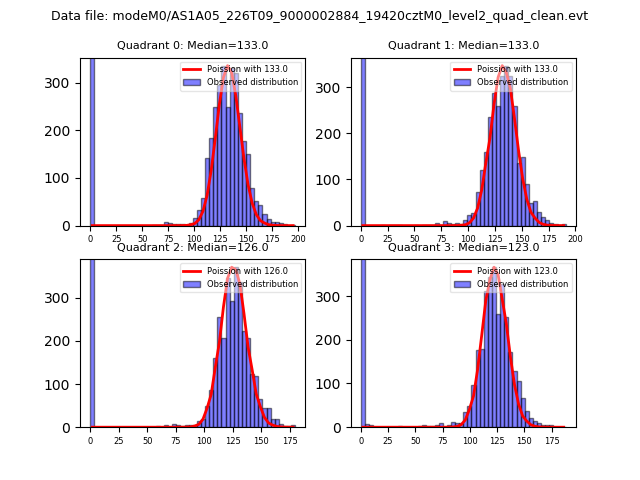 |
 |
| Quadrant-wise count rates Data is divided into 100 sec bins |
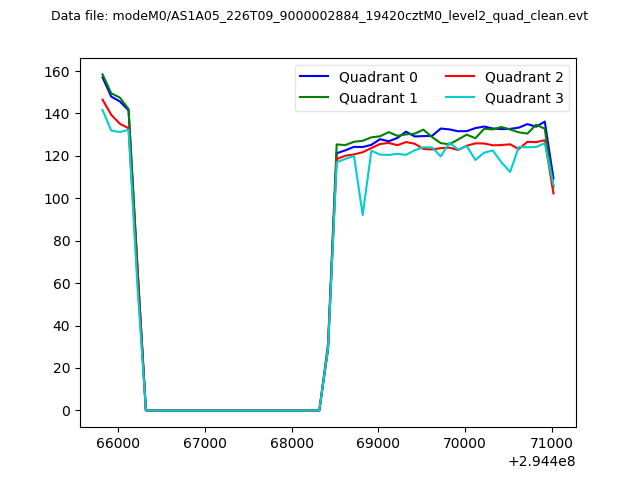 |
|
| Module-wise count rates for Quadrant A Data is divided into 100 sec bins |
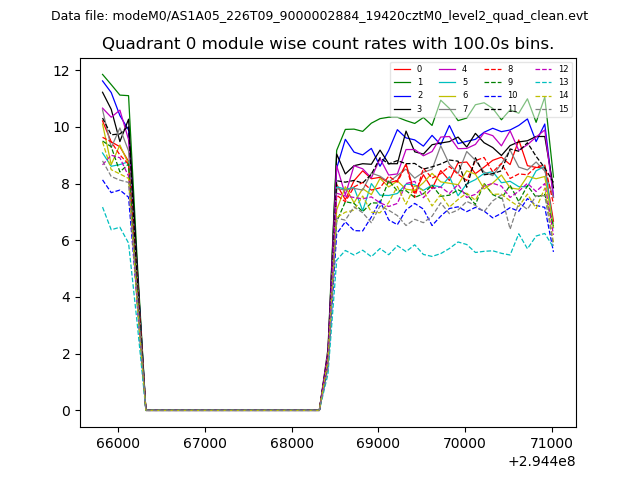 |
 |
| Module-wise count rates for Quadrant B Data is divided into 100 sec bins |
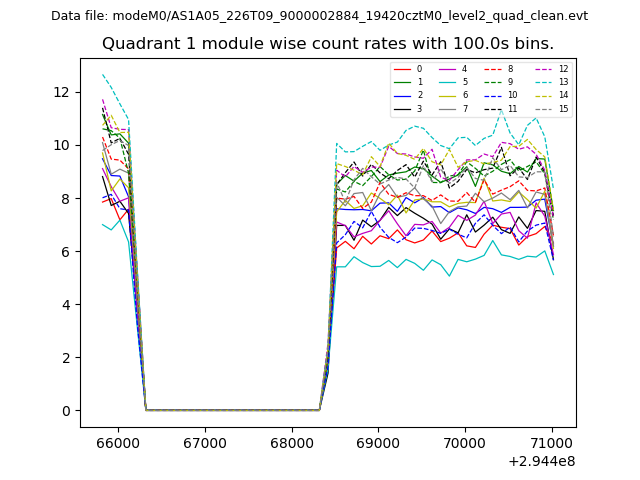 |
 |
| Module-wise count rates for Quadrant C Data is divided into 100 sec bins |
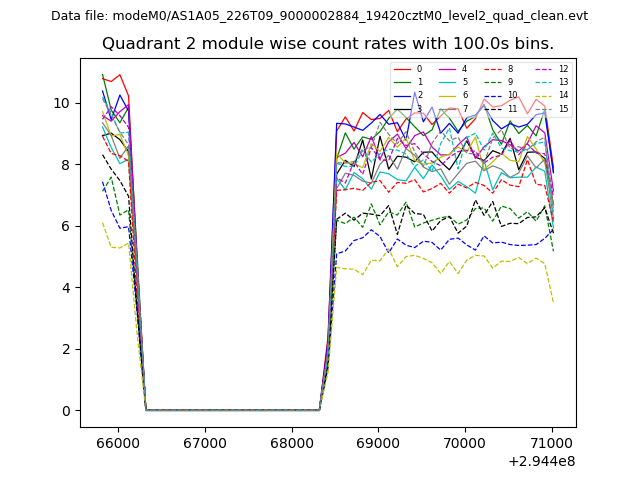 |
 |
| Module-wise count rates for Quadrant D Data is divided into 100 sec bins |
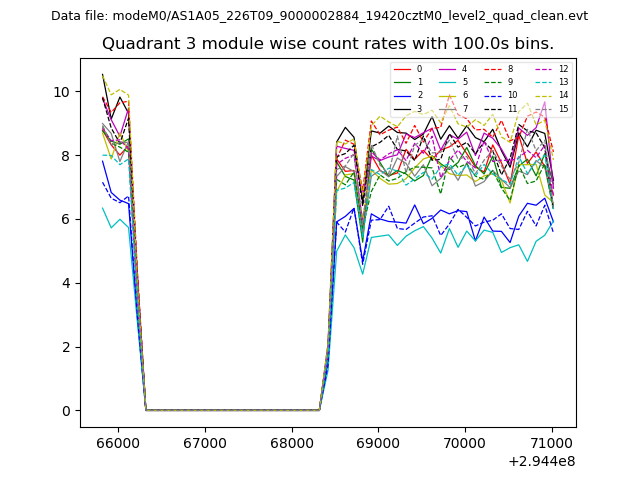 |
 |
| Parameter | Plot |
|---|---|
| CZT HV Monitor |  |
| D_VDD | 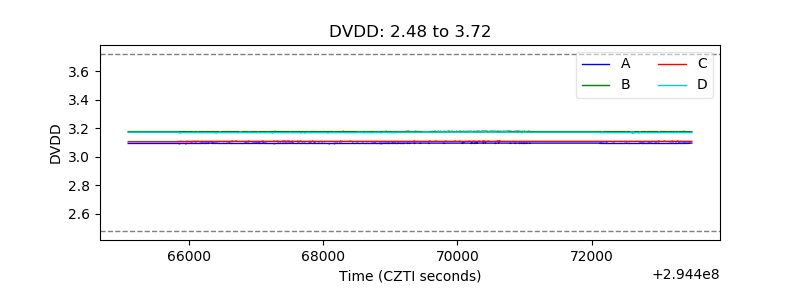 |
| Temperature 1 |  |
| Veto HV Monitor | 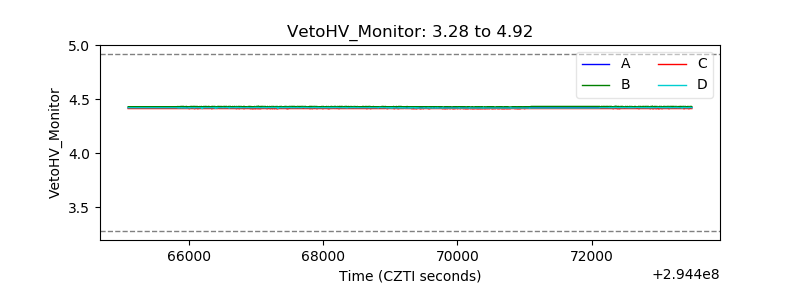 |
| Veto LLD | 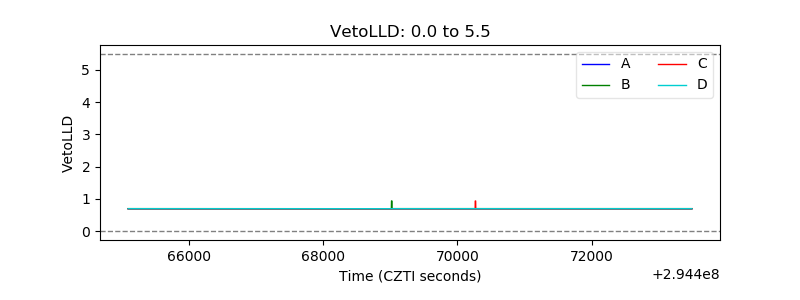 |
| Alpha Counter | 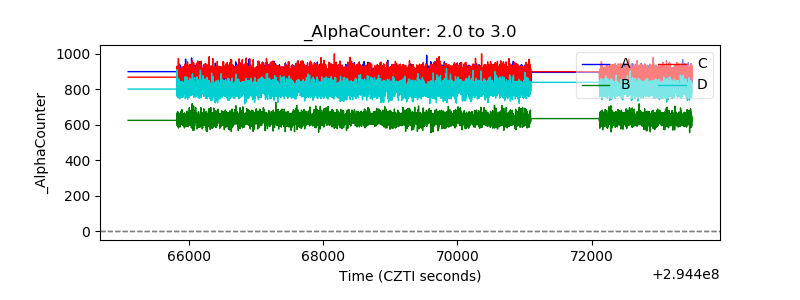 |
| _CPM_Rate | 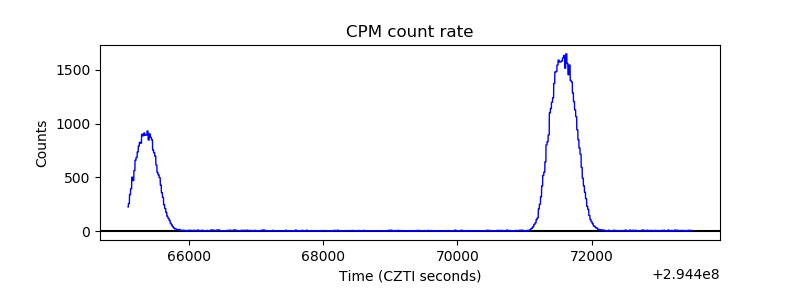 |
| CZT Counter | 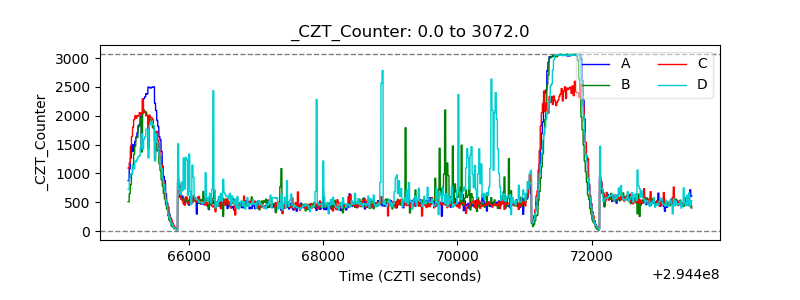 |
| +2.5 Volts monitor |  |
| +5 Volts monitor |  |
| _ROLL_ROT | 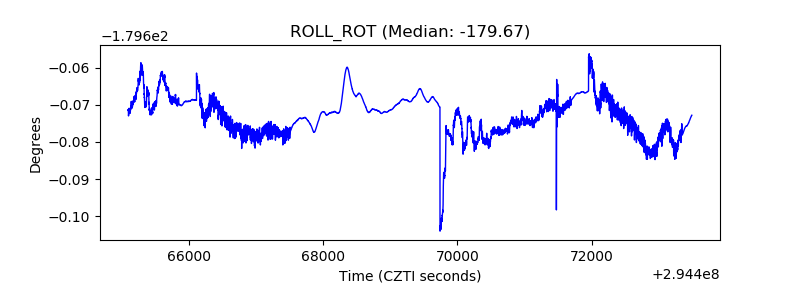 |
| _Roll_DEC | 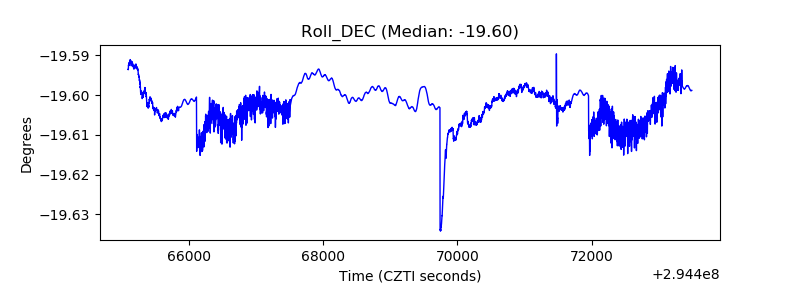 |
| _Roll_RA | 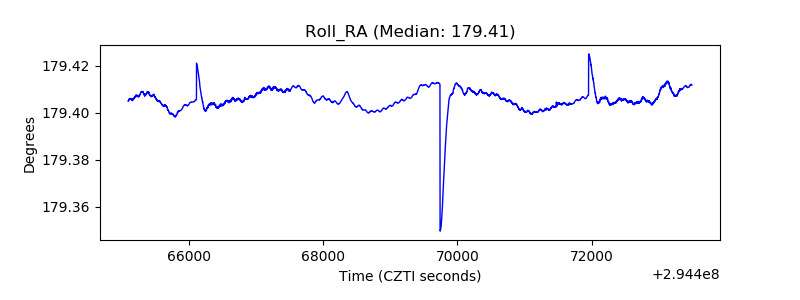 |
| Veto Counter | 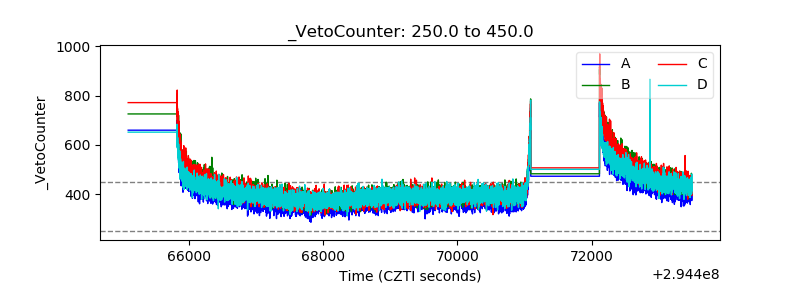 |