| Param | Original file | Final file |
|---|---|---|
| Filename | modeM0/AS1A06_009T02_9000002882cztM0_level2.fits | modeM0/AS1A06_009T02_9000002882cztM0_level2_quad_clean.evt |
| Size (bytes) | 83,839,680 | 92,194,560 |
| Size | 80.0 MB | 87.9 MB |
| Events in quadrant A | 519,560 | 580,423 |
| Events in quadrant B | 497,196 | 581,341 |
| Events in quadrant C | 500,238 | 550,008 |
| Events in quadrant D | 426,938 | 484,612 |
| Mode M9 | |||
|---|---|---|---|
| Quadrant | BADHDUFLAG | Total packets | Discarded packets |
| A | 0 | 12 | 0 |
| B | 0 | 12 | 0 |
| C | 0 | 12 | 0 |
| D | 0 | 12 | 0 |
| Mode M0 | |||
|---|---|---|---|
| Quadrant | BADHDUFLAG | Total packets | Discarded packets |
| A | 0 | 17871 | 0 |
| B | 0 | 19030 | 0 |
| C | 0 | 18306 | 0 |
| D | 0 | 26916 | 0 |
| Mode SS | |||
|---|---|---|---|
| Quadrant | BADHDUFLAG | Total packets | Discarded packets |
| A | 0 | 176 | 0 |
| B | 0 | 176 | 0 |
| C | 0 | 176 | 0 |
| D | 0 | 176 | 0 |
| Quadrant | Total seconds | Saturated seconds | Saturation percentage |
|---|---|---|---|
| A | 8568 | 103 | 1.202148% |
| B | 8568 | 208 | 2.427638% |
| C | 8568 | 171 | 1.995798% |
| D | 8568 | 619 | 7.224556% |
Noise dominated data is calculated using 1-second bins in cleaned event files. If a bin has >2000 counts, and if more than 50% of those come from <1% of pixels, then it is considered to be noise-dominated and hence unusable.
| Quadrant | # 1 sec bins | Bins with >0 counts | Bins with >2000 counts | High rate bins dominated by noise | Noise dominated (total time) | Noise dominated (detector-on time) | Marked lightcurve |
|---|---|---|---|---|---|---|---|
| A | 9773 | 8566 | 0 | 0 | 0.00% | 0.00% | 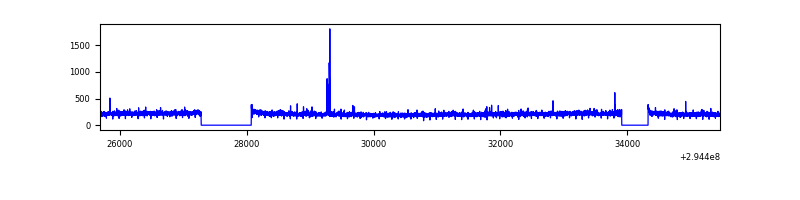 |
| B | 9773 | 8565 | 0 | 0 | 0.00% | 0.00% |  |
| C | 9773 | 8567 | 0 | 0 | 0.00% | 0.00% | 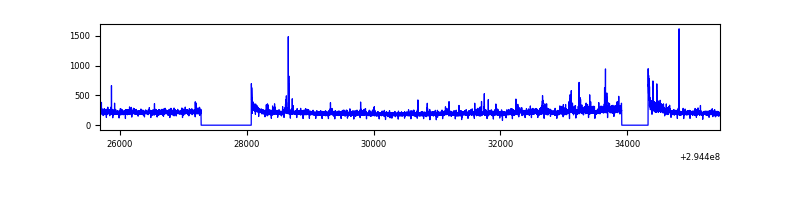 |
| D | 9773 | 8568 | 0 | 0 | 0.00% | 0.00% |  |
Top three noisy pixels from each quadrant. If the there are fewer than three noisy pixels in the level2.evt file, extra rows are filled as -1
| Pixel properties | Quadrant properties | ||||||
|---|---|---|---|---|---|---|---|
| Quadrant | DetID | PixID | Counts | Sigma | Mean | Median | Sigma |
| A | 14 | 188 | 540 | 11.9 | 135 | 127 | 34.7 |
| A | 0 | 29 | 510 | 11.04 | 135 | 127 | 34.7 |
| A | 14 | 204 | 463 | 9.68 | 135 | 127 | 34.7 |
| B | 2 | 9 | 393 | 9.57 | 131 | 125 | 28.0 |
| B | 3 | 17 | 348 | 7.96 | 131 | 125 | 28.0 |
| B | 2 | 8 | 342 | 7.75 | 131 | 125 | 28.0 |
| C | 1 | 80 | 400 | 7.83 | 132 | 123 | 35.3 |
| C | 1 | 81 | 377 | 7.18 | 132 | 123 | 35.3 |
| C | 3 | 235 | 368 | 6.92 | 132 | 123 | 35.3 |
| D | 15 | 46 | 333 | 6.59 | 121 | 110 | 33.8 |
| D | 6 | 83 | 307 | 5.82 | 121 | 110 | 33.8 |
| D | 6 | 231 | 306 | 5.79 | 121 | 110 | 33.8 |
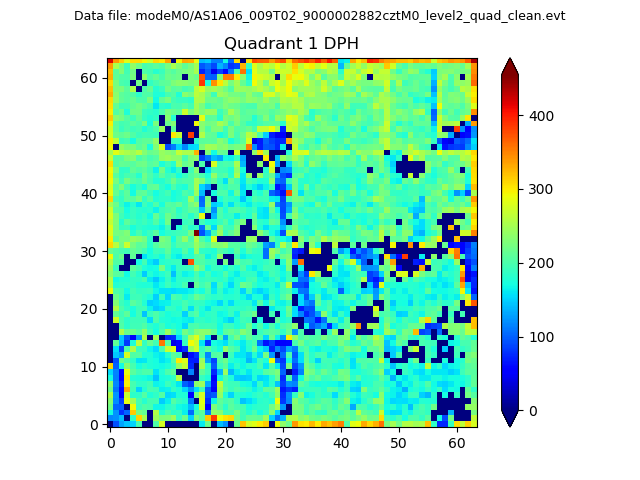
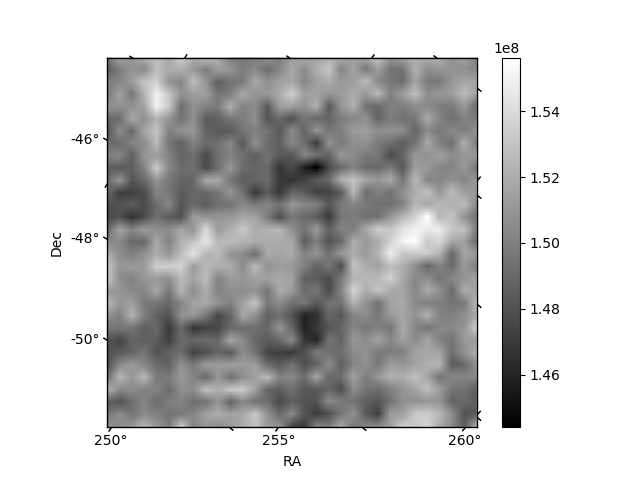
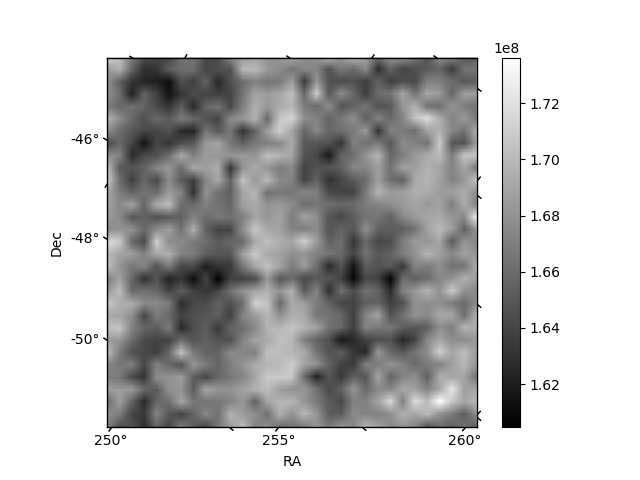
Histogram calculated using DETX and DETY for each event in the final _common_clean file
| Quadrant A |  |
 |
Quadrant B |
|---|---|---|---|
| Quadrant D | 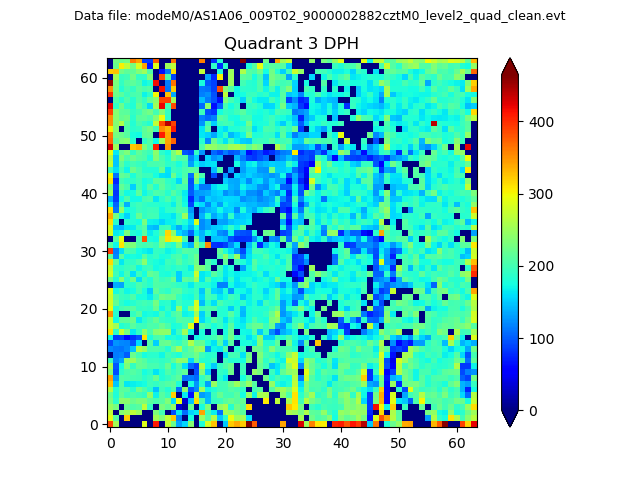 |
 |
Quadrant C |
| Plot type | Count rate plots | Images |
|---|---|---|
| Comparison with Poisson distribution Blue bars denote a histogram of data divided into 1 sec bins. Red curve is a Poisson curve with rate = median count rate of data. |
 |
 |
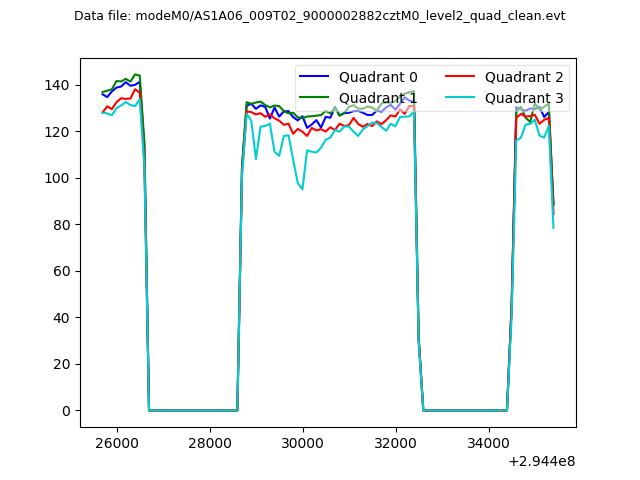
| Quadrant-wise count rates Data is divided into 100 sec bins |
 |
|
| Module-wise count rates for Quadrant A Data is divided into 100 sec bins |
 |
 |
| Module-wise count rates for Quadrant B Data is divided into 100 sec bins |
 |
 |
| Module-wise count rates for Quadrant C Data is divided into 100 sec bins |
 |
 |
| Module-wise count rates for Quadrant D Data is divided into 100 sec bins |
 |
 |
| Parameter | Plot |
|---|---|
| CZT HV Monitor | 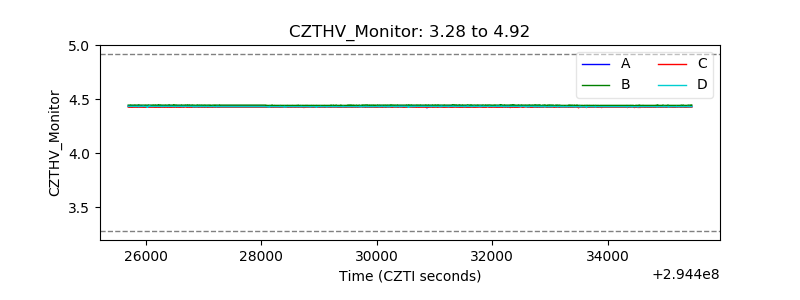 |
| D_VDD |  |
| Temperature 1 |  |
| Veto HV Monitor |  |
| Veto LLD |  |
| Alpha Counter |  |
| _CPM_Rate | 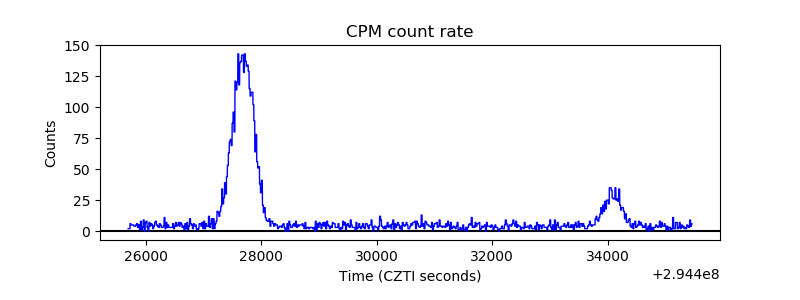 |
| CZT Counter | 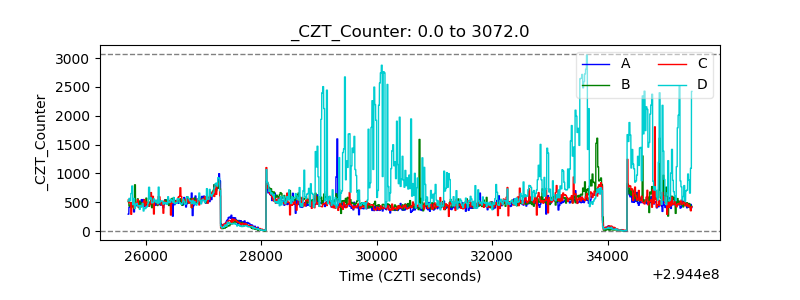 |
| +2.5 Volts monitor |  |
| +5 Volts monitor |  |
| _ROLL_ROT |  |
| _Roll_DEC |  |
| _Roll_RA |  |
| Veto Counter |  |