| Param | Original file | Final file |
|---|---|---|
| Filename | modeM0/AS1A06_009T02_9000002882_19415cztM0_level2.evt | modeM0/AS1A06_009T02_9000002882_19415cztM0_level2_quad_clean.evt |
| Size (bytes) | 625,011,840 | 95,929,920 |
| Size | 596.1 MB | 91.5 MB |
| Events in quadrant A | 3,709,045 | 608,278 |
| Events in quadrant B | 4,138,698 | 616,230 |
| Events in quadrant C | 3,888,375 | 589,552 |
| Events in quadrant D | 6,676,788 | 561,433 |
| Mode M9 | |||
|---|---|---|---|
| Quadrant | BADHDUFLAG | Total packets | Discarded packets |
| A | 0 | 12 | 0 |
| B | 0 | 12 | 0 |
| C | 0 | 12 | 0 |
| D | 0 | 12 | 0 |
| Mode M0 | |||
|---|---|---|---|
| Quadrant | BADHDUFLAG | Total packets | Discarded packets |
| A | 0 | 15948 | 2 |
| B | 0 | 17089 | 2 |
| C | 0 | 16356 | 2 |
| D | 0 | 24945 | 2 |
| Mode SS | |||
|---|---|---|---|
| Quadrant | BADHDUFLAG | Total packets | Discarded packets |
| A | 0 | 156 | 0 |
| B | 0 | 156 | 0 |
| C | 0 | 156 | 0 |
| D | 0 | 156 | 0 |
| Quadrant | Total seconds | Saturated seconds | Saturation percentage |
|---|---|---|---|
| A | 7613 | 103 | 1.352949% |
| B | 7614 | 207 | 2.718676% |
| C | 7614 | 166 | 2.180194% |
| D | 7614 | 619 | 8.129761% |
Noise dominated data is calculated using 1-second bins in cleaned event files. If a bin has >2000 counts, and if more than 50% of those come from <1% of pixels, then it is considered to be noise-dominated and hence unusable.
| Quadrant | # 1 sec bins | Bins with >0 counts | Bins with >2000 counts | High rate bins dominated by noise | Noise dominated (total time) | Noise dominated (detector-on time) | Marked lightcurve |
|---|---|---|---|---|---|---|---|
| A | 8818 | 7613 | 1 | 1 | 0.01% | 0.01% | 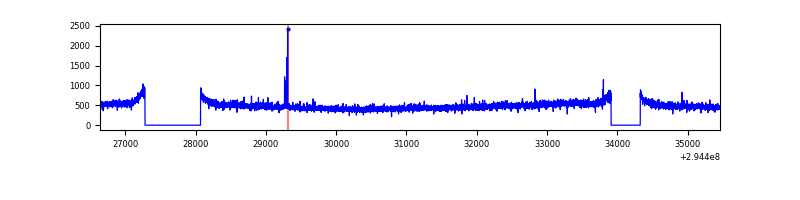 |
| B | 8819 | 7614 | 15 | 15 | 0.17% | 0.20% | 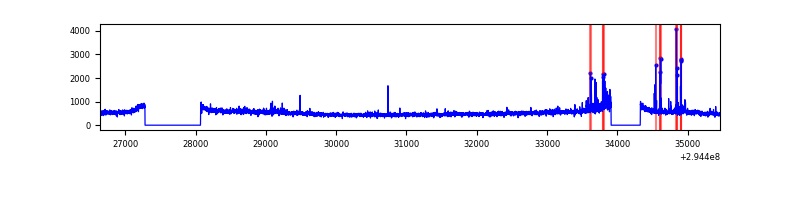 |
| C | 8819 | 7615 | 1 | 1 | 0.01% | 0.01% | 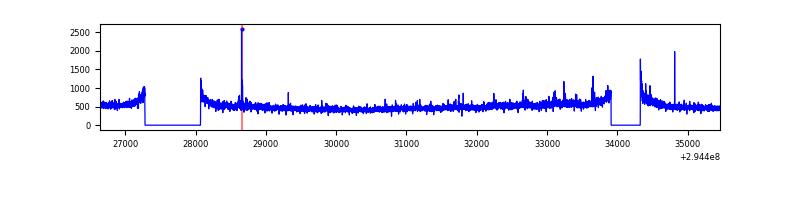 |
| D | 8819 | 7616 | 542 | 542 | 6.15% | 7.12% | 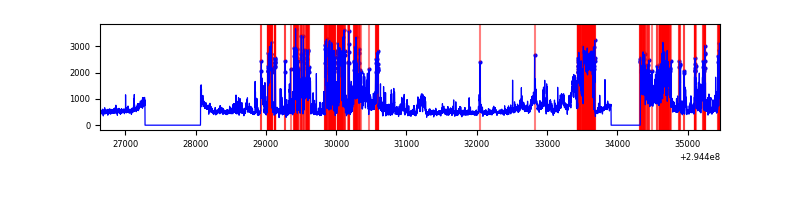 |
Top three noisy pixels from each quadrant. If the there are fewer than three noisy pixels in the level2.evt file, extra rows are filled as -1
| Pixel properties | Quadrant properties | ||||||
|---|---|---|---|---|---|---|---|
| Quadrant | DetID | PixID | Counts | Sigma | Mean | Median | Sigma |
| A | 15 | 174 | 21632 | 106.81 | 954 | 931 | 193.8 |
| A | 13 | 254 | 11887 | 56.53 | 954 | 931 | 193.8 |
| A | 11 | 29 | 8612 | 39.63 | 954 | 931 | 193.8 |
| B | 4 | 174 | 235288 | 1286.27 | 949 | 922 | 182.2 |
| B | 7 | 220 | 119981 | 653.43 | 949 | 922 | 182.2 |
| B | 0 | 190 | 22258 | 117.1 | 949 | 922 | 182.2 |
| C | 3 | 233 | 163376 | 763.24 | 911 | 917 | 212.9 |
| C | 14 | 238 | 142325 | 664.34 | 911 | 917 | 212.9 |
| C | 0 | 207 | 14031 | 61.61 | 911 | 917 | 212.9 |
| D | 7 | 238 | 3210054 | 14724.56 | 902 | 877 | 217.9 |
| D | 2 | 234 | 31632 | 141.11 | 902 | 877 | 217.9 |
| D | 8 | 195 | 22648 | 99.89 | 902 | 877 | 217.9 |
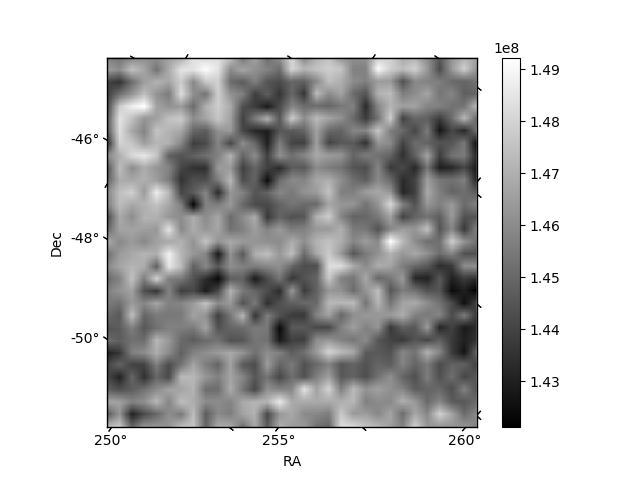
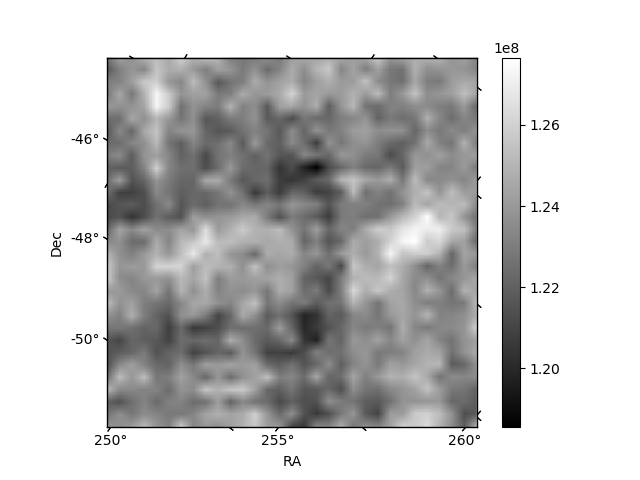
Histogram calculated using DETX and DETY for each event in the final _common_clean file
| Quadrant A | 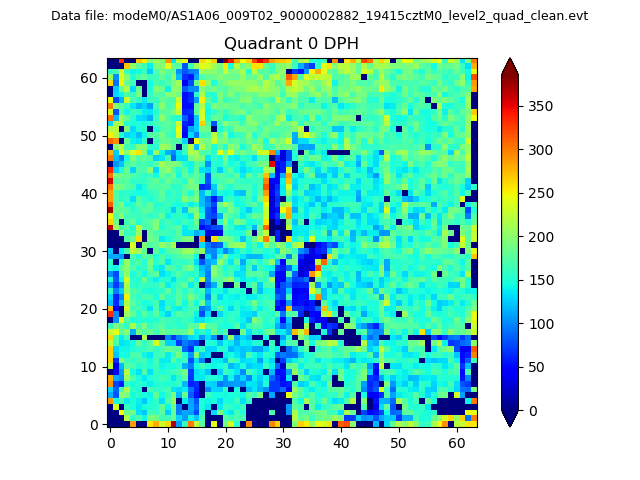 |
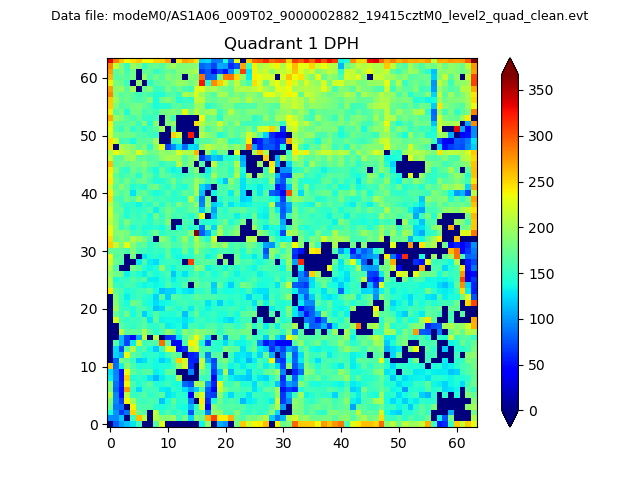 |
Quadrant B |
|---|---|---|---|
| Quadrant D |  |
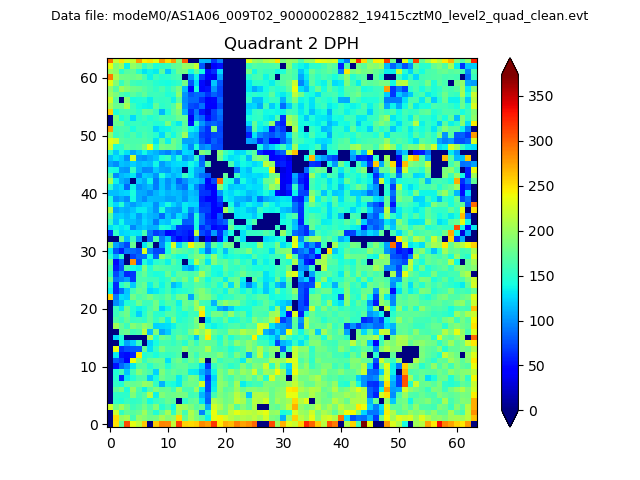 |
Quadrant C |
| Plot type | Count rate plots | Images |
|---|---|---|
| Comparison with Poisson distribution Blue bars denote a histogram of data divided into 1 sec bins. Red curve is a Poisson curve with rate = median count rate of data. |
 |
 |
| Quadrant-wise count rates Data is divided into 100 sec bins |
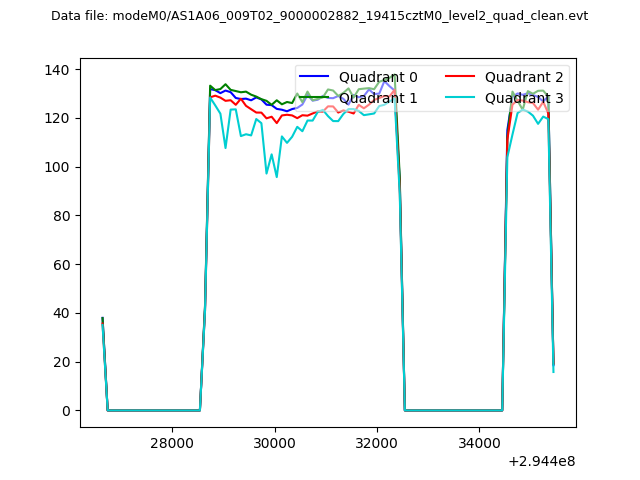 |
|
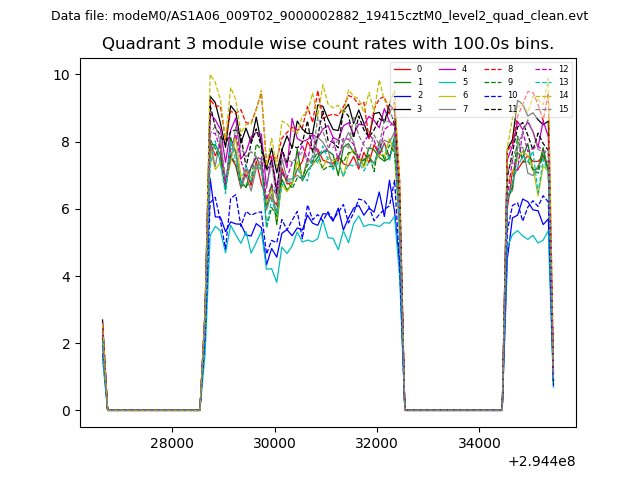
| Module-wise count rates for Quadrant A Data is divided into 100 sec bins |
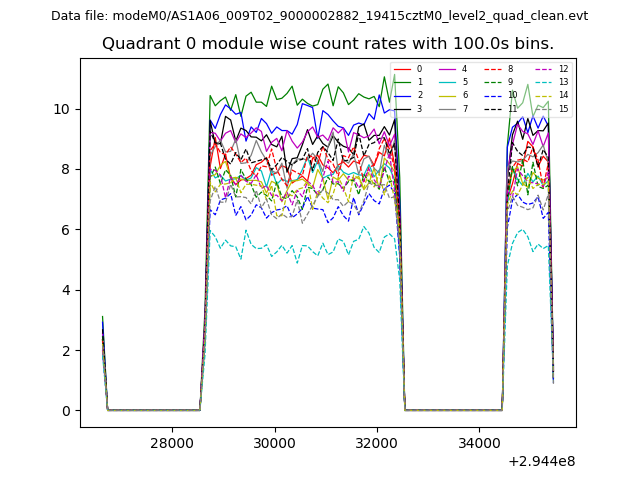 |
 |
| Module-wise count rates for Quadrant B Data is divided into 100 sec bins |
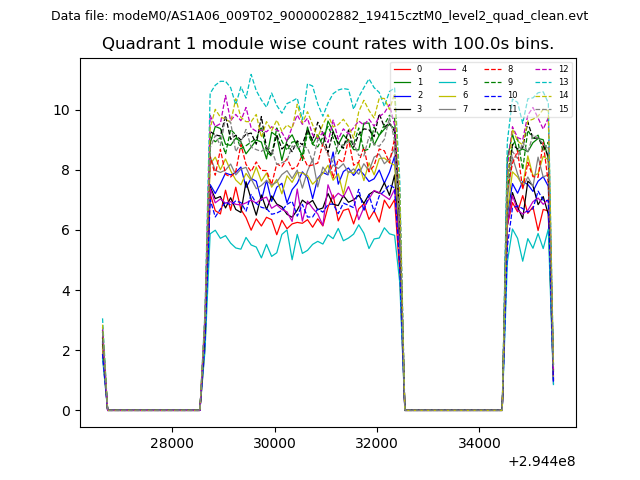 |
 |
| Module-wise count rates for Quadrant C Data is divided into 100 sec bins |
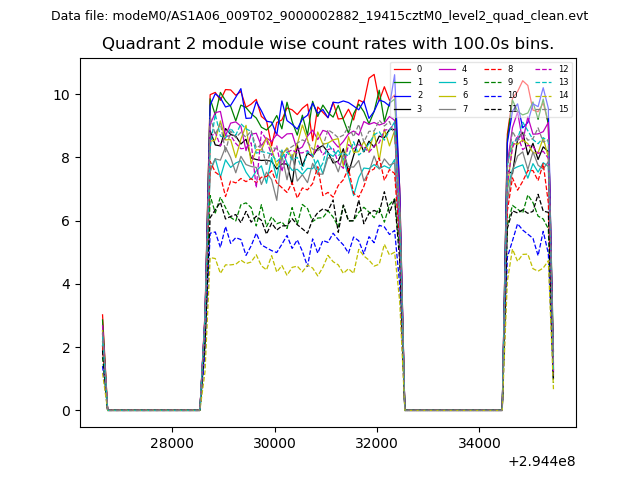 |
 |
| Module-wise count rates for Quadrant D Data is divided into 100 sec bins |
 |
 |
| Parameter | Plot |
|---|---|
| CZT HV Monitor | 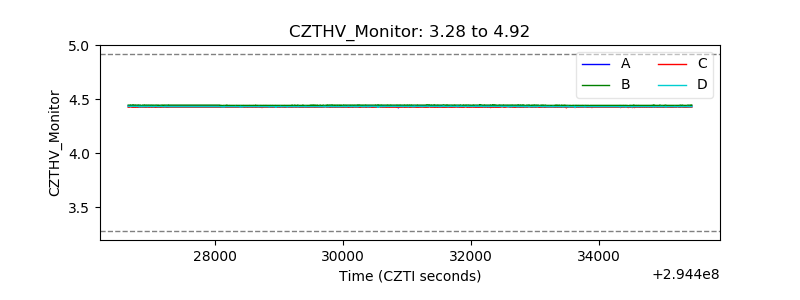 |
| D_VDD | 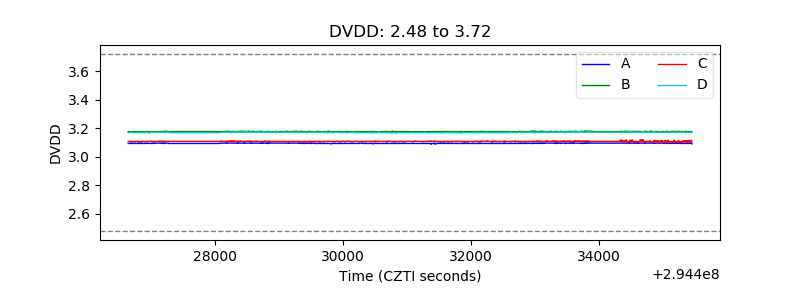 |
| Temperature 1 | 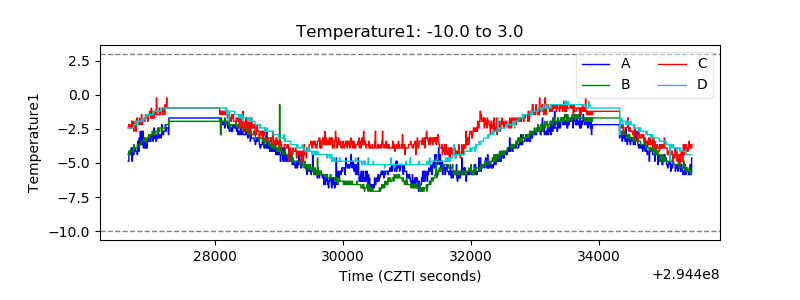 |
| Veto HV Monitor |  |
| Veto LLD |  |
| Alpha Counter | 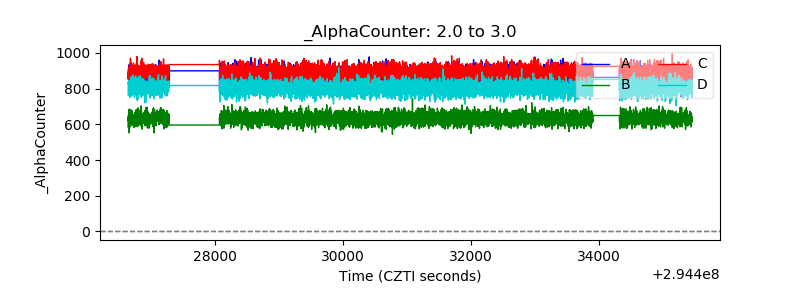 |
| _CPM_Rate | 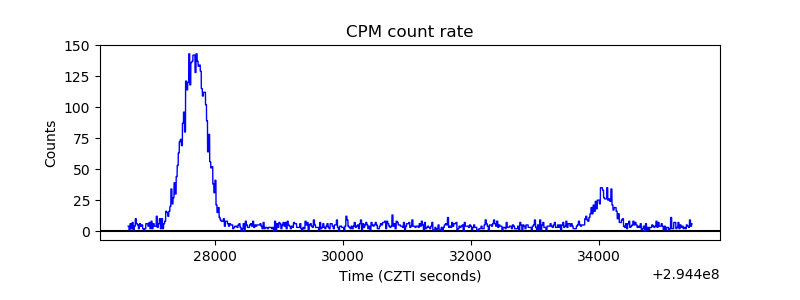 |
| CZT Counter |  |
| +2.5 Volts monitor |  |
| +5 Volts monitor | 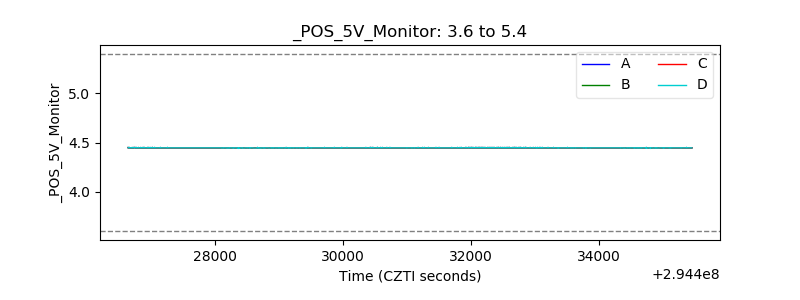 |
| _ROLL_ROT | 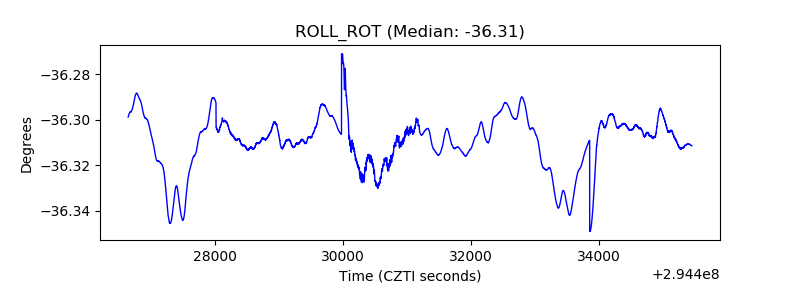 |
| _Roll_DEC | 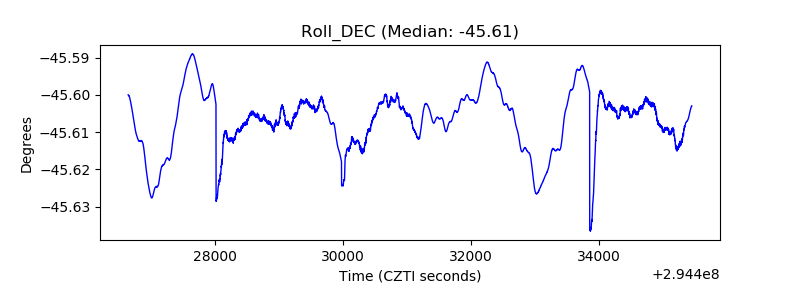 |
| _Roll_RA |  |
| Veto Counter | 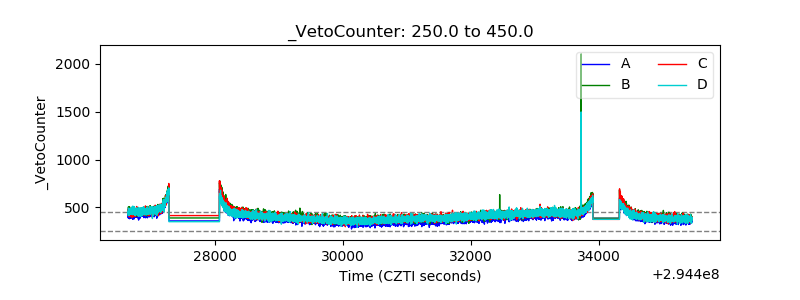 |