| Param | Original file | Final file |
|---|---|---|
| Filename | modeM0/AS1T03_028T01_9000002880_19411cztM0_level2.evt | modeM0/AS1T03_028T01_9000002880_19411cztM0_level2_quad_clean.evt |
| Size (bytes) | 536,181,120 | 73,189,440 |
| Size | 511.3 MB | 69.8 MB |
| Events in quadrant A | 3,533,272 | 454,667 |
| Events in quadrant B | 3,741,264 | 455,954 |
| Events in quadrant C | 3,546,799 | 426,124 |
| Events in quadrant D | 4,973,988 | 423,624 |
| Mode M0 | |||
|---|---|---|---|
| Quadrant | BADHDUFLAG | Total packets | Discarded packets |
| A | 0 | 14307 | 2 |
| B | 0 | 15113 | 2 |
| C | 0 | 14316 | 2 |
| D | 0 | 19319 | 2 |
| Mode M9 | |||
|---|---|---|---|
| Quadrant | BADHDUFLAG | Total packets | Discarded packets |
| A | 0 | 17 | 0 |
| B | 0 | 18 | 0 |
| C | 0 | 18 | 0 |
| D | 0 | 18 | 0 |
| Mode SS | |||
|---|---|---|---|
| Quadrant | BADHDUFLAG | Total packets | Discarded packets |
| A | 0 | 134 | 0 |
| B | 0 | 134 | 0 |
| C | 0 | 134 | 0 |
| D | 0 | 134 | 0 |
| Quadrant | Total seconds | Saturated seconds | Saturation percentage |
|---|---|---|---|
| A | 6529 | 127 | 1.945168% |
| B | 6529 | 137 | 2.098331% |
| C | 6529 | 165 | 2.527186% |
| D | 6529 | 216 | 3.308317% |
Noise dominated data is calculated using 1-second bins in cleaned event files. If a bin has >2000 counts, and if more than 50% of those come from <1% of pixels, then it is considered to be noise-dominated and hence unusable.
| Quadrant | # 1 sec bins | Bins with >0 counts | Bins with >2000 counts | High rate bins dominated by noise | Noise dominated (total time) | Noise dominated (detector-on time) | Marked lightcurve |
|---|---|---|---|---|---|---|---|
| A | 7824 | 6529 | 0 | 0 | 0.00% | 0.00% | 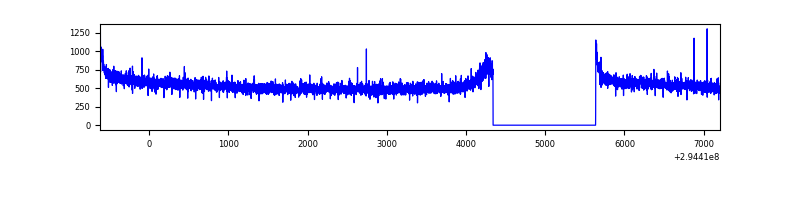 |
| B | 7824 | 6529 | 11 | 11 | 0.14% | 0.17% | 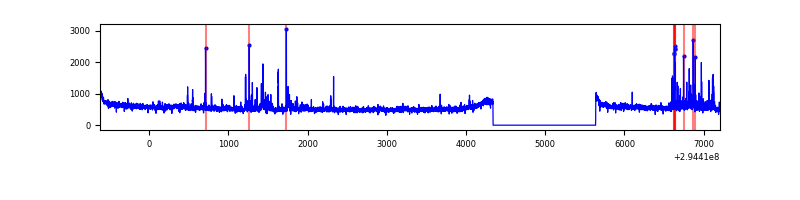 |
| C | 7824 | 6529 | 4 | 4 | 0.05% | 0.06% | 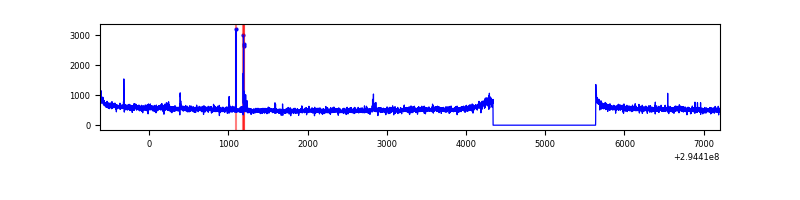 |
| D | 7824 | 6529 | 111 | 111 | 1.42% | 1.70% | 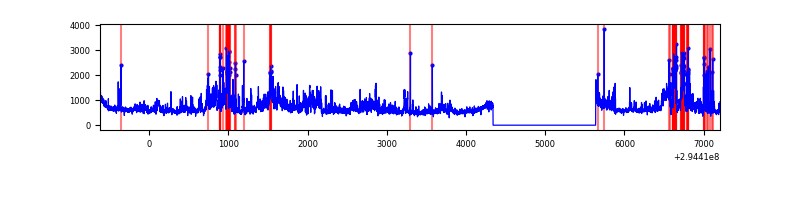 |
Top three noisy pixels from each quadrant. If the there are fewer than three noisy pixels in the level2.evt file, extra rows are filled as -1
| Pixel properties | Quadrant properties | ||||||
|---|---|---|---|---|---|---|---|
| Quadrant | DetID | PixID | Counts | Sigma | Mean | Median | Sigma |
| A | 13 | 254 | 9950 | 49.72 | 916 | 900 | 182.0 |
| A | 0 | 226 | 7980 | 38.89 | 916 | 900 | 182.0 |
| A | 3 | 137 | 6775 | 32.27 | 916 | 900 | 182.0 |
| B | 7 | 220 | 126049 | 742.4 | 899 | 880 | 168.6 |
| B | 0 | 197 | 23196 | 132.36 | 899 | 880 | 168.6 |
| B | 0 | 198 | 22804 | 130.04 | 899 | 880 | 168.6 |
| C | 14 | 238 | 136180 | 691.53 | 851 | 857 | 195.7 |
| C | 3 | 233 | 45326 | 227.25 | 851 | 857 | 195.7 |
| C | 0 | 207 | 23149 | 113.92 | 851 | 857 | 195.7 |
| D | 7 | 238 | 1423780 | 6678.66 | 879 | 856 | 213.1 |
| D | 1 | 52 | 123044 | 573.5 | 879 | 856 | 213.1 |
| D | 7 | 38 | 56153 | 259.54 | 879 | 856 | 213.1 |
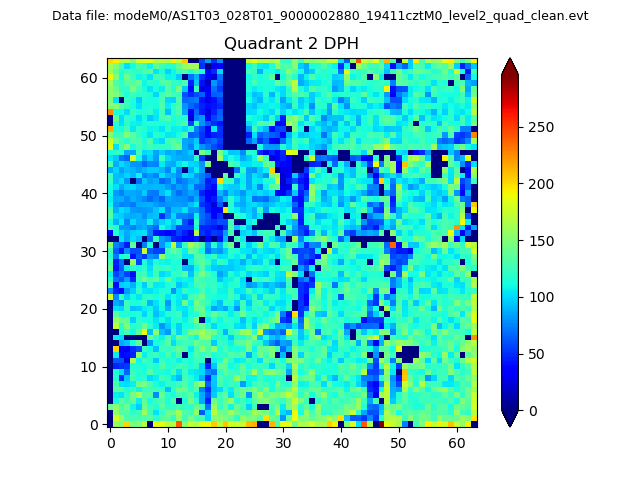
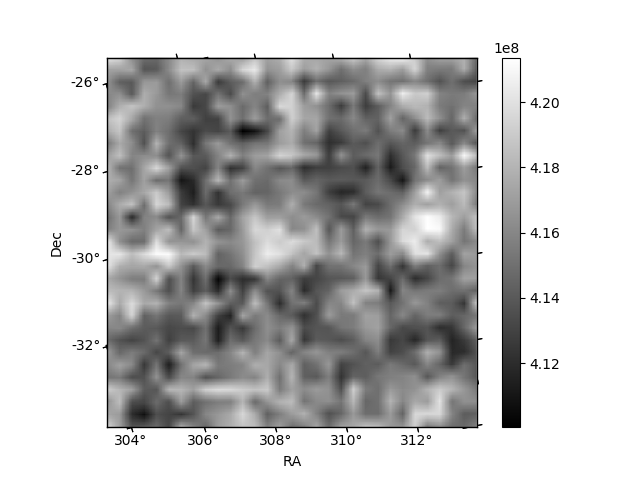
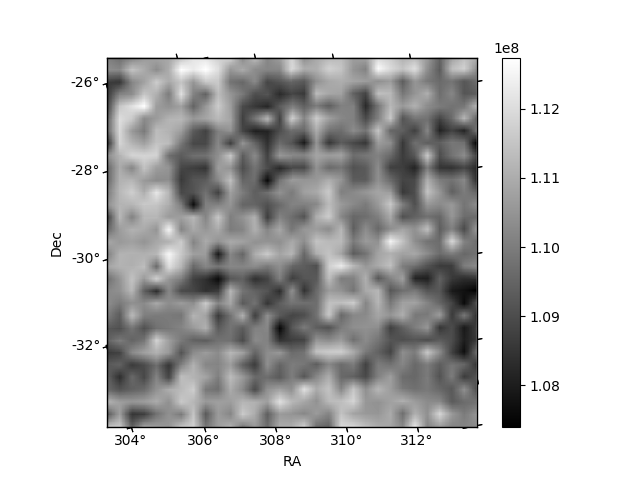
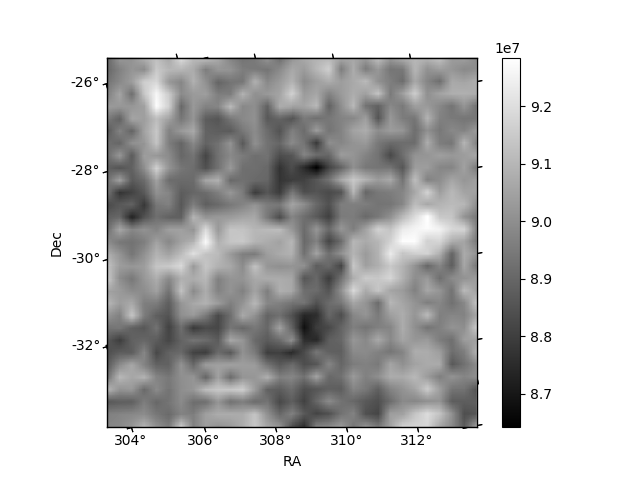
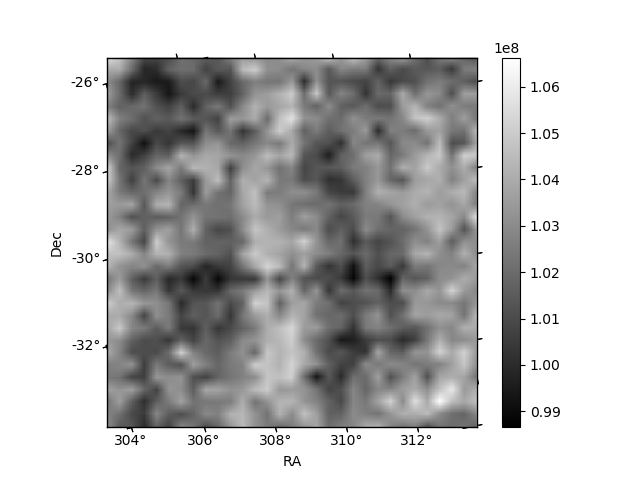
Histogram calculated using DETX and DETY for each event in the final _common_clean file
| Quadrant A | 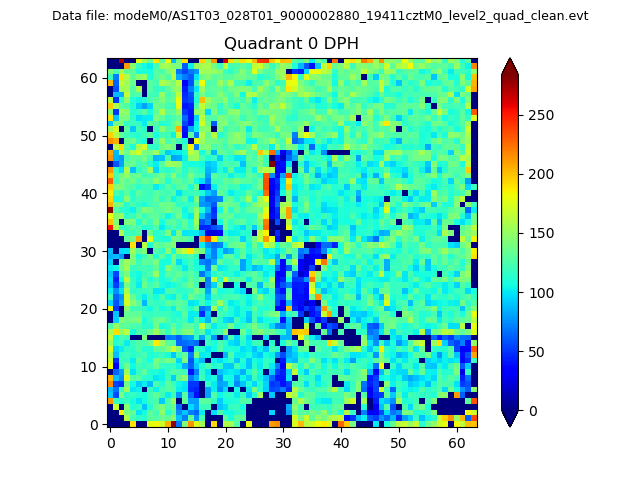 |
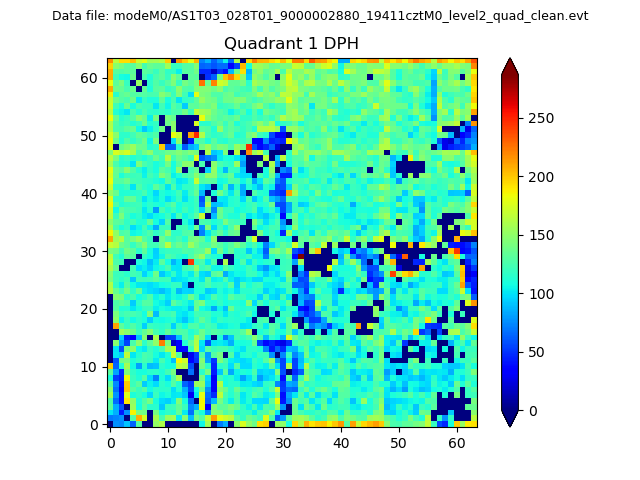 |
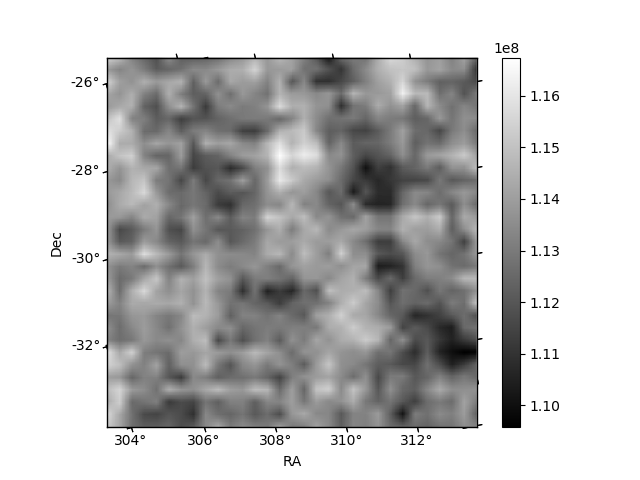
Quadrant B |
|---|---|---|---|
| Quadrant D | 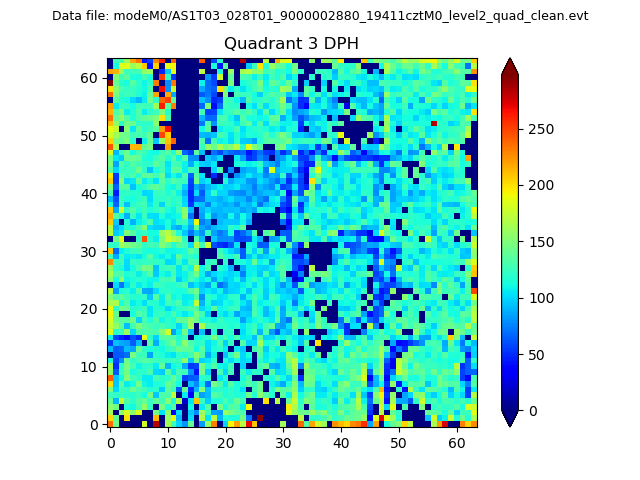 |
 |
Quadrant C |
| Plot type | Count rate plots | Images |
|---|---|---|
| Comparison with Poisson distribution Blue bars denote a histogram of data divided into 1 sec bins. Red curve is a Poisson curve with rate = median count rate of data. |
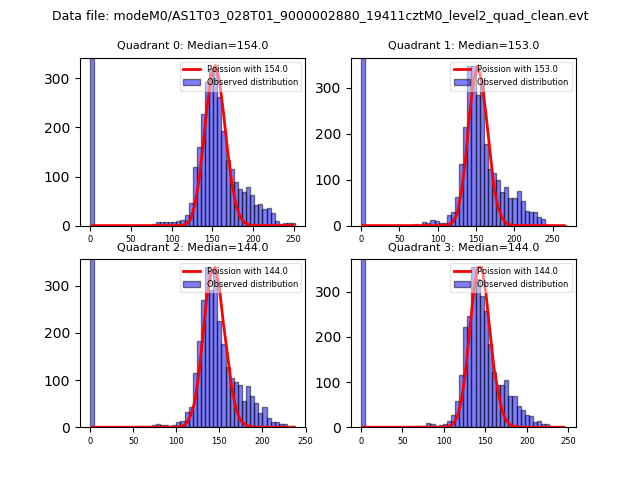 |
 |
| Quadrant-wise count rates Data is divided into 100 sec bins |
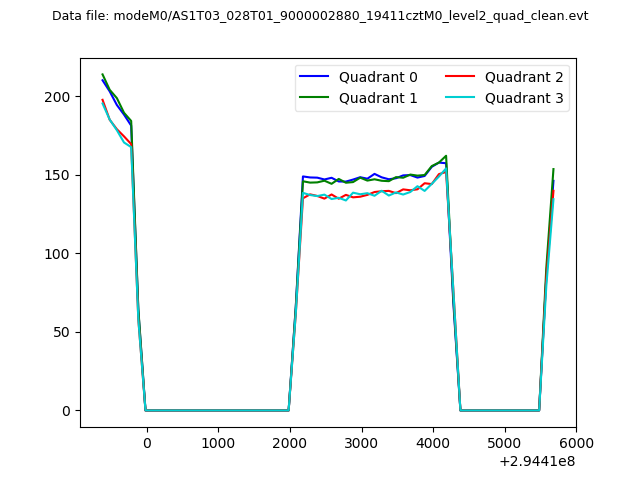 |
|
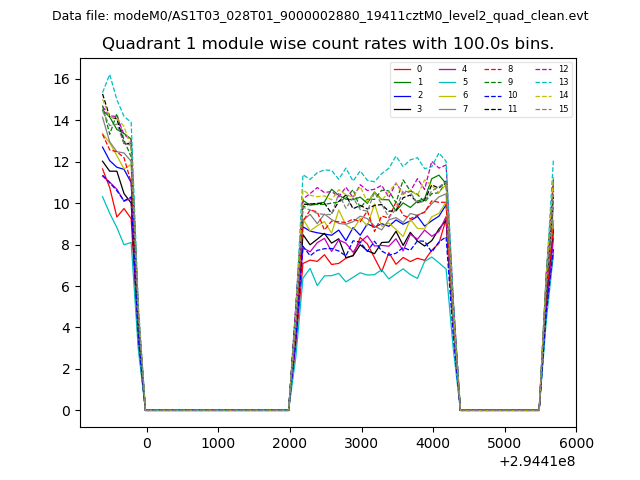
| Module-wise count rates for Quadrant A Data is divided into 100 sec bins |
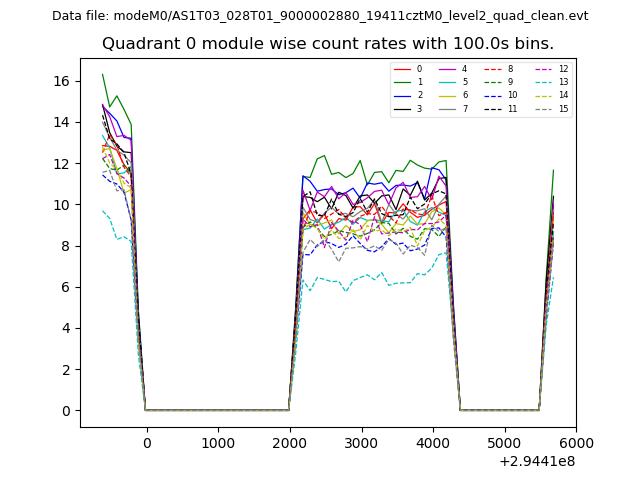 |
 |
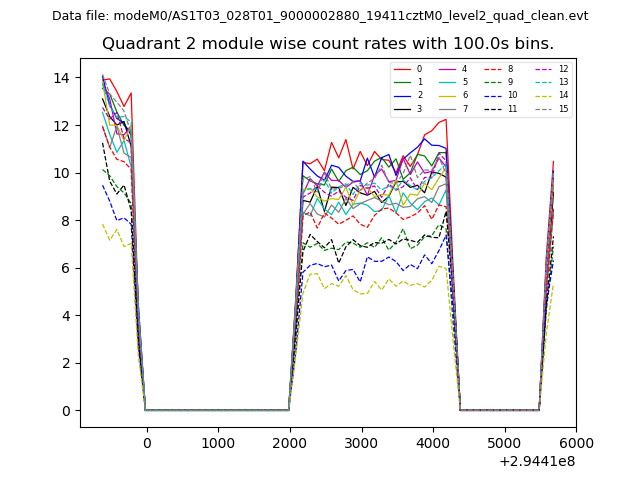
| Module-wise count rates for Quadrant B Data is divided into 100 sec bins |
 |
 |
| Module-wise count rates for Quadrant C Data is divided into 100 sec bins |
 |
 |
| Module-wise count rates for Quadrant D Data is divided into 100 sec bins |
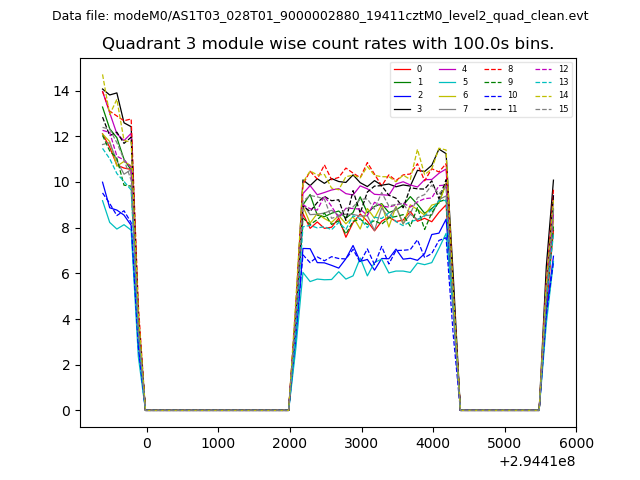 |
 |
| Parameter | Plot |
|---|---|
| CZT HV Monitor | 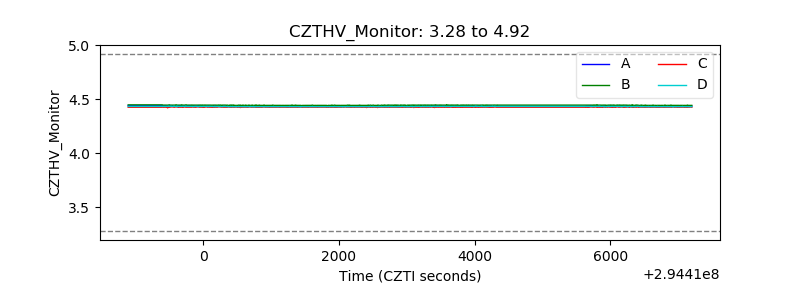 |
| D_VDD | 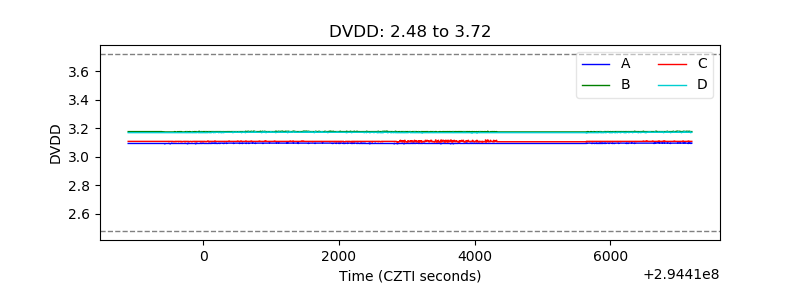 |
| Temperature 1 | 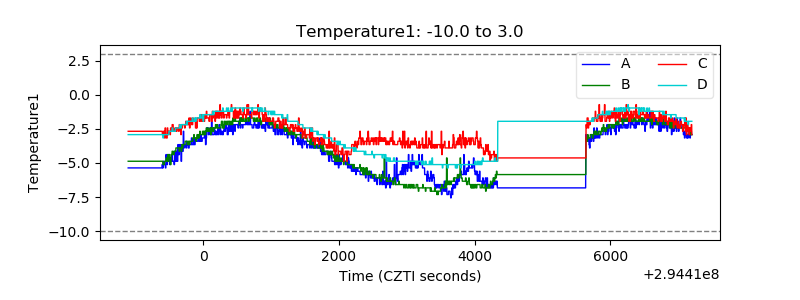 |
| Veto HV Monitor | 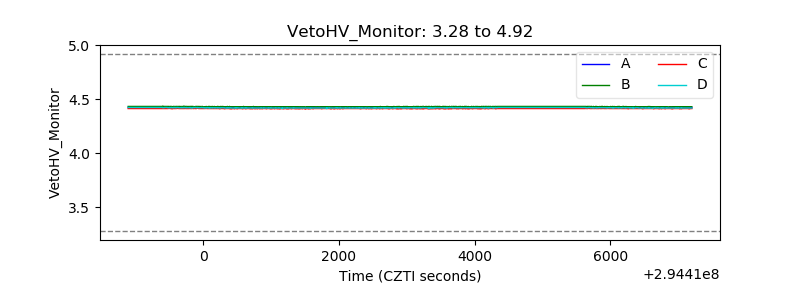 |
| Veto LLD | 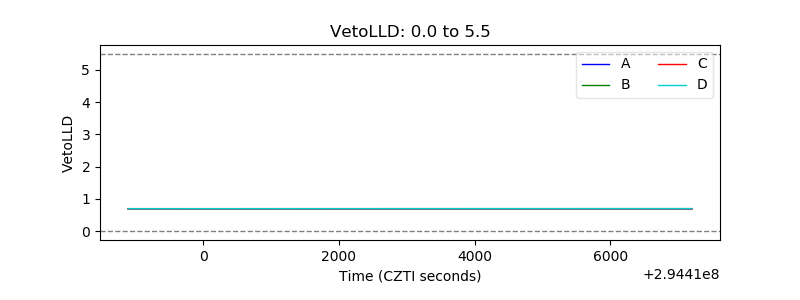 |
| Alpha Counter | 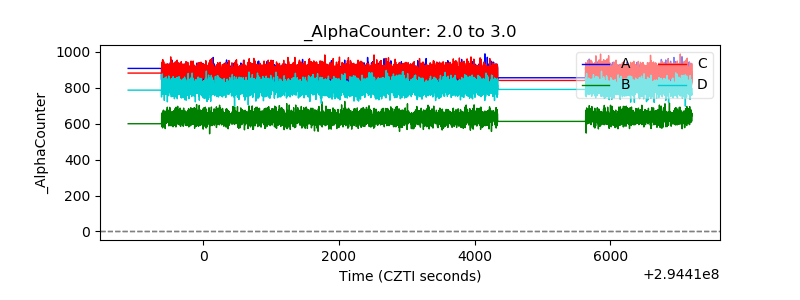 |
| _CPM_Rate | 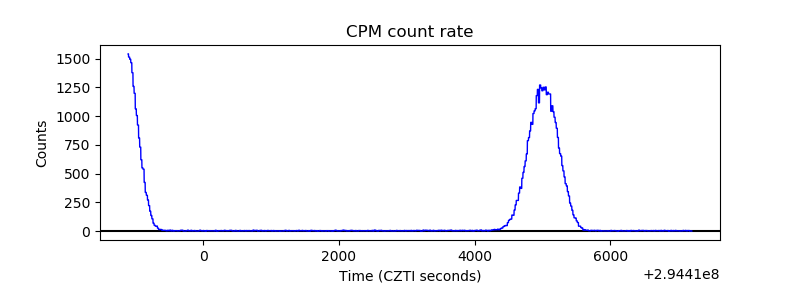 |
| CZT Counter | 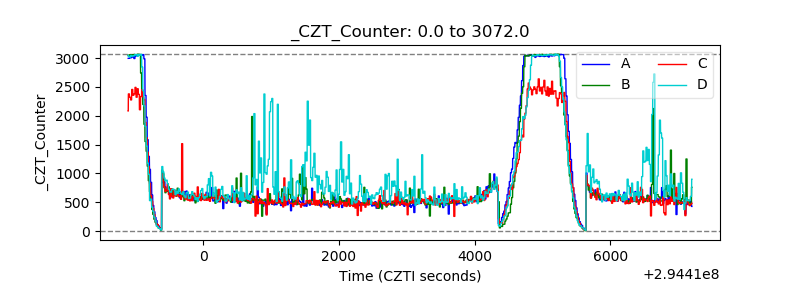 |
| +2.5 Volts monitor |  |
| +5 Volts monitor | 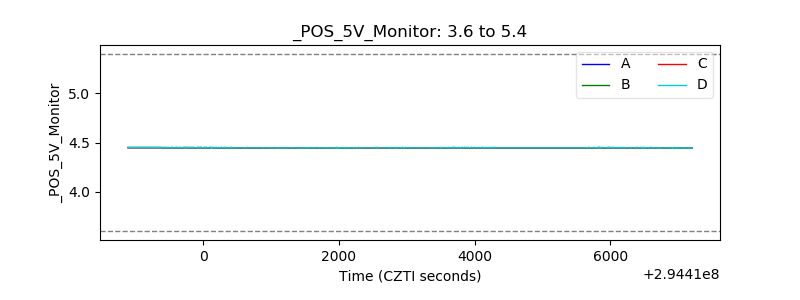 |
| _ROLL_ROT | 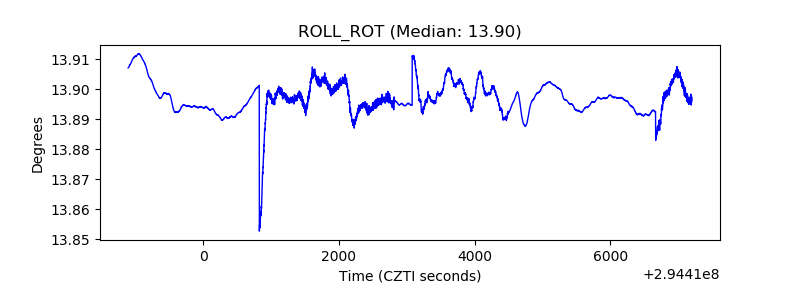 |
| _Roll_DEC | 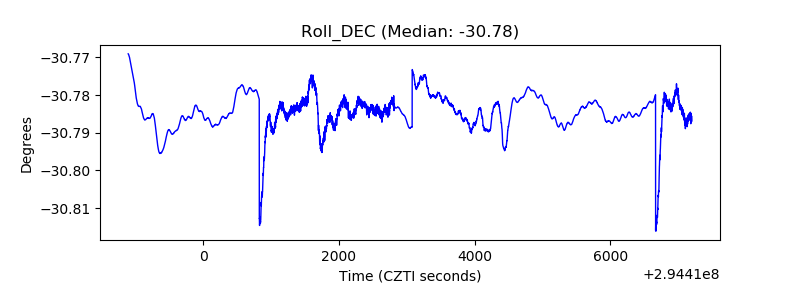 |
| _Roll_RA | 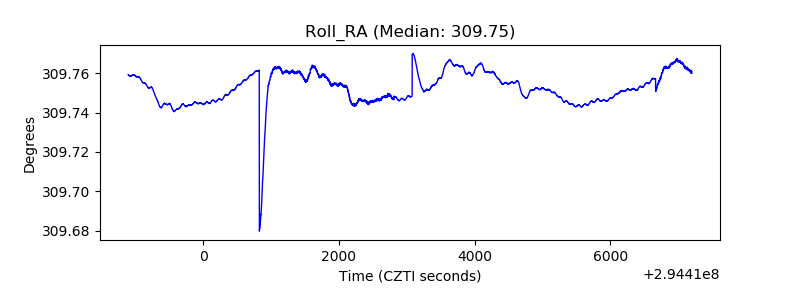 |
| Veto Counter | 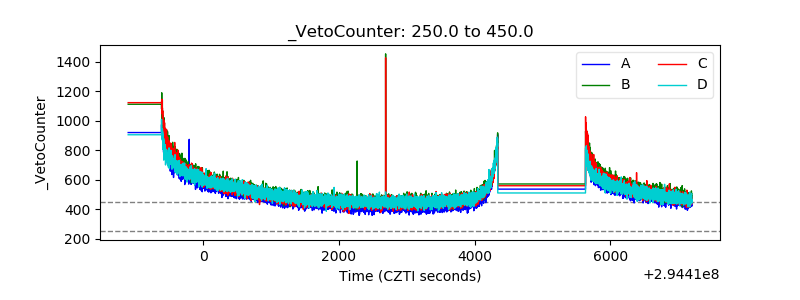 |