| Param | Original file | Final file |
|---|---|---|
| Filename | modeM0/AS1T03_028T01_9000002880_19412cztM0_level2.evt | modeM0/AS1T03_028T01_9000002880_19412cztM0_level2_quad_clean.evt |
| Size (bytes) | 521,398,080 | 65,407,680 |
| Size | 497.2 MB | 62.4 MB |
| Events in quadrant A | 3,242,736 | 400,304 |
| Events in quadrant B | 3,448,042 | 396,692 |
| Events in quadrant C | 3,295,000 | 376,008 |
| Events in quadrant D | 5,379,269 | 369,226 |
| Mode M0 | |||
|---|---|---|---|
| Quadrant | BADHDUFLAG | Total packets | Discarded packets |
| A | 0 | 13262 | 1 |
| B | 0 | 13922 | 1 |
| C | 0 | 13411 | 1 |
| D | 0 | 20233 | 1 |
| Mode M9 | |||
|---|---|---|---|
| Quadrant | BADHDUFLAG | Total packets | Discarded packets |
| A | 0 | 12 | 0 |
| B | 0 | 12 | 0 |
| C | 0 | 12 | 0 |
| D | 0 | 12 | 0 |
| Mode SS | |||
|---|---|---|---|
| Quadrant | BADHDUFLAG | Total packets | Discarded packets |
| A | 0 | 126 | 0 |
| B | 0 | 126 | 0 |
| C | 0 | 126 | 0 |
| D | 0 | 126 | 0 |
| Quadrant | Total seconds | Saturated seconds | Saturation percentage |
|---|---|---|---|
| A | 6282 | 118 | 1.878383% |
| B | 6282 | 156 | 2.483286% |
| C | 6282 | 134 | 2.133079% |
| D | 6282 | 376 | 5.985355% |
Noise dominated data is calculated using 1-second bins in cleaned event files. If a bin has >2000 counts, and if more than 50% of those come from <1% of pixels, then it is considered to be noise-dominated and hence unusable.
| Quadrant | # 1 sec bins | Bins with >0 counts | Bins with >2000 counts | High rate bins dominated by noise | Noise dominated (total time) | Noise dominated (detector-on time) | Marked lightcurve |
|---|---|---|---|---|---|---|---|
| A | 7417 | 6282 | 0 | 0 | 0.00% | 0.00% | 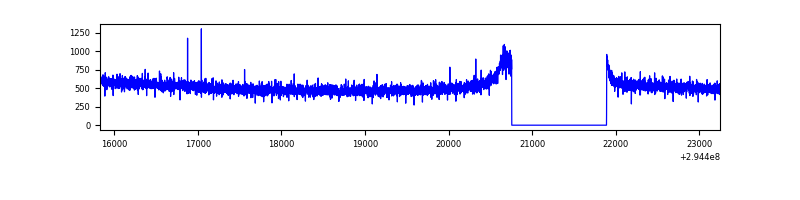 |
| B | 7417 | 6282 | 17 | 17 | 0.23% | 0.27% | 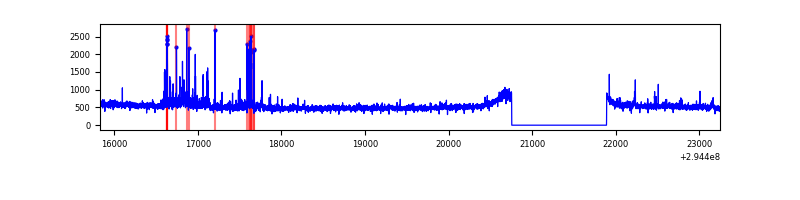 |
| C | 7417 | 6282 | 0 | 0 | 0.00% | 0.00% | 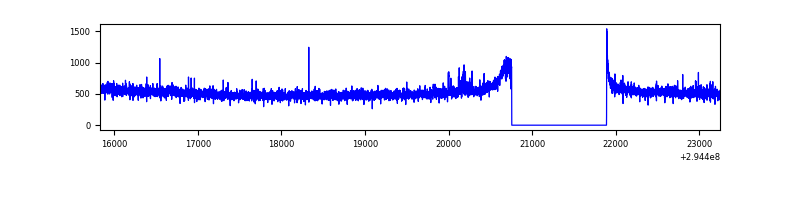 |
| D | 7417 | 6282 | 286 | 286 | 3.86% | 4.55% | 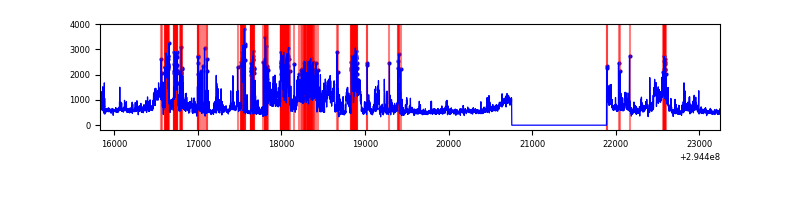 |
Top three noisy pixels from each quadrant. If the there are fewer than three noisy pixels in the level2.evt file, extra rows are filled as -1
| Pixel properties | Quadrant properties | ||||||
|---|---|---|---|---|---|---|---|
| Quadrant | DetID | PixID | Counts | Sigma | Mean | Median | Sigma |
| A | 13 | 254 | 9558 | 51.77 | 840 | 824 | 168.7 |
| A | 0 | 226 | 7379 | 38.85 | 840 | 824 | 168.7 |
| A | 3 | 137 | 6285 | 32.37 | 840 | 824 | 168.7 |
| B | 7 | 220 | 110872 | 699.18 | 827 | 807 | 157.4 |
| B | 0 | 190 | 29393 | 181.59 | 827 | 807 | 157.4 |
| B | 0 | 197 | 18261 | 110.88 | 827 | 807 | 157.4 |
| C | 14 | 238 | 125162 | 683.51 | 789 | 794 | 182.0 |
| C | 3 | 233 | 49827 | 269.48 | 789 | 794 | 182.0 |
| C | 7 | 220 | 27517 | 146.87 | 789 | 794 | 182.0 |
| D | 7 | 238 | 2018292 | 10511.97 | 799 | 776 | 191.9 |
| D | 1 | 52 | 299078 | 1554.26 | 799 | 776 | 191.9 |
| D | 2 | 234 | 27599 | 139.76 | 799 | 776 | 191.9 |
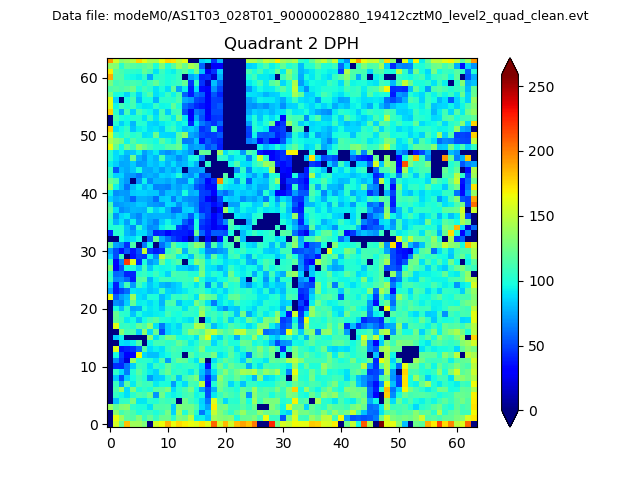
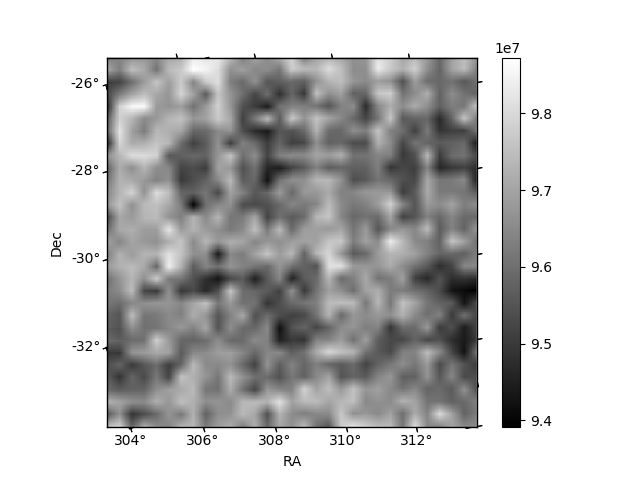
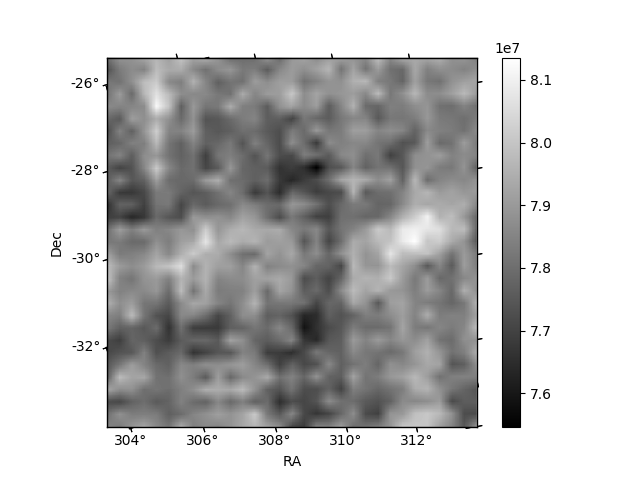
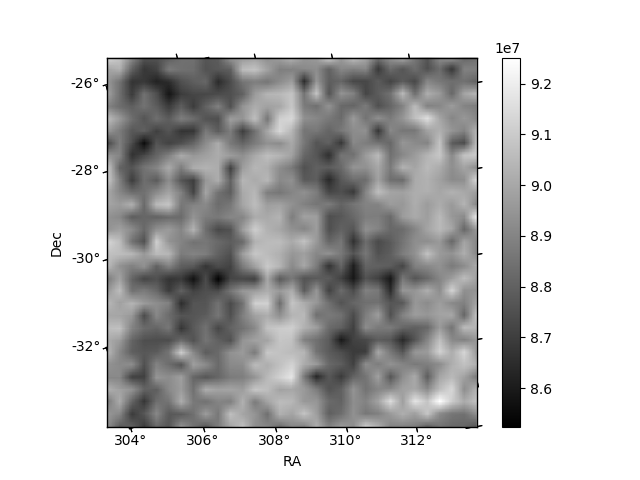
Histogram calculated using DETX and DETY for each event in the final _common_clean file
| Quadrant A |  |
 |
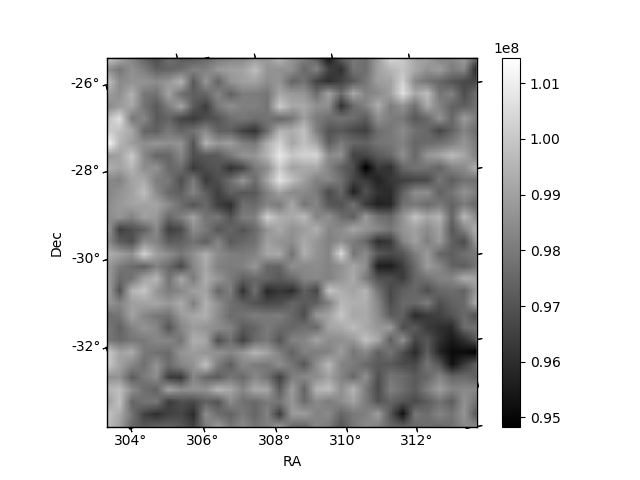
Quadrant B |
|---|---|---|---|
| Quadrant D |  |
 |
Quadrant C |
| Plot type | Count rate plots | Images |
|---|---|---|
| Comparison with Poisson distribution Blue bars denote a histogram of data divided into 1 sec bins. Red curve is a Poisson curve with rate = median count rate of data. |
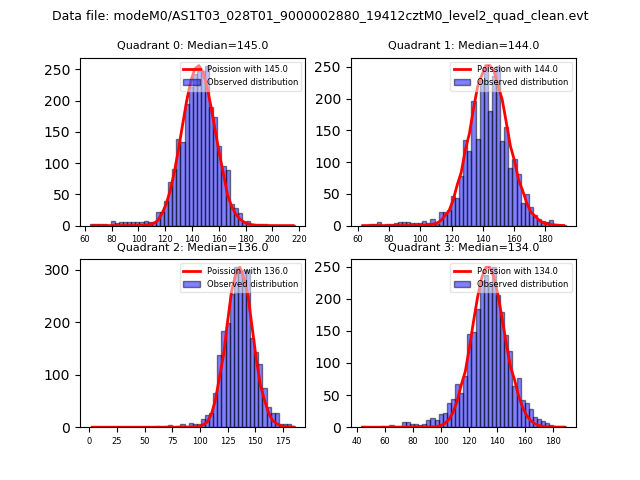 |
 |
| Quadrant-wise count rates Data is divided into 100 sec bins |
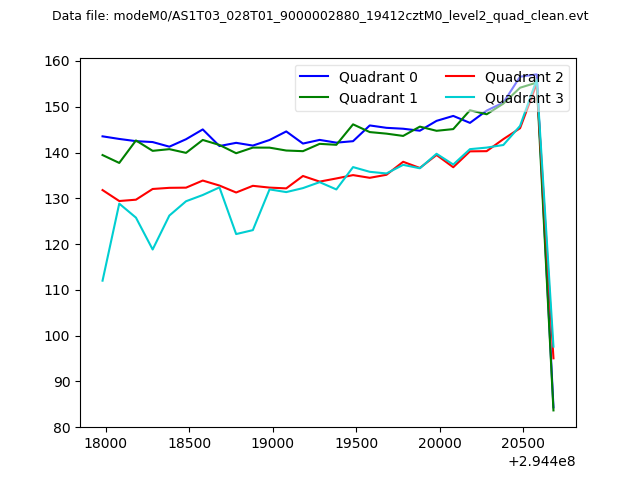 |
|
| Module-wise count rates for Quadrant A Data is divided into 100 sec bins |
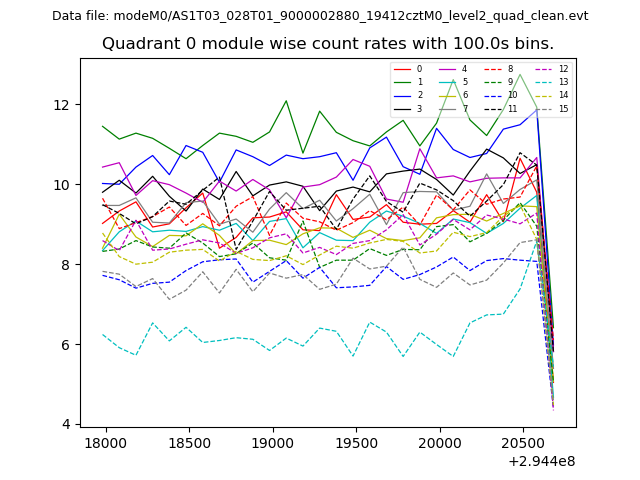 |
 |
| Module-wise count rates for Quadrant B Data is divided into 100 sec bins |
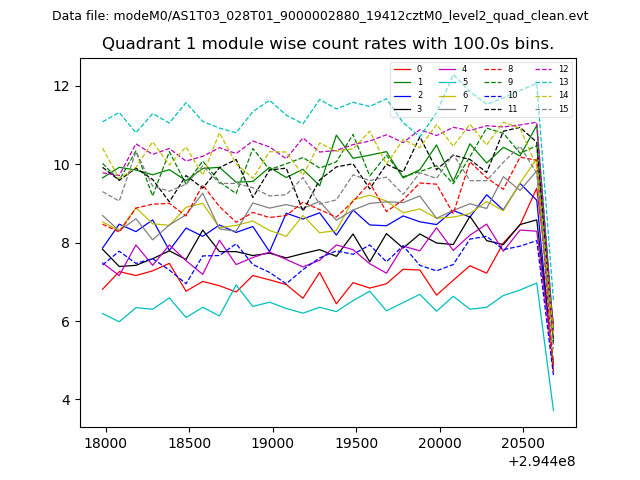 |
 |
| Module-wise count rates for Quadrant C Data is divided into 100 sec bins |
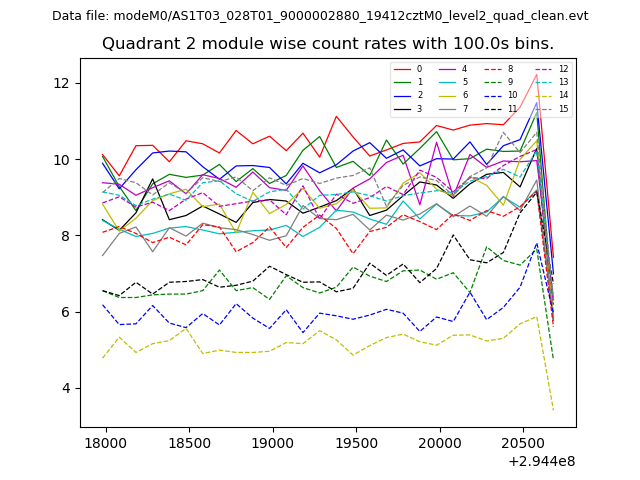 |
 |
| Module-wise count rates for Quadrant D Data is divided into 100 sec bins |
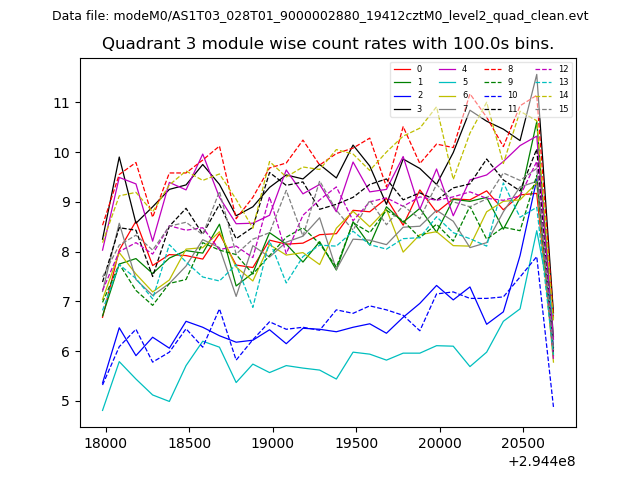 |
 |
| Parameter | Plot |
|---|---|
| CZT HV Monitor | 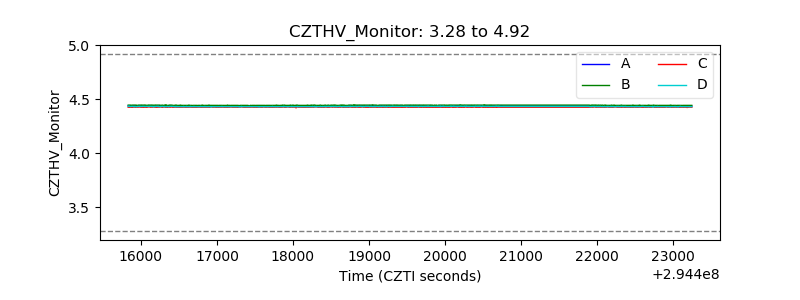 |
| D_VDD | 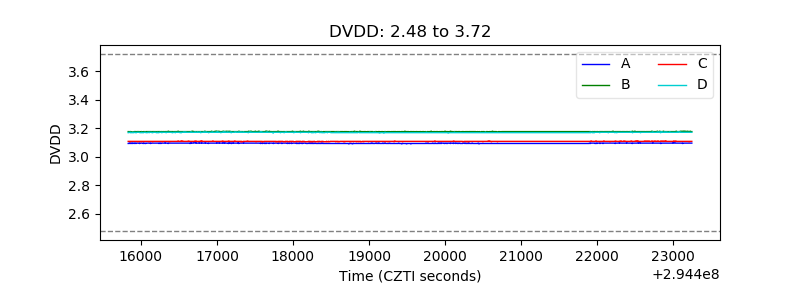 |
| Temperature 1 | 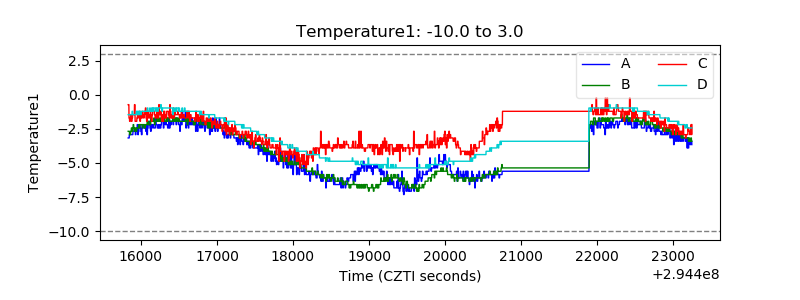 |
| Veto HV Monitor | 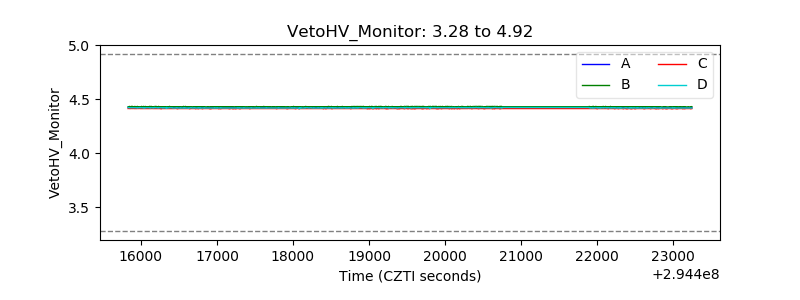 |
| Veto LLD |  |
| Alpha Counter | 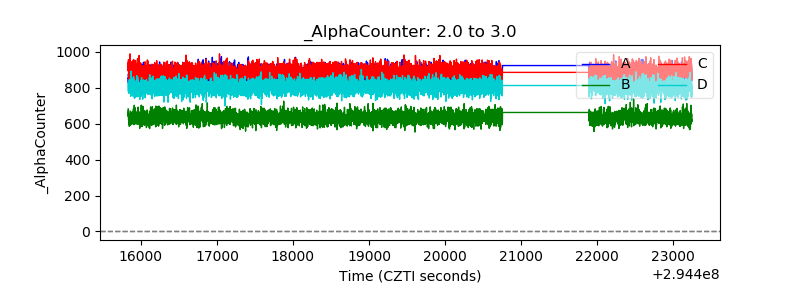 |
| _CPM_Rate | 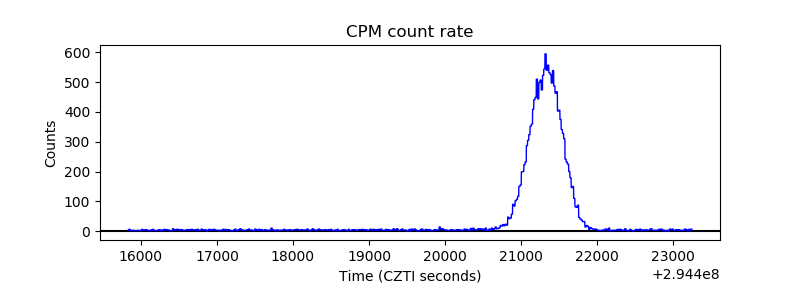 |
| CZT Counter | 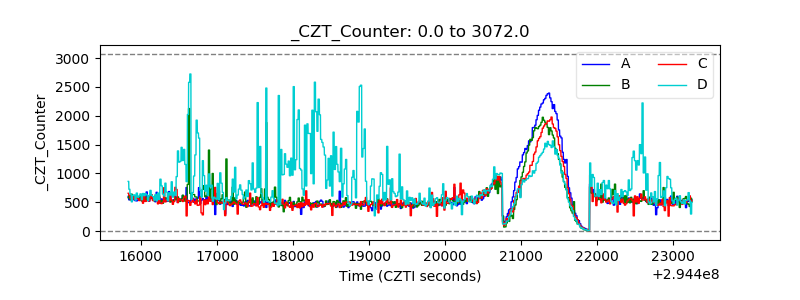 |
| +2.5 Volts monitor |  |
| +5 Volts monitor | 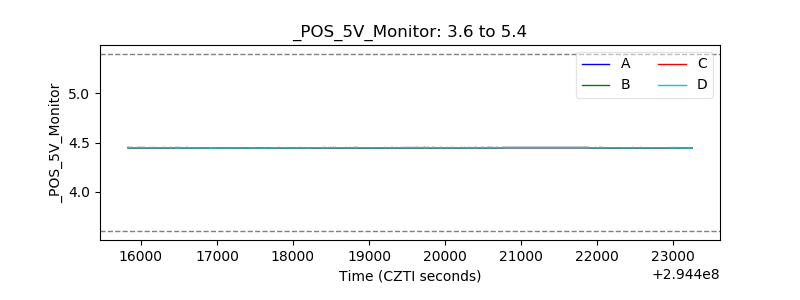 |
| _ROLL_ROT | 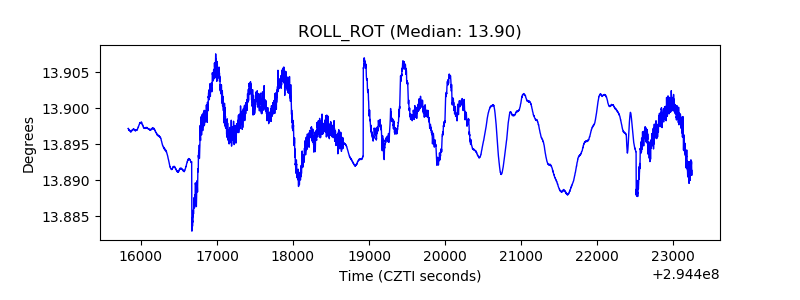 |
| _Roll_DEC | 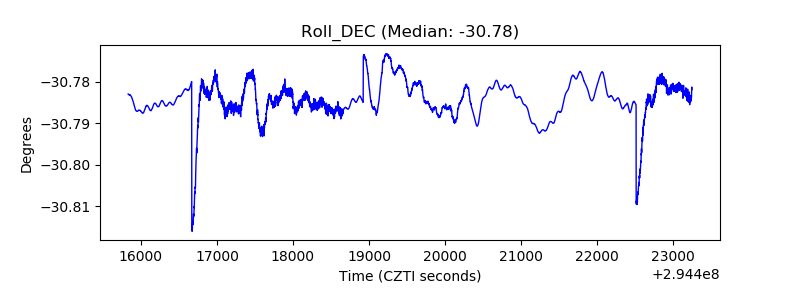 |
| _Roll_RA | 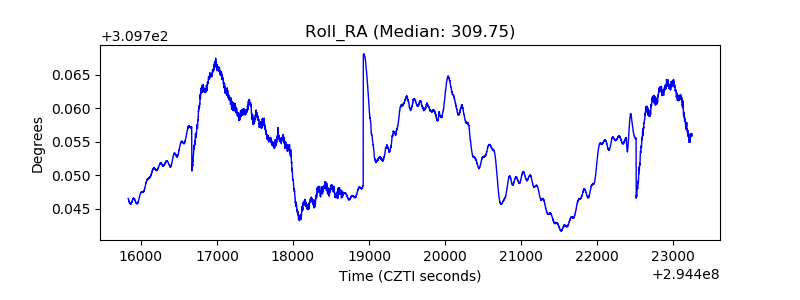 |
| Veto Counter | 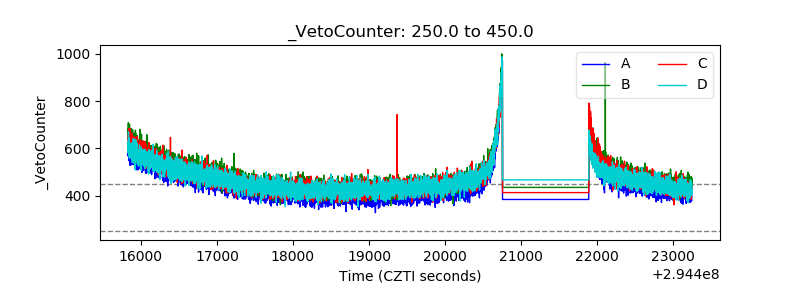 |