| Param | Original file | Final file |
|---|---|---|
| Filename | modeM0/AS1T03_028T01_9000002880_19413cztM0_level2.evt | modeM0/AS1T03_028T01_9000002880_19413cztM0_level2_quad_clean.evt |
| Size (bytes) | 243,097,920 | 27,668,160 |
| Size | 231.8 MB | 26.4 MB |
| Events in quadrant A | 1,442,482 | 162,618 |
| Events in quadrant B | 1,567,004 | 160,251 |
| Events in quadrant C | 1,469,186 | 151,061 |
| Events in quadrant D | 2,676,847 | 148,041 |
| Mode M0 | |||
|---|---|---|---|
| Quadrant | BADHDUFLAG | Total packets | Discarded packets |
| A | 0 | 6110 | 0 |
| B | 0 | 6412 | 0 |
| C | 0 | 6180 | 0 |
| D | 0 | 10038 | 0 |
| Mode SS | |||
|---|---|---|---|
| Quadrant | BADHDUFLAG | Total packets | Discarded packets |
| A | 0 | 60 | 0 |
| B | 0 | 60 | 0 |
| C | 0 | 60 | 0 |
| D | 0 | 60 | 0 |
| Quadrant | Total seconds | Saturated seconds | Saturation percentage |
|---|---|---|---|
| A | 3021 | 6 | 0.198610% |
| B | 3021 | 17 | 0.562728% |
| C | 3022 | 14 | 0.463269% |
| D | 3022 | 104 | 3.441430% |
Noise dominated data is calculated using 1-second bins in cleaned event files. If a bin has >2000 counts, and if more than 50% of those come from <1% of pixels, then it is considered to be noise-dominated and hence unusable.
| Quadrant | # 1 sec bins | Bins with >0 counts | Bins with >2000 counts | High rate bins dominated by noise | Noise dominated (total time) | Noise dominated (detector-on time) | Marked lightcurve |
|---|---|---|---|---|---|---|---|
| A | 3021 | 3021 | 0 | 0 | 0.00% | 0.00% | 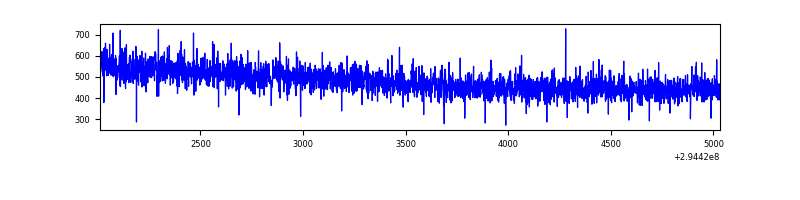 |
| B | 3021 | 3021 | 12 | 12 | 0.40% | 0.40% | 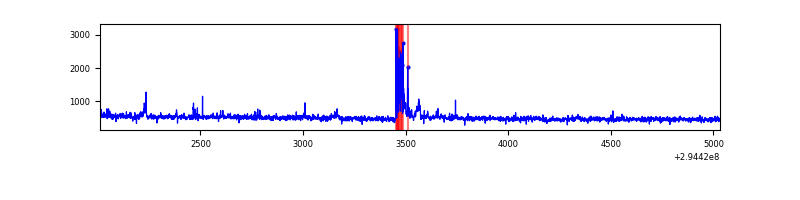 |
| C | 3022 | 3022 | 0 | 0 | 0.00% | 0.00% | 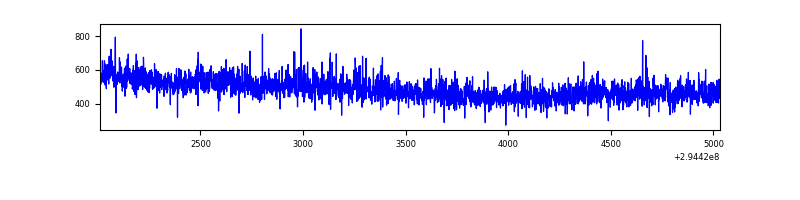 |
| D | 3022 | 3022 | 124 | 124 | 4.10% | 4.10% | 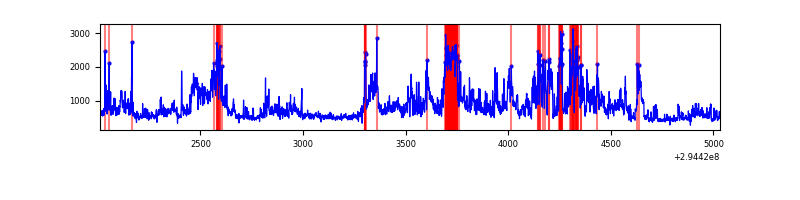 |
Top three noisy pixels from each quadrant. If the there are fewer than three noisy pixels in the level2.evt file, extra rows are filled as -1
| Pixel properties | Quadrant properties | ||||||
|---|---|---|---|---|---|---|---|
| Quadrant | DetID | PixID | Counts | Sigma | Mean | Median | Sigma |
| A | 13 | 254 | 5367 | 64.99 | 373 | 366 | 76.9 |
| A | 0 | 226 | 3263 | 37.65 | 373 | 366 | 76.9 |
| A | 11 | 29 | 3082 | 35.3 | 373 | 366 | 76.9 |
| B | 7 | 220 | 46008 | 635.17 | 370 | 362 | 71.9 |
| B | 4 | 174 | 34794 | 479.12 | 370 | 362 | 71.9 |
| B | 0 | 197 | 16836 | 229.24 | 370 | 362 | 71.9 |
| C | 14 | 238 | 56745 | 681.53 | 351 | 353 | 82.7 |
| C | 3 | 233 | 32366 | 386.9 | 351 | 353 | 82.7 |
| C | 7 | 220 | 5185 | 58.4 | 351 | 353 | 82.7 |
| D | 7 | 238 | 1299839 | 14734.43 | 356 | 346 | 88.2 |
| D | 2 | 234 | 13907 | 153.76 | 356 | 346 | 88.2 |
| D | 8 | 195 | 6419 | 68.86 | 356 | 346 | 88.2 |
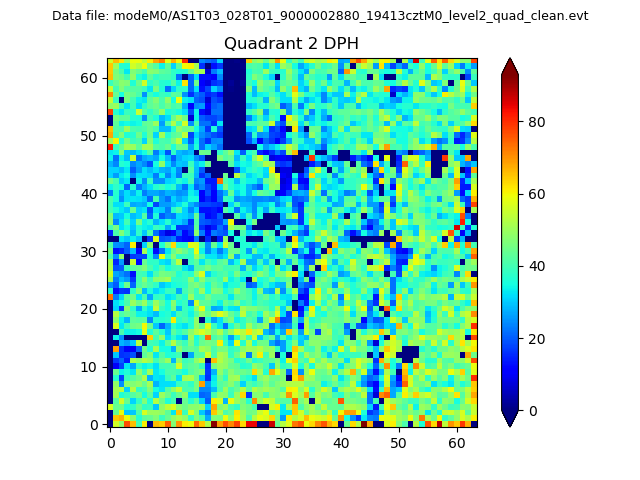
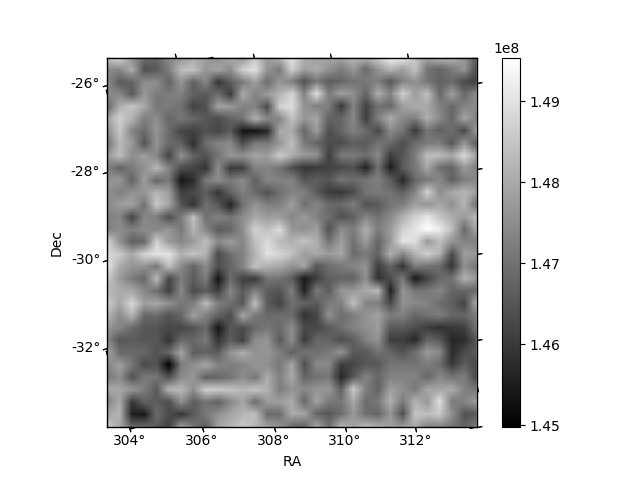
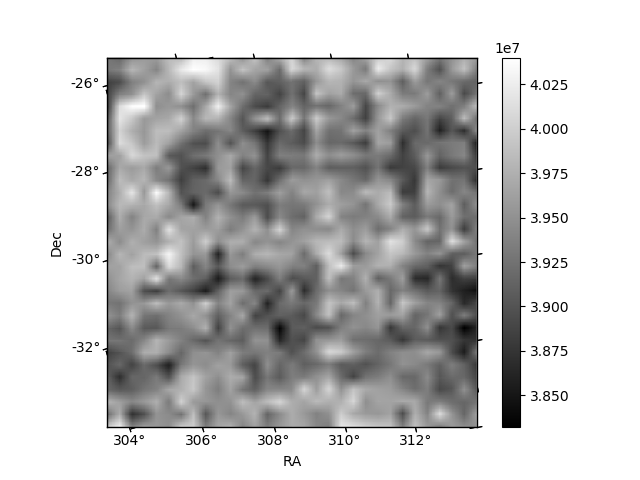
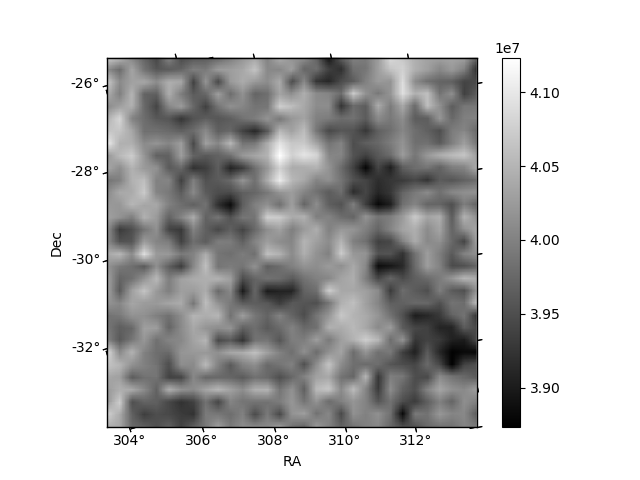
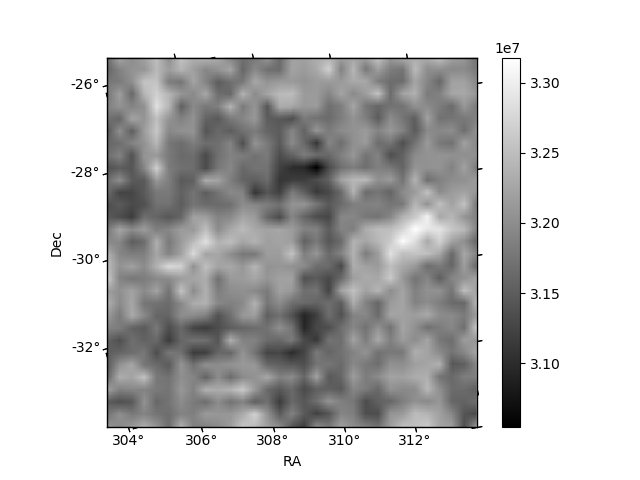
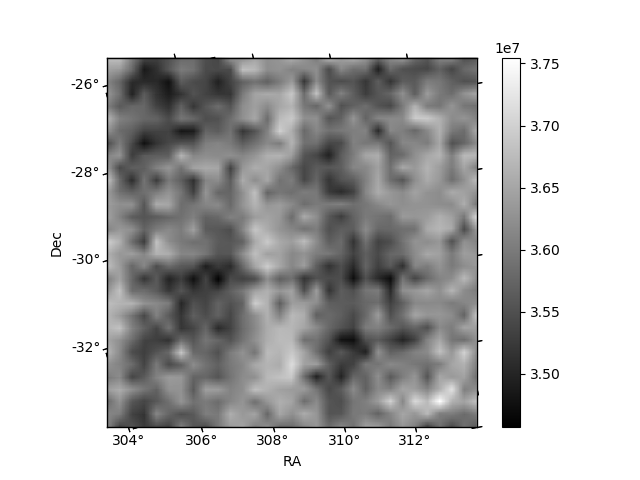
Histogram calculated using DETX and DETY for each event in the final _common_clean file
| Quadrant A | 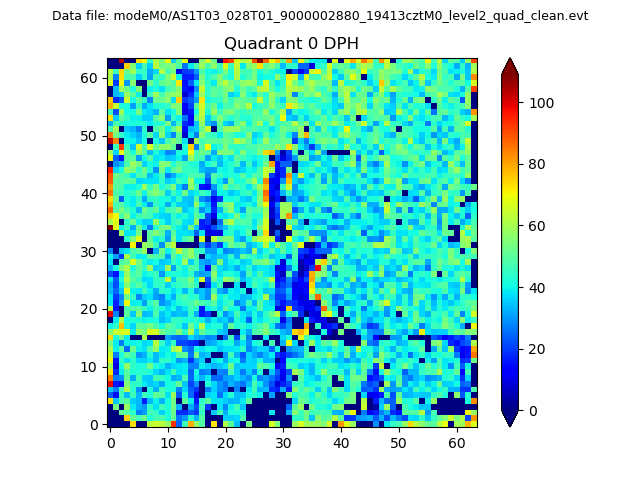 |
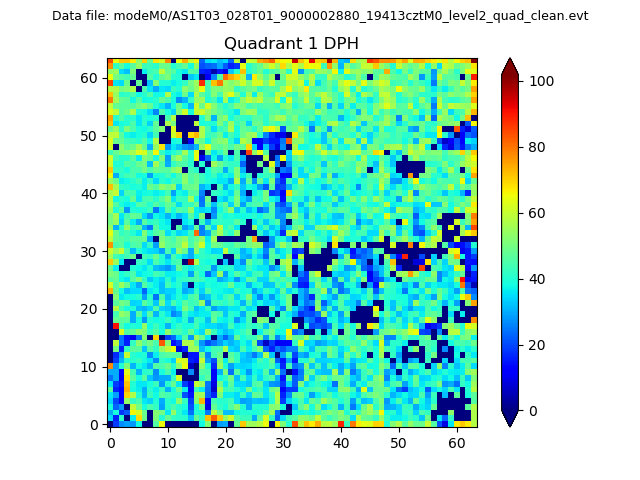 |
Quadrant B |
|---|---|---|---|
| Quadrant D | 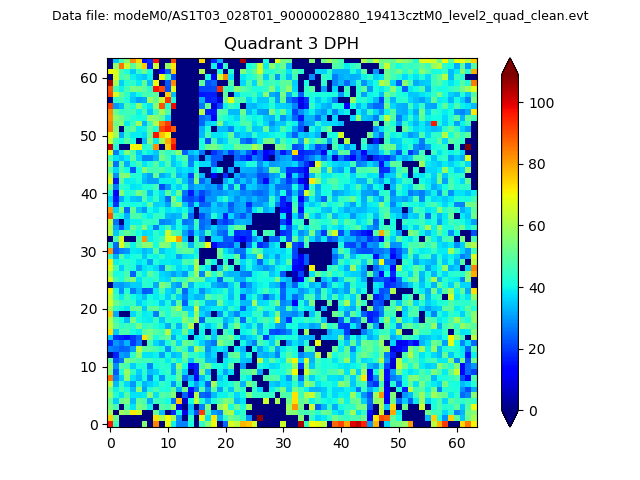 |
 |
Quadrant C |
| Plot type | Count rate plots | Images |
|---|---|---|
| Comparison with Poisson distribution Blue bars denote a histogram of data divided into 1 sec bins. Red curve is a Poisson curve with rate = median count rate of data. |
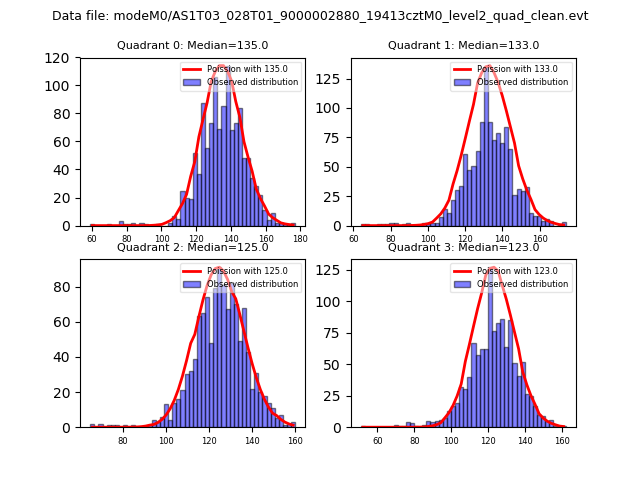 |
 |
| Quadrant-wise count rates Data is divided into 100 sec bins |
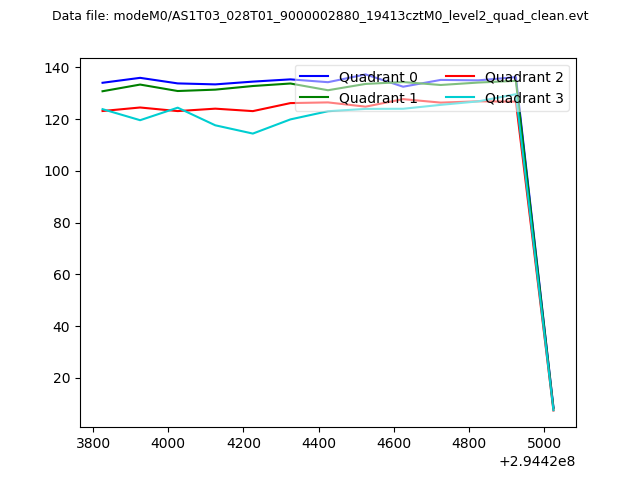 |
|
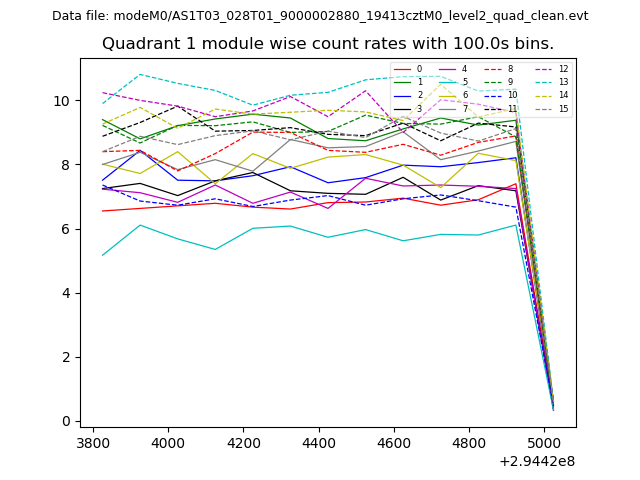
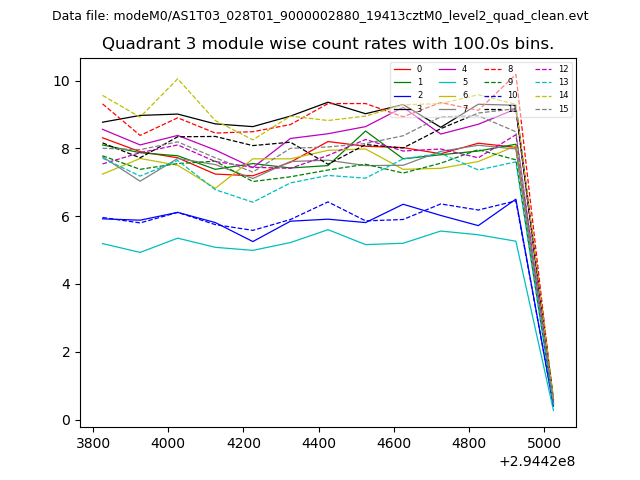
| Module-wise count rates for Quadrant A Data is divided into 100 sec bins |
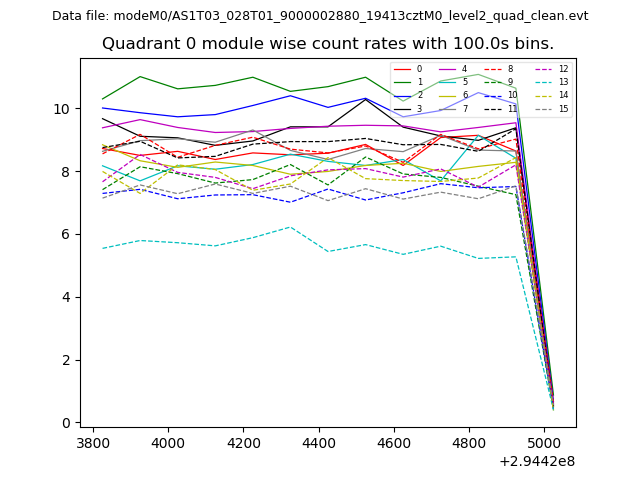 |
 |
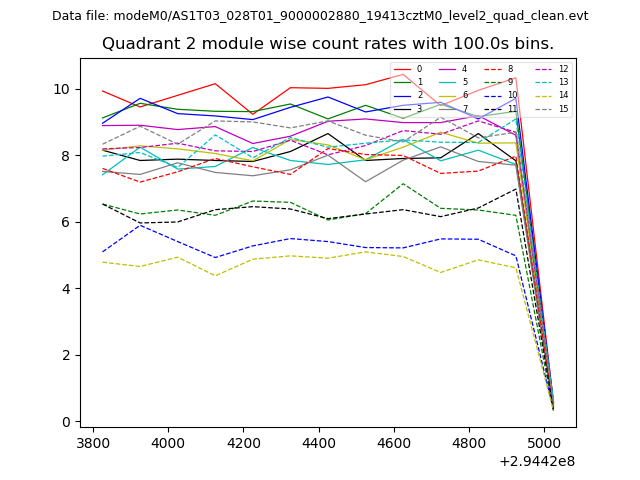
| Module-wise count rates for Quadrant B Data is divided into 100 sec bins |
 |
 |
| Module-wise count rates for Quadrant C Data is divided into 100 sec bins |
 |
 |
| Module-wise count rates for Quadrant D Data is divided into 100 sec bins |
 |
 |
| Parameter | Plot |
|---|---|
| CZT HV Monitor | 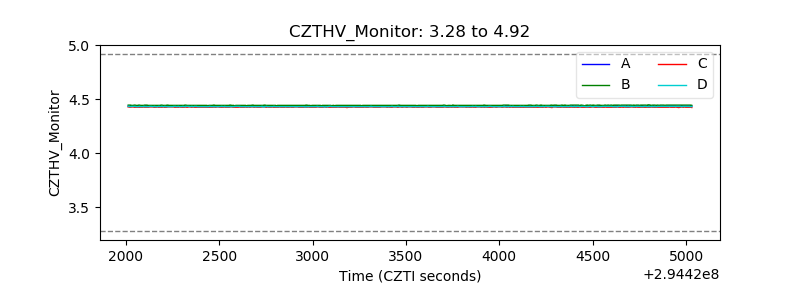 |
| D_VDD | 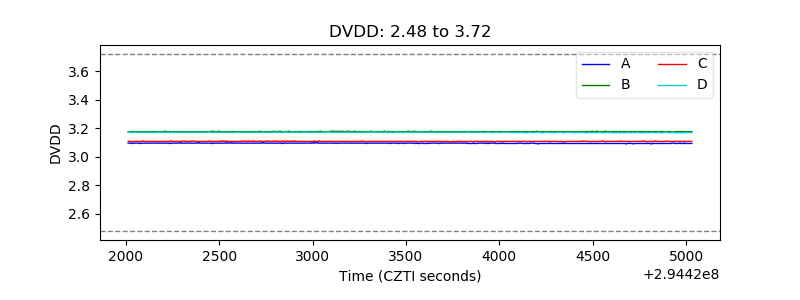 |
| Temperature 1 | 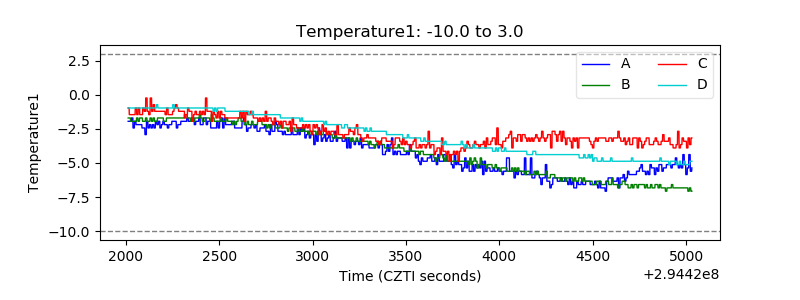 |
| Veto HV Monitor | 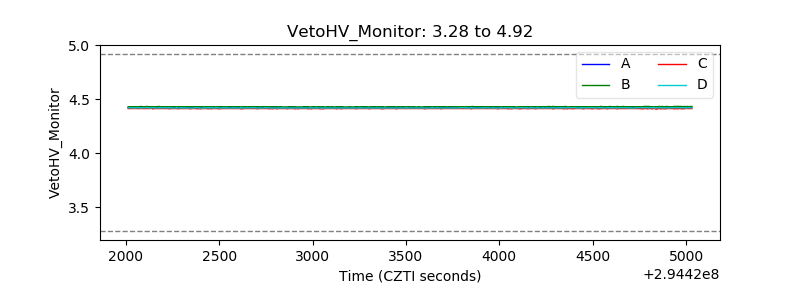 |
| Veto LLD | 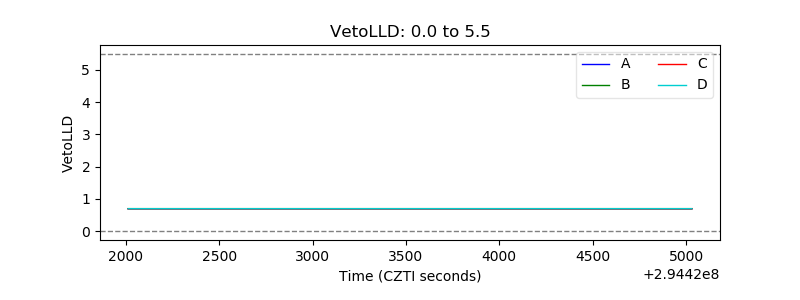 |
| Alpha Counter | 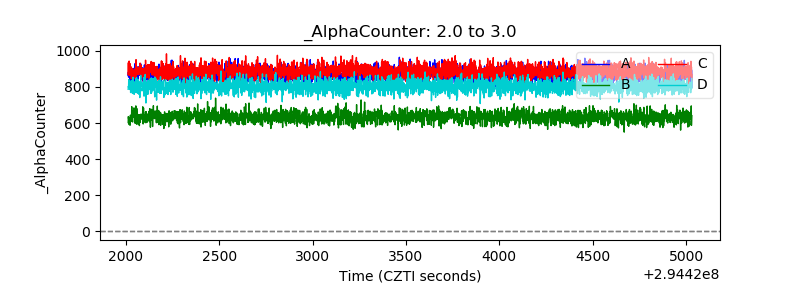 |
| _CPM_Rate | 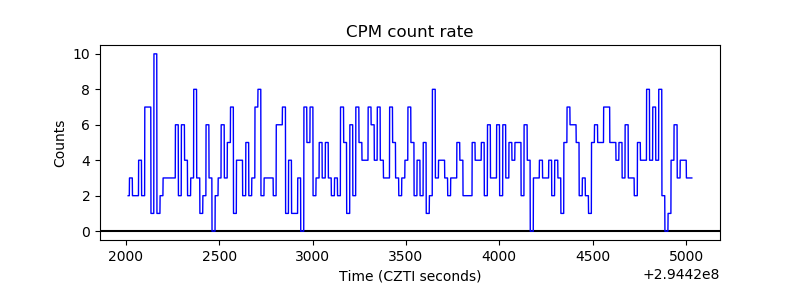 |
| CZT Counter | 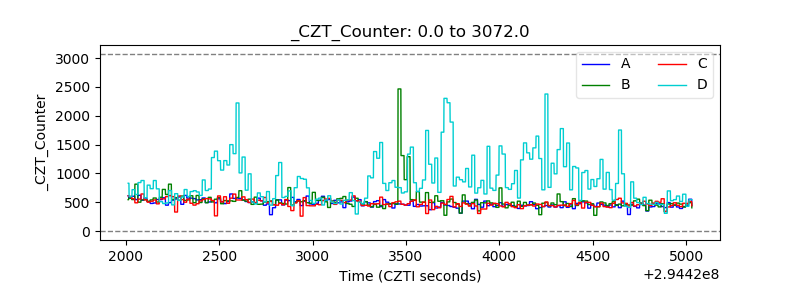 |
| +2.5 Volts monitor |  |
| +5 Volts monitor |  |
| _ROLL_ROT | 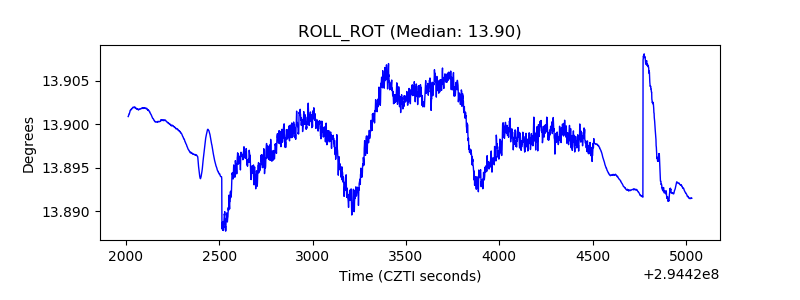 |
| _Roll_DEC | 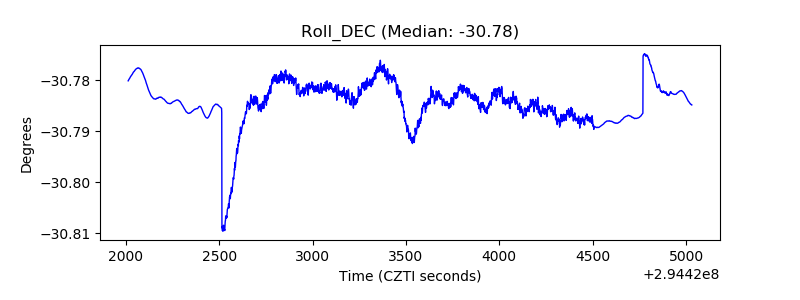 |
| _Roll_RA | 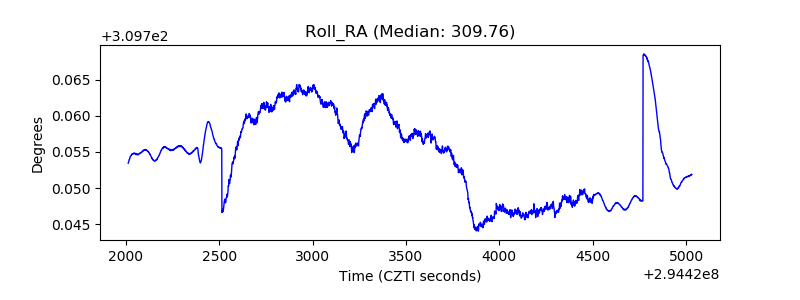 |
| Veto Counter | 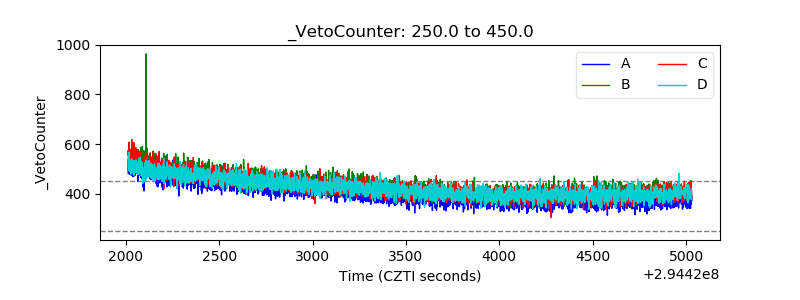 |