| Param | Original file | Final file |
|---|---|---|
| Filename | modeM0/AS1A05_212T09_9000002886cztM0_level2.fits | modeM0/AS1A05_212T09_9000002886cztM0_level2_quad_clean.evt |
| Size (bytes) | 156,202,560 | 67,086,720 |
| Size | 149.0 MB | 64.0 MB |
| Events in quadrant A | 1,002,922 | 277,761 |
| Events in quadrant B | 941,818 | 269,754 |
| Events in quadrant C | 943,948 | 250,049 |
| Events in quadrant D | 848,250 | 237,824 |
| Mode SS | |||
|---|---|---|---|
| Quadrant | BADHDUFLAG | Total packets | Discarded packets |
| A | 0 | 294 | 0 |
| B | 0 | 294 | 0 |
| C | 0 | 294 | 0 |
| D | 0 | 294 | 0 |
| Mode M0 | |||
|---|---|---|---|
| Quadrant | BADHDUFLAG | Total packets | Discarded packets |
| A | 0 | 31019 | 0 |
| B | 0 | 31486 | 0 |
| C | 0 | 30629 | 0 |
| D | 0 | 36067 | 0 |
| Mode M9 | |||
|---|---|---|---|
| Quadrant | BADHDUFLAG | Total packets | Discarded packets |
| A | 0 | 32 | 0 |
| B | 0 | 32 | 0 |
| C | 0 | 32 | 0 |
| D | 0 | 32 | 0 |
| Quadrant | Total seconds | Saturated seconds | Saturation percentage |
|---|---|---|---|
| A | 14394 | 140 | 0.972627% |
| B | 14394 | 182 | 1.264416% |
| C | 14394 | 194 | 1.347784% |
| D | 14394 | 337 | 2.341253% |
Noise dominated data is calculated using 1-second bins in cleaned event files. If a bin has >2000 counts, and if more than 50% of those come from <1% of pixels, then it is considered to be noise-dominated and hence unusable.
| Quadrant | # 1 sec bins | Bins with >0 counts | Bins with >2000 counts | High rate bins dominated by noise | Noise dominated (total time) | Noise dominated (detector-on time) | Marked lightcurve |
|---|---|---|---|---|---|---|---|
| A | 16913 | 14391 | 0 | 0 | 0.00% | 0.00% |  |
| B | 16913 | 14391 | 0 | 0 | 0.00% | 0.00% |  |
| C | 16913 | 14391 | 0 | 0 | 0.00% | 0.00% | 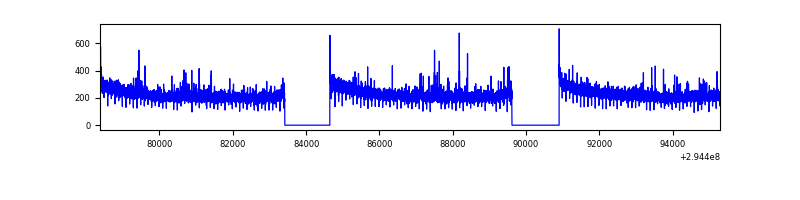 |
| D | 16913 | 14391 | 0 | 0 | 0.00% | 0.00% |  |
Top three noisy pixels from each quadrant. If the there are fewer than three noisy pixels in the level2.evt file, extra rows are filled as -1
| Pixel properties | Quadrant properties | ||||||
|---|---|---|---|---|---|---|---|
| Quadrant | DetID | PixID | Counts | Sigma | Mean | Median | Sigma |
| A | 0 | 29 | 965 | 11.26 | 261 | 248 | 63.7 |
| A | 9 | 19 | 790 | 8.51 | 261 | 248 | 63.7 |
| A | 7 | 110 | 762 | 8.07 | 261 | 248 | 63.7 |
| B | 2 | 9 | 756 | 10.43 | 249 | 240 | 49.5 |
| B | 3 | 17 | 654 | 8.37 | 249 | 240 | 49.5 |
| B | 5 | 128 | 616 | 7.6 | 249 | 240 | 49.5 |
| C | 1 | 80 | 723 | 7.62 | 249 | 235 | 64.0 |
| C | 1 | 81 | 693 | 7.15 | 249 | 235 | 64.0 |
| C | 3 | 158 | 670 | 6.79 | 249 | 235 | 64.0 |
| D | 7 | 3 | 596 | 5.77 | 242 | 223 | 64.7 |
| D | 6 | 67 | 591 | 5.69 | 242 | 223 | 64.7 |
| D | 1 | 19 | 591 | 5.69 | 242 | 223 | 64.7 |
Histogram calculated using DETX and DETY for each event in the final _common_clean file
| Quadrant A |  |
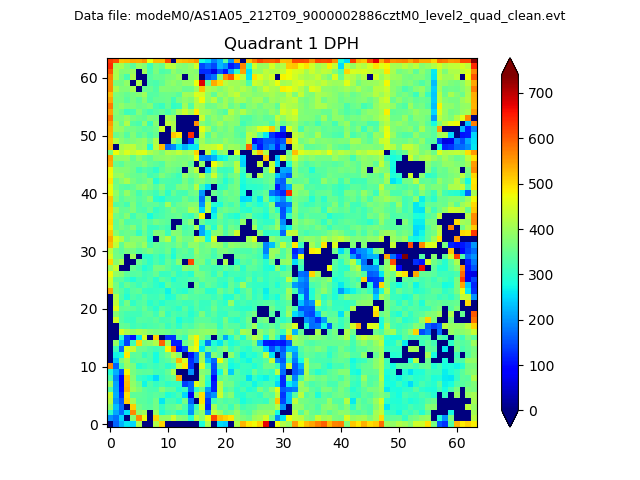 |
Quadrant B |
|---|---|---|---|
| Quadrant D |  |
 |
Quadrant C |
| Plot type | Count rate plots | Images |
|---|---|---|
| Comparison with Poisson distribution Blue bars denote a histogram of data divided into 1 sec bins. Red curve is a Poisson curve with rate = median count rate of data. |
 |
 |
| Quadrant-wise count rates Data is divided into 100 sec bins |
 |
|
| Module-wise count rates for Quadrant A Data is divided into 100 sec bins |
 |
 |
| Module-wise count rates for Quadrant B Data is divided into 100 sec bins |
 |
 |
| Module-wise count rates for Quadrant C Data is divided into 100 sec bins |
 |
 |
| Module-wise count rates for Quadrant D Data is divided into 100 sec bins |
 |
 |
| Parameter | Plot |
|---|---|
| CZT HV Monitor |  |
| D_VDD | 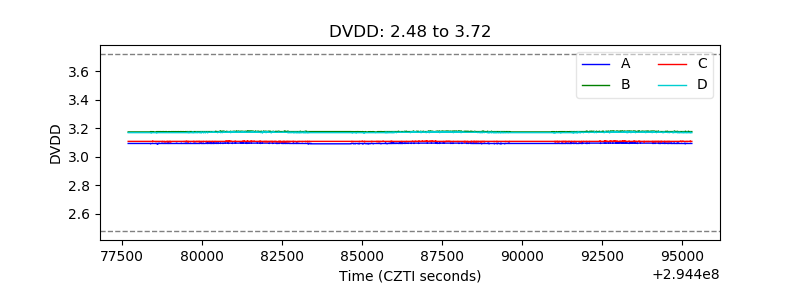 |
| Temperature 1 |  |
| Veto HV Monitor |  |
| Veto LLD |  |
| Alpha Counter |  |
| _CPM_Rate |  |
| CZT Counter |  |
| +2.5 Volts monitor |  |
| +5 Volts monitor |  |
| _ROLL_ROT |  |
| _Roll_DEC |  |
| _Roll_RA |  |
| Veto Counter |  |