| Param | Original file | Final file |
|---|---|---|
| Filename | modeM0/AS1A05_212T09_9000002886_19422cztM0_level2.evt | modeM0/AS1A05_212T09_9000002886_19422cztM0_level2_quad_clean.evt |
| Size (bytes) | 135,852,480 | 39,640,320 |
| Size | 129.6 MB | 37.8 MB |
| Events in quadrant A | 919,441 | 274,489 |
| Events in quadrant B | 928,720 | 275,626 |
| Events in quadrant C | 950,448 | 263,581 |
| Events in quadrant D | 1,196,933 | 260,828 |
| Mode SS | |||
|---|---|---|---|
| Quadrant | BADHDUFLAG | Total packets | Discarded packets |
| A | 0 | 34 | 0 |
| B | 0 | 34 | 0 |
| C | 0 | 34 | 0 |
| D | 0 | 34 | 0 |
| Mode M0 | |||
|---|---|---|---|
| Quadrant | BADHDUFLAG | Total packets | Discarded packets |
| A | 0 | 3762 | 1 |
| B | 0 | 3811 | 1 |
| C | 0 | 3883 | 1 |
| D | 0 | 4690 | 1 |
| Mode M9 | |||
|---|---|---|---|
| Quadrant | BADHDUFLAG | Total packets | Discarded packets |
| A | 0 | 7 | 0 |
| B | 0 | 7 | 0 |
| C | 0 | 7 | 0 |
| D | 0 | 7 | 0 |
| Quadrant | Total seconds | Saturated seconds | Saturation percentage |
|---|---|---|---|
| A | 1711 | 10 | 0.584454% |
| B | 1711 | 16 | 0.935126% |
| C | 1711 | 23 | 1.344243% |
| D | 1711 | 33 | 1.928697% |
Noise dominated data is calculated using 1-second bins in cleaned event files. If a bin has >2000 counts, and if more than 50% of those come from <1% of pixels, then it is considered to be noise-dominated and hence unusable.
| Quadrant | # 1 sec bins | Bins with >0 counts | Bins with >2000 counts | High rate bins dominated by noise | Noise dominated (total time) | Noise dominated (detector-on time) | Marked lightcurve |
|---|---|---|---|---|---|---|---|
| A | 1711 | 1711 | 0 | 0 | 0.00% | 0.00% | 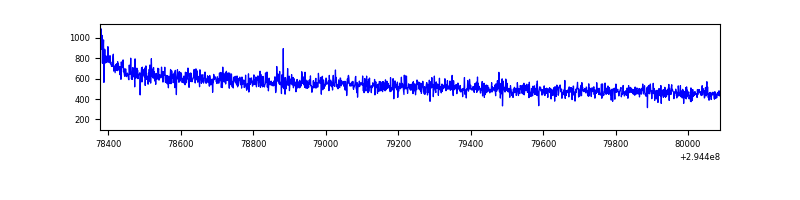 |
| B | 1711 | 1711 | 0 | 0 | 0.00% | 0.00% | 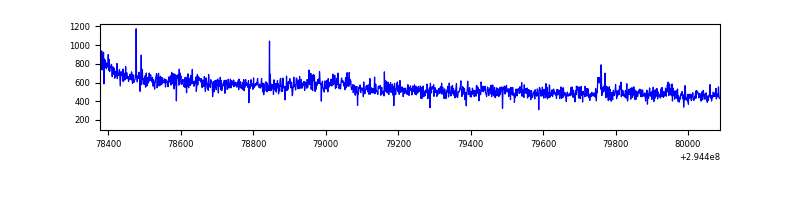 |
| C | 1711 | 1711 | 0 | 0 | 0.00% | 0.00% | 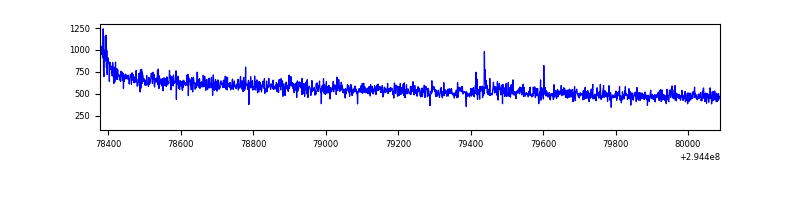 |
| D | 1711 | 1711 | 11 | 11 | 0.64% | 0.64% | 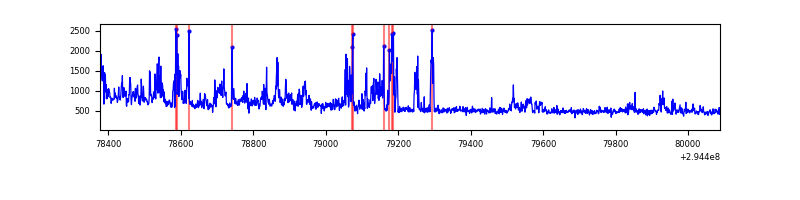 |
Top three noisy pixels from each quadrant. If the there are fewer than three noisy pixels in the level2.evt file, extra rows are filled as -1
| Pixel properties | Quadrant properties | ||||||
|---|---|---|---|---|---|---|---|
| Quadrant | DetID | PixID | Counts | Sigma | Mean | Median | Sigma |
| A | 13 | 254 | 2341 | 42.73 | 238 | 233 | 49.3 |
| A | 0 | 226 | 2119 | 38.23 | 238 | 233 | 49.3 |
| A | 12 | 194 | 1719 | 30.12 | 238 | 233 | 49.3 |
| B | 0 | 198 | 20130 | 444.21 | 232 | 226 | 44.8 |
| B | 12 | 111 | 4923 | 104.83 | 232 | 226 | 44.8 |
| B | 11 | 111 | 4436 | 93.96 | 232 | 226 | 44.8 |
| C | 14 | 238 | 36108 | 666.52 | 229 | 230 | 53.8 |
| C | 3 | 233 | 20580 | 378.05 | 229 | 230 | 53.8 |
| C | 13 | 61 | 1551 | 24.54 | 229 | 230 | 53.8 |
| D | 1 | 52 | 216498 | 3766.35 | 235 | 228 | 57.4 |
| D | 7 | 238 | 86895 | 1509.31 | 235 | 228 | 57.4 |
| D | 2 | 234 | 5606 | 93.66 | 235 | 228 | 57.4 |
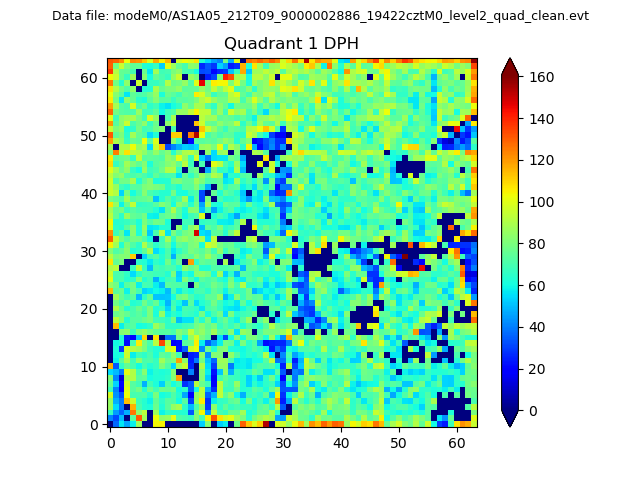
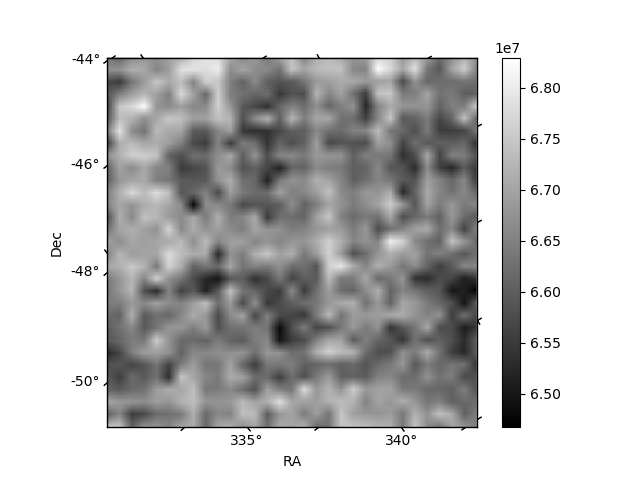
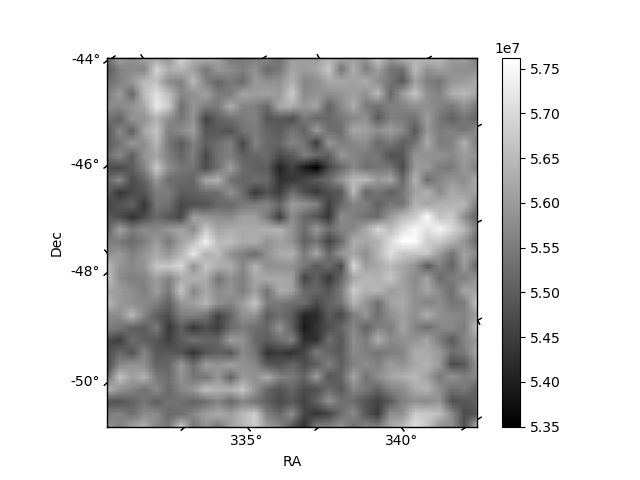
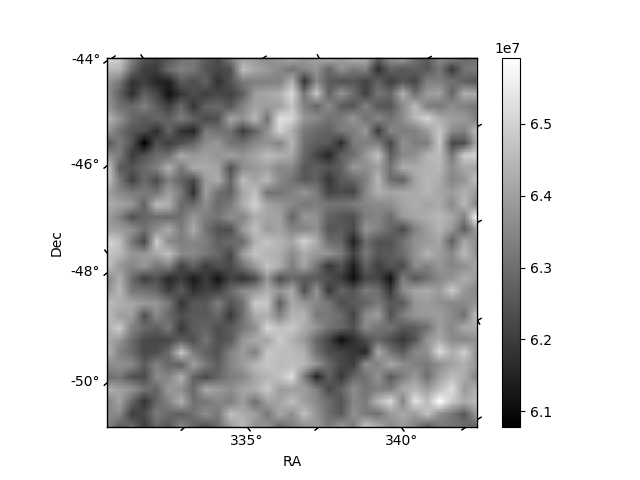
Histogram calculated using DETX and DETY for each event in the final _common_clean file
| Quadrant A |  |
 |
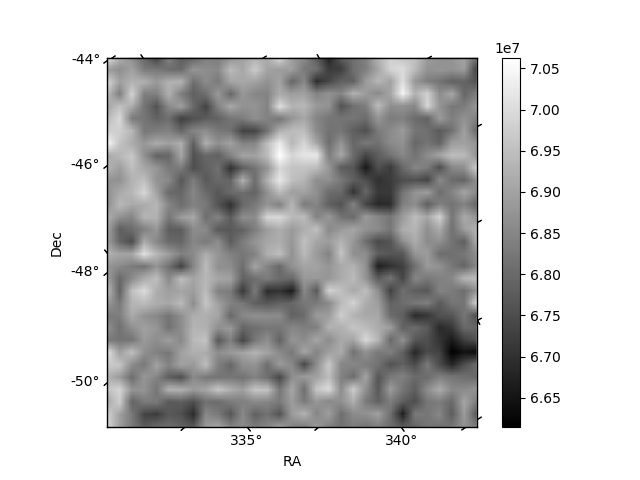
Quadrant B |
|---|---|---|---|
| Quadrant D | 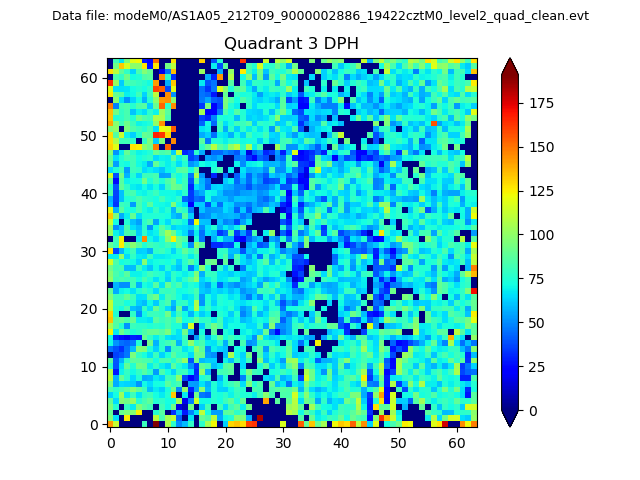 |
 |
Quadrant C |
| Plot type | Count rate plots | Images |
|---|---|---|
| Comparison with Poisson distribution Blue bars denote a histogram of data divided into 1 sec bins. Red curve is a Poisson curve with rate = median count rate of data. |
 |
 |
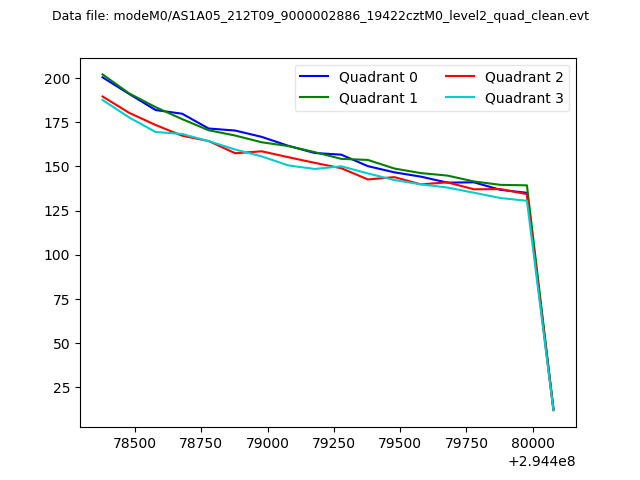
| Quadrant-wise count rates Data is divided into 100 sec bins |
 |
|
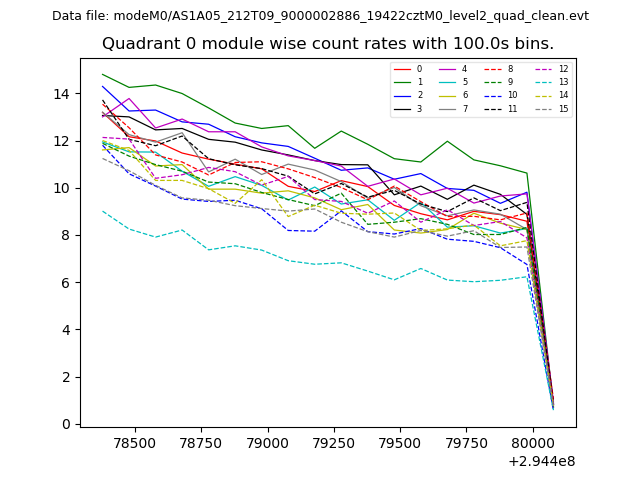
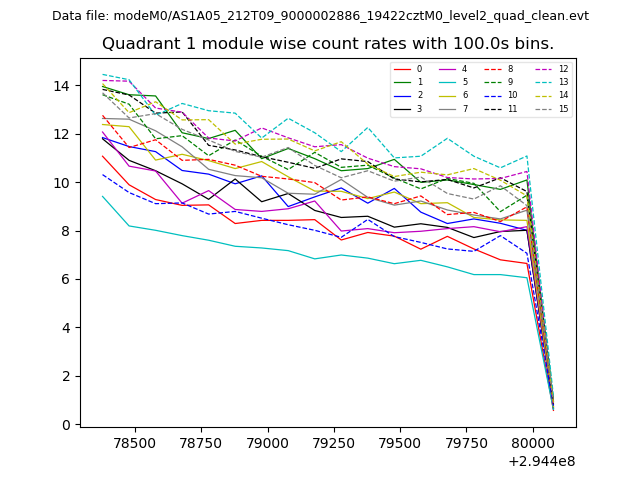
| Module-wise count rates for Quadrant A Data is divided into 100 sec bins |
 |
 |
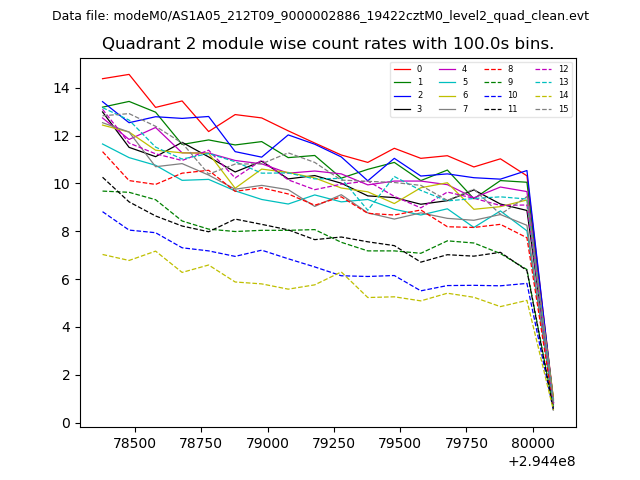
| Module-wise count rates for Quadrant B Data is divided into 100 sec bins |
 |
 |
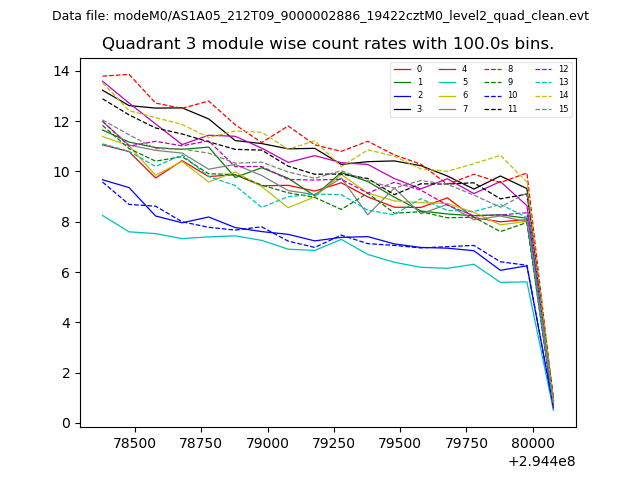
| Module-wise count rates for Quadrant C Data is divided into 100 sec bins |
 |
 |
| Module-wise count rates for Quadrant D Data is divided into 100 sec bins |
 |
 |
| Parameter | Plot |
|---|---|
| CZT HV Monitor | 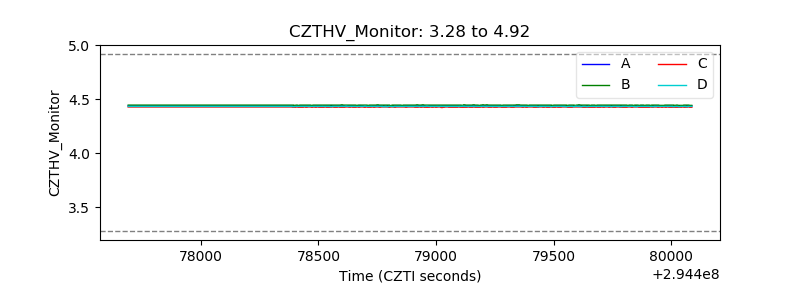 |
| D_VDD | 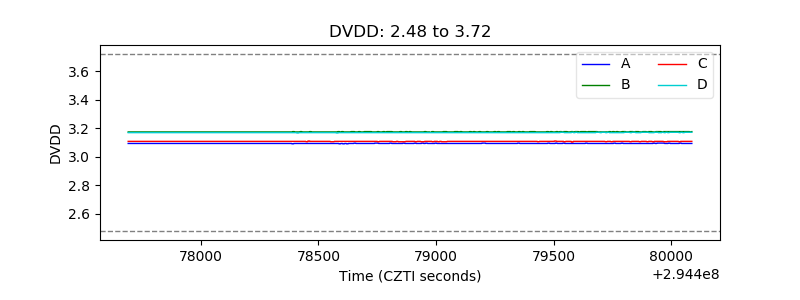 |
| Temperature 1 | 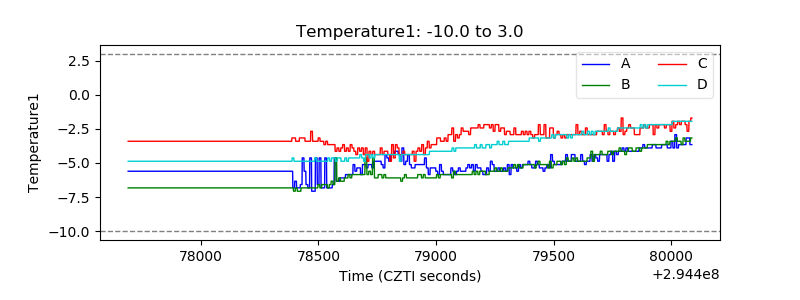 |
| Veto HV Monitor | 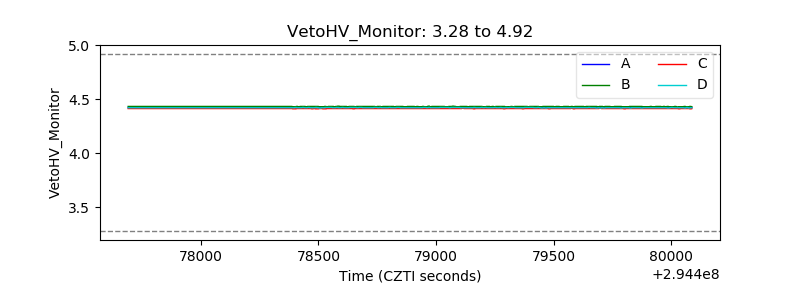 |
| Veto LLD | 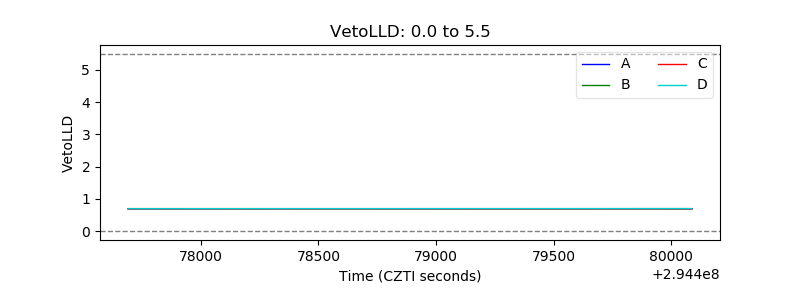 |
| Alpha Counter | 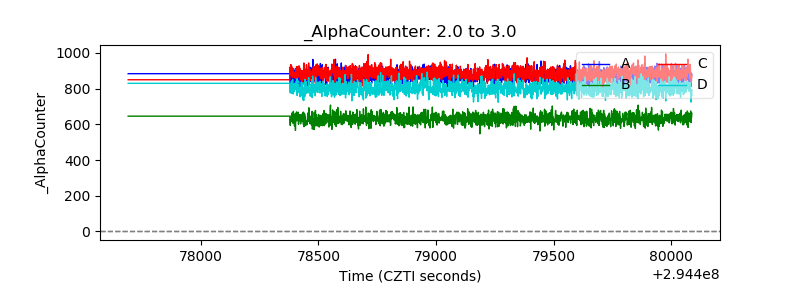 |
| _CPM_Rate | 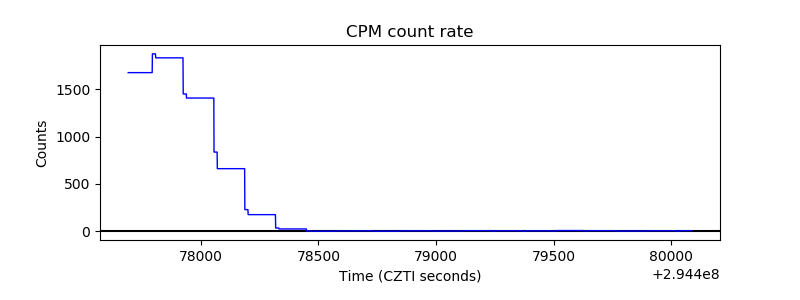 |
| CZT Counter |  |
| +2.5 Volts monitor |  |
| +5 Volts monitor |  |
| _ROLL_ROT |  |
| _Roll_DEC | 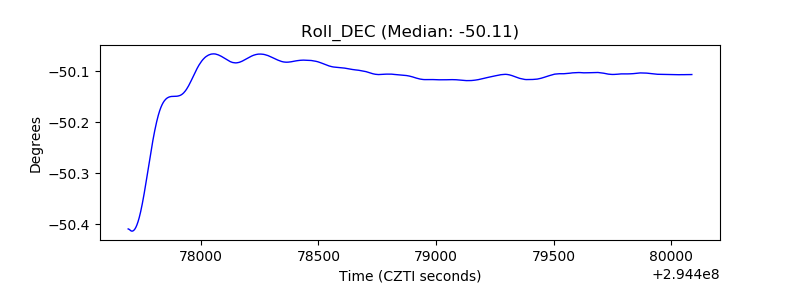 |
| _Roll_RA |  |
| Veto Counter | 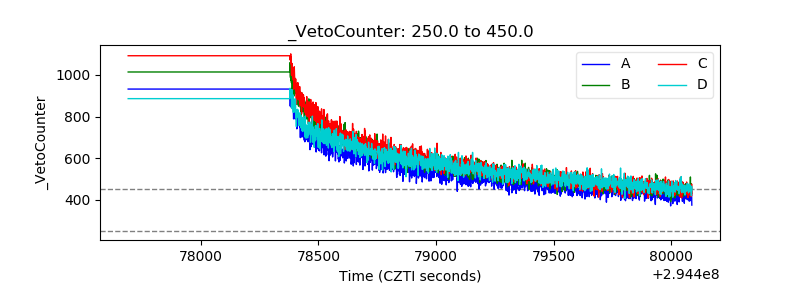 |