| Param | Original file | Final file |
|---|---|---|
| Filename | modeM0/AS1A05_212T09_9000002886_19423cztM0_level2.evt | modeM0/AS1A05_212T09_9000002886_19423cztM0_level2_quad_clean.evt |
| Size (bytes) | 460,776,960 | 96,134,400 |
| Size | 439.4 MB | 91.7 MB |
| Events in quadrant A | 3,240,710 | 633,748 |
| Events in quadrant B | 3,281,822 | 638,215 |
| Events in quadrant C | 3,130,702 | 606,970 |
| Events in quadrant D | 3,885,929 | 605,321 |
| Mode SS | |||
|---|---|---|---|
| Quadrant | BADHDUFLAG | Total packets | Discarded packets |
| A | 0 | 124 | 0 |
| B | 0 | 124 | 0 |
| C | 0 | 124 | 0 |
| D | 0 | 124 | 0 |
| Mode M0 | |||
|---|---|---|---|
| Quadrant | BADHDUFLAG | Total packets | Discarded packets |
| A | 0 | 13358 | 1 |
| B | 0 | 13421 | 2 |
| C | 0 | 12960 | 1 |
| D | 0 | 15421 | 1 |
| Mode M9 | |||
|---|---|---|---|
| Quadrant | BADHDUFLAG | Total packets | Discarded packets |
| A | 0 | 12 | 0 |
| B | 0 | 12 | 0 |
| C | 0 | 12 | 0 |
| D | 0 | 12 | 0 |
| Quadrant | Total seconds | Saturated seconds | Saturation percentage |
|---|---|---|---|
| A | 6122 | 59 | 0.963737% |
| B | 6122 | 71 | 1.159752% |
| C | 6122 | 74 | 1.208755% |
| D | 6122 | 106 | 1.731460% |
Noise dominated data is calculated using 1-second bins in cleaned event files. If a bin has >2000 counts, and if more than 50% of those come from <1% of pixels, then it is considered to be noise-dominated and hence unusable.
| Quadrant | # 1 sec bins | Bins with >0 counts | Bins with >2000 counts | High rate bins dominated by noise | Noise dominated (total time) | Noise dominated (detector-on time) | Marked lightcurve |
|---|---|---|---|---|---|---|---|
| A | 7352 | 6122 | 9 | 9 | 0.12% | 0.15% | 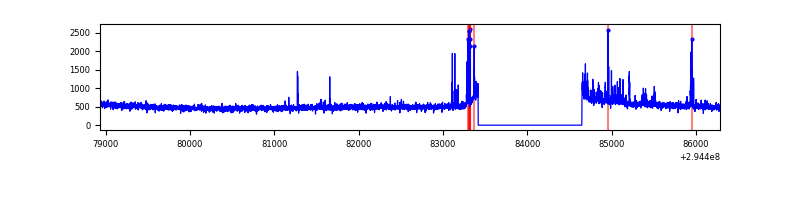 |
| B | 7352 | 6122 | 20 | 20 | 0.27% | 0.33% | 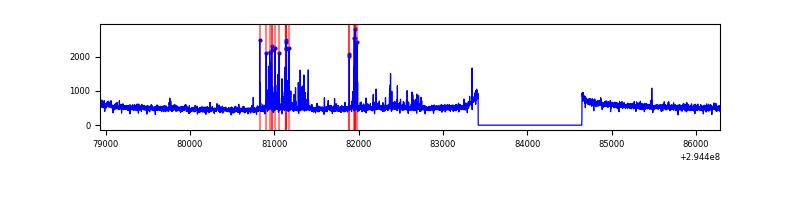 |
| C | 7352 | 6122 | 0 | 0 | 0.00% | 0.00% | 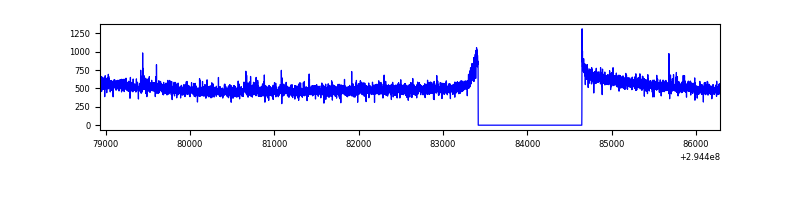 |
| D | 7352 | 6122 | 52 | 52 | 0.71% | 0.85% | 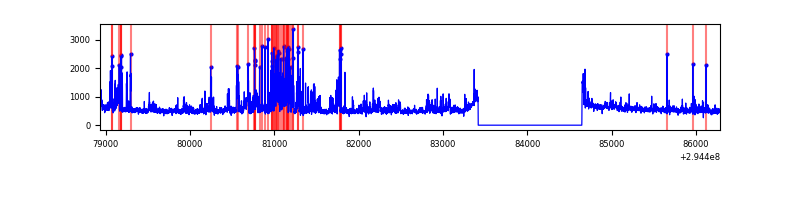 |
Top three noisy pixels from each quadrant. If the there are fewer than three noisy pixels in the level2.evt file, extra rows are filled as -1
| Pixel properties | Quadrant properties | ||||||
|---|---|---|---|---|---|---|---|
| Quadrant | DetID | PixID | Counts | Sigma | Mean | Median | Sigma |
| A | 5 | 16 | 136175 | 837.54 | 803 | 788 | 161.6 |
| A | 13 | 254 | 9334 | 52.87 | 803 | 788 | 161.6 |
| A | 12 | 96 | 8204 | 45.88 | 803 | 788 | 161.6 |
| B | 7 | 220 | 146731 | 997.72 | 783 | 765 | 146.3 |
| B | 0 | 198 | 30291 | 201.82 | 783 | 765 | 146.3 |
| B | 0 | 197 | 24560 | 162.64 | 783 | 765 | 146.3 |
| C | 14 | 238 | 119408 | 681.29 | 758 | 763 | 174.1 |
| C | 3 | 233 | 52627 | 297.82 | 758 | 763 | 174.1 |
| C | 13 | 61 | 5301 | 26.06 | 758 | 763 | 174.1 |
| D | 1 | 52 | 766739 | 4071.19 | 784 | 764 | 188.1 |
| D | 7 | 238 | 115854 | 611.71 | 784 | 764 | 188.1 |
| D | 8 | 195 | 22738 | 116.79 | 784 | 764 | 188.1 |
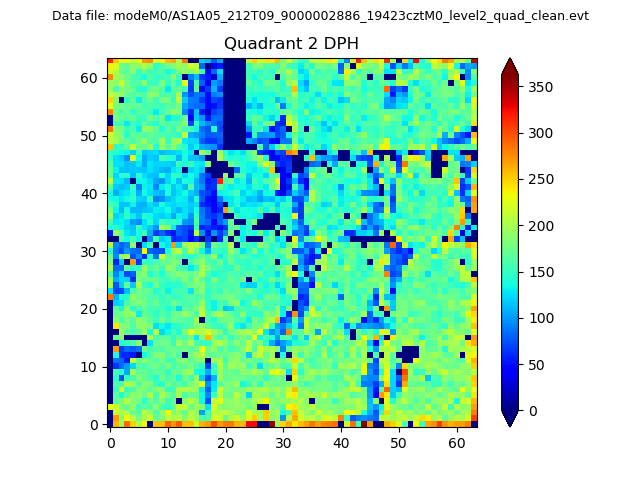
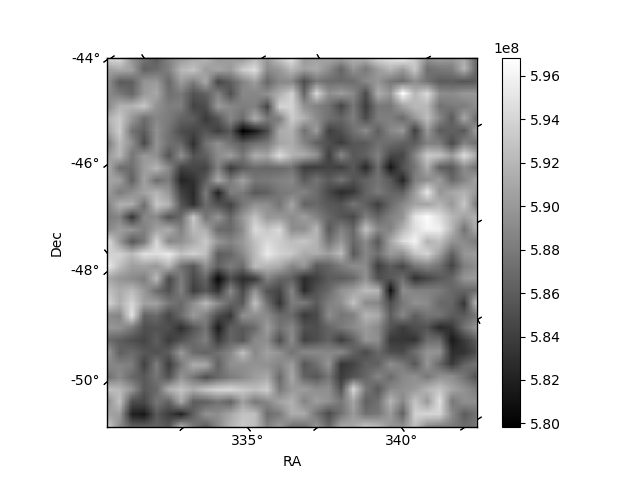
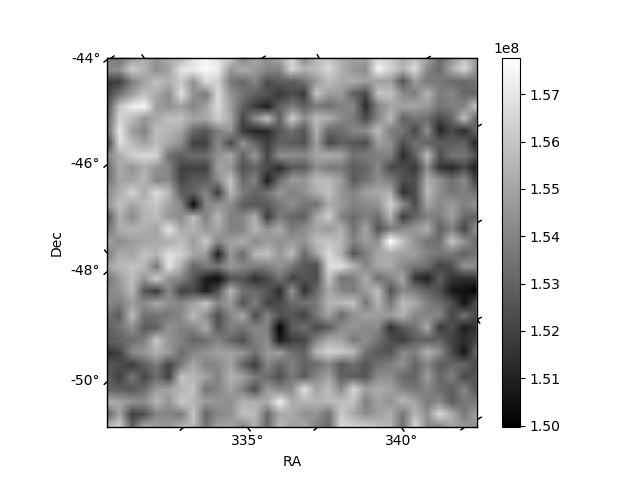
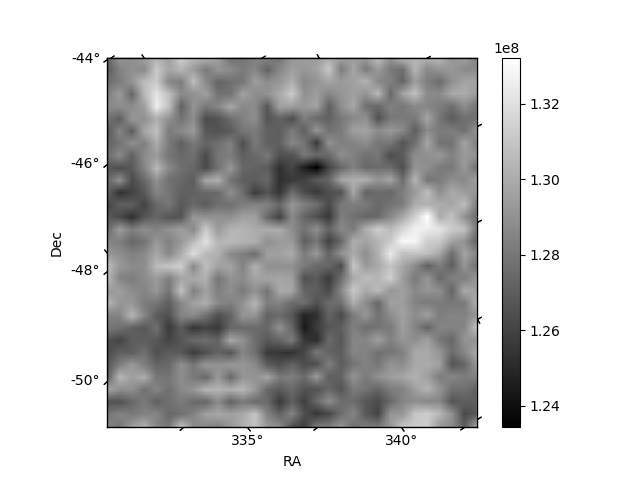
Histogram calculated using DETX and DETY for each event in the final _common_clean file
| Quadrant A | 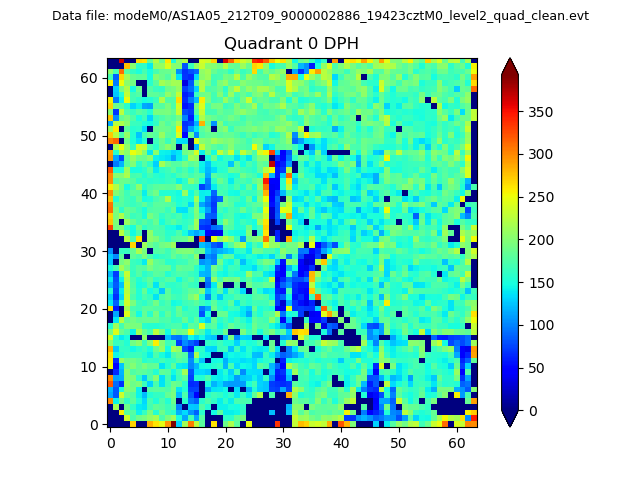 |
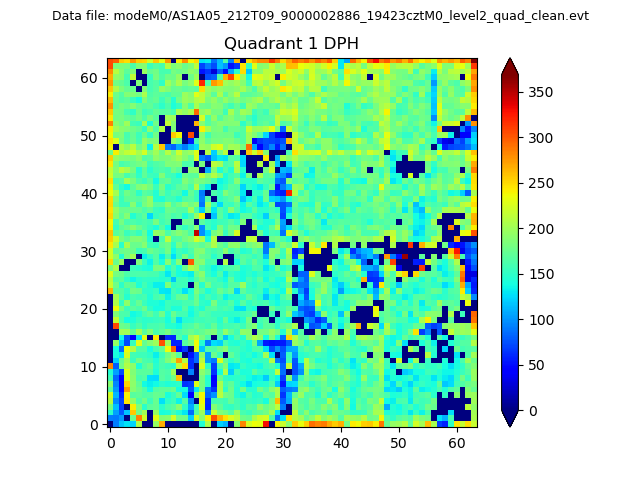 |
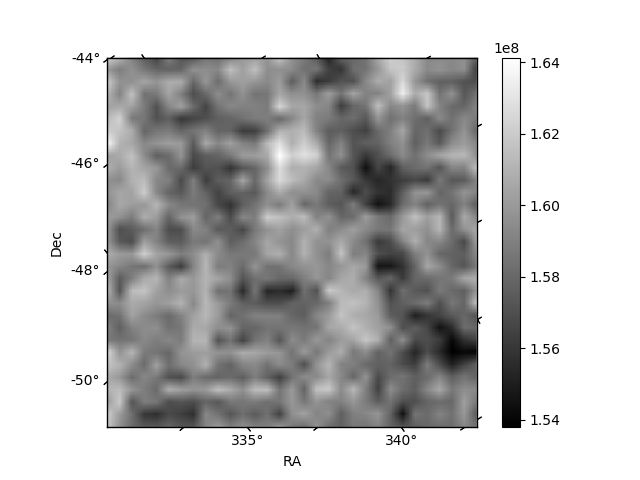
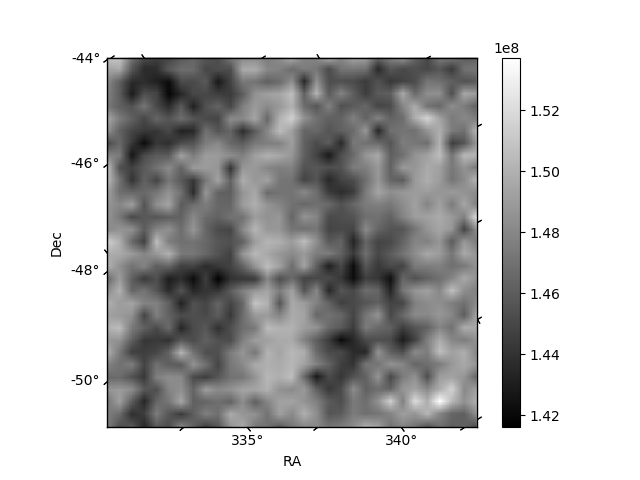
Quadrant B |
|---|---|---|---|
| Quadrant D | 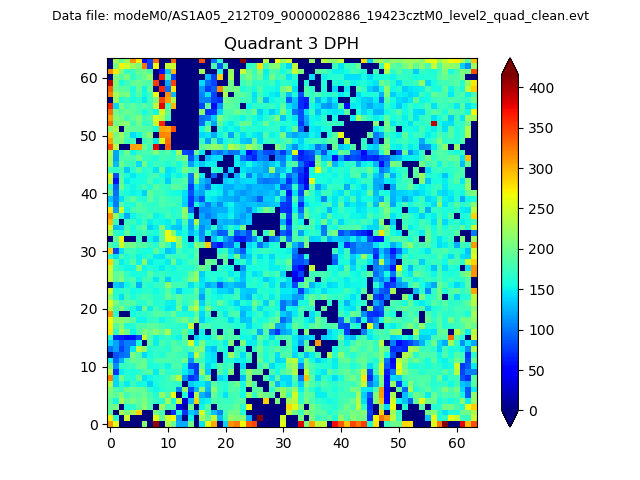 |
 |
Quadrant C |
| Plot type | Count rate plots | Images |
|---|---|---|
| Comparison with Poisson distribution Blue bars denote a histogram of data divided into 1 sec bins. Red curve is a Poisson curve with rate = median count rate of data. |
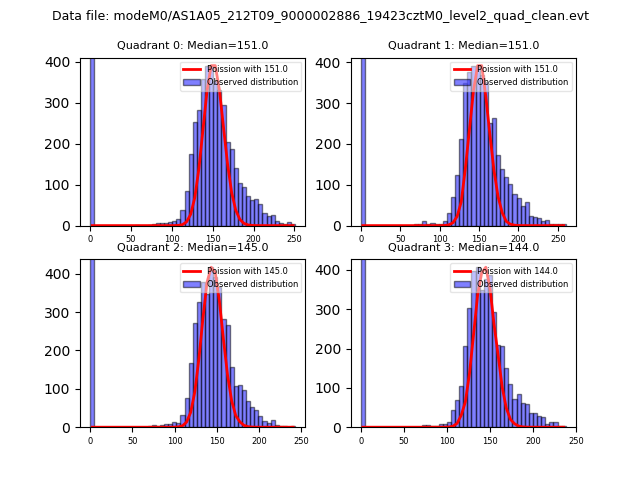 |
 |
| Quadrant-wise count rates Data is divided into 100 sec bins |
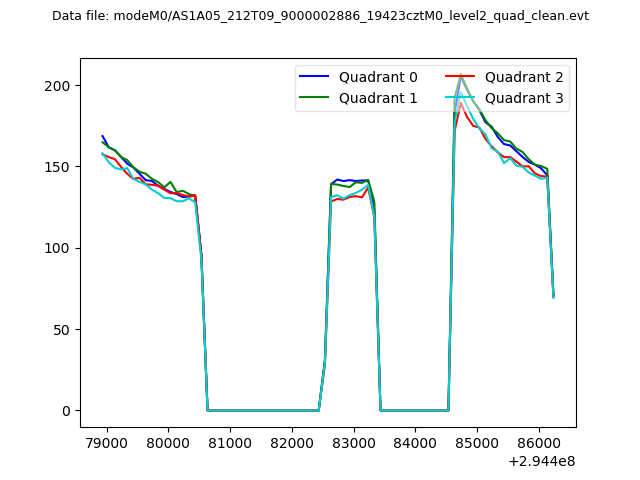 |
|
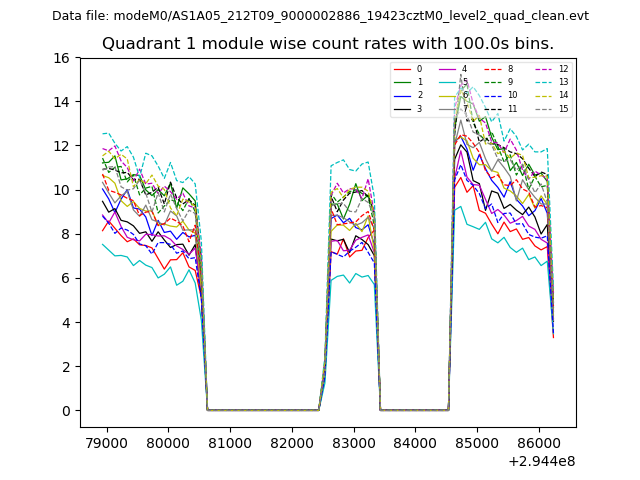
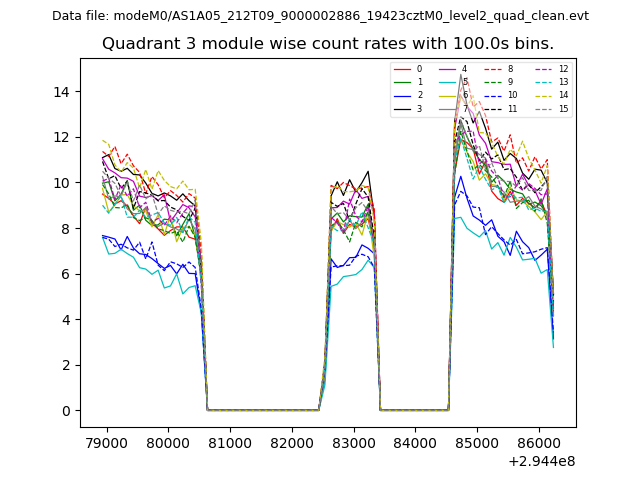
| Module-wise count rates for Quadrant A Data is divided into 100 sec bins |
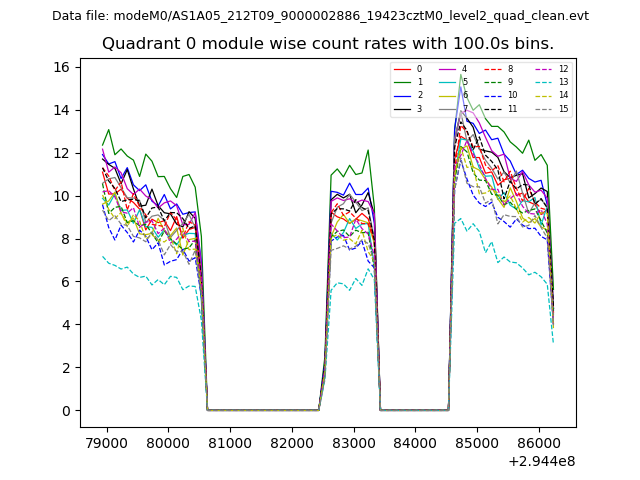 |
 |
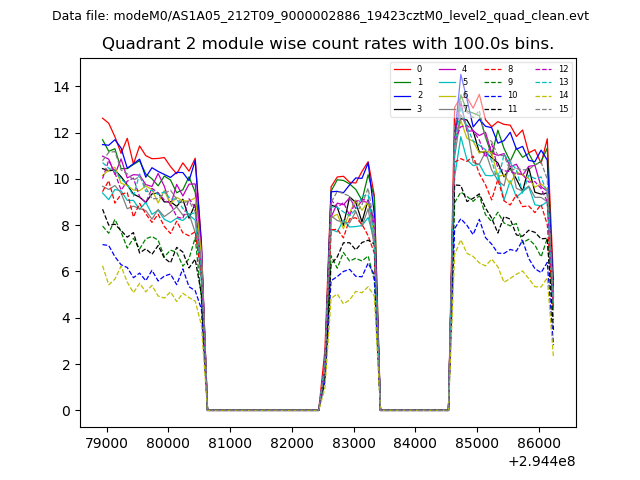
| Module-wise count rates for Quadrant B Data is divided into 100 sec bins |
 |
 |
| Module-wise count rates for Quadrant C Data is divided into 100 sec bins |
 |
 |
| Module-wise count rates for Quadrant D Data is divided into 100 sec bins |
 |
 |
| Parameter | Plot |
|---|---|
| CZT HV Monitor | 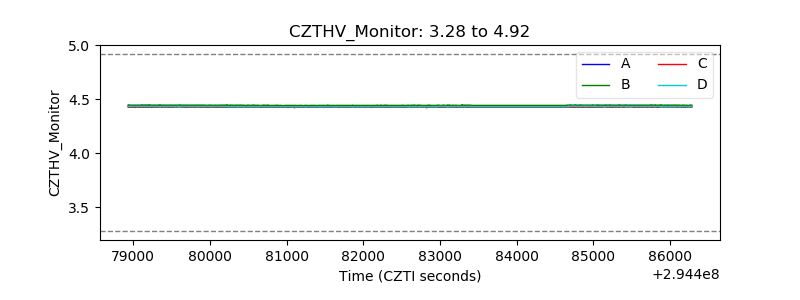 |
| D_VDD | 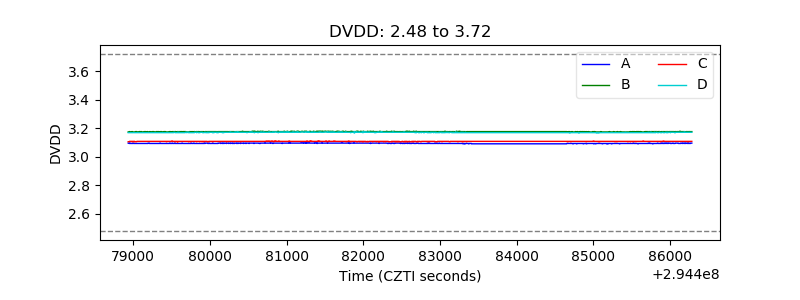 |
| Temperature 1 | 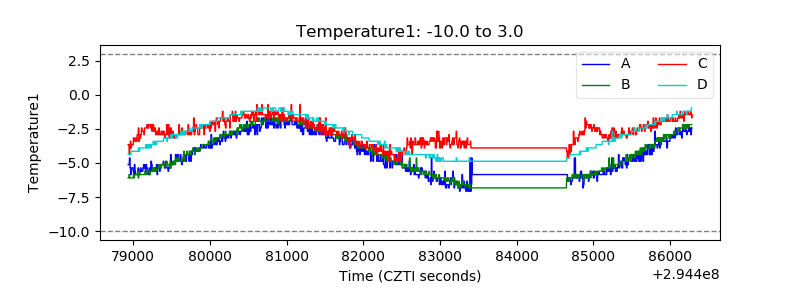 |
| Veto HV Monitor | 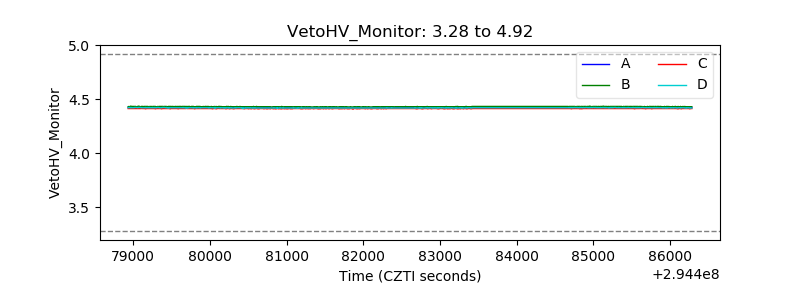 |
| Veto LLD | 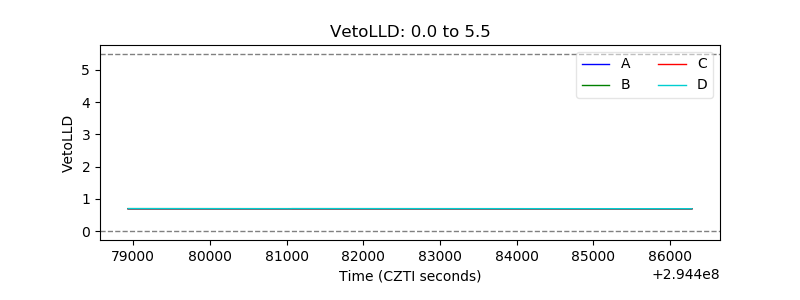 |
| Alpha Counter | 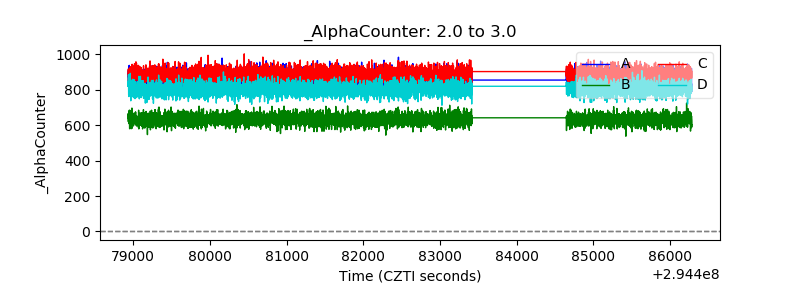 |
| _CPM_Rate | 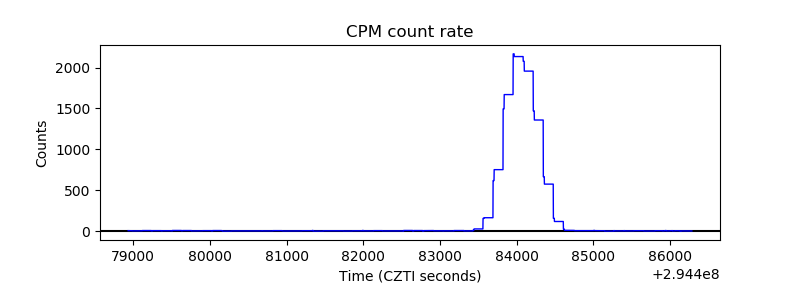 |
| CZT Counter | 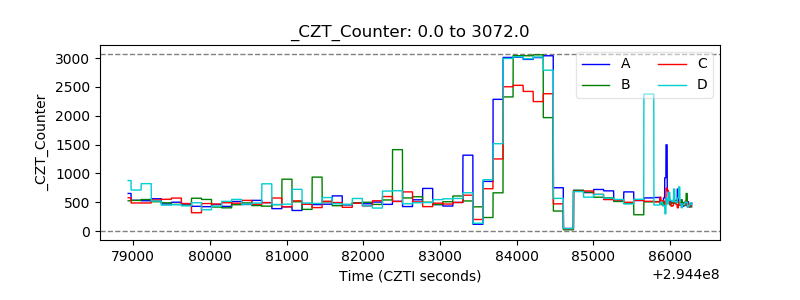 |
| +2.5 Volts monitor | 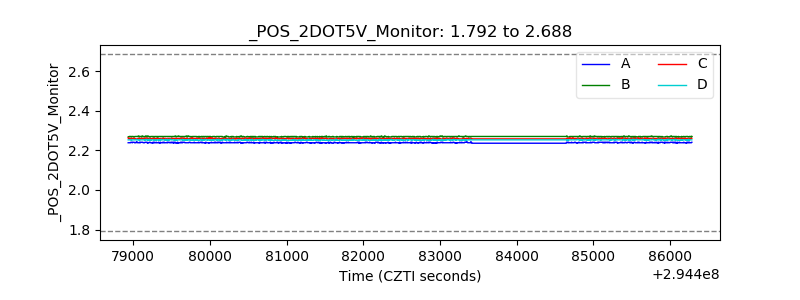 |
| +5 Volts monitor |  |
| _ROLL_ROT | 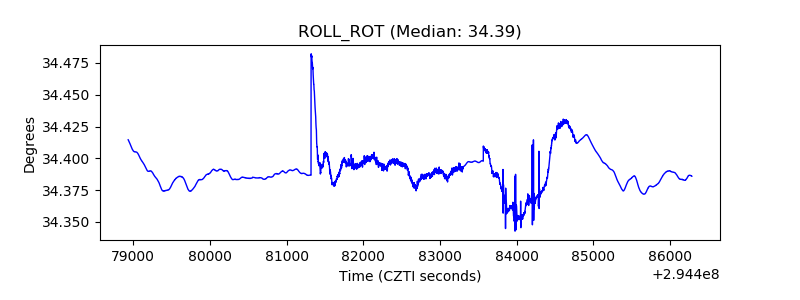 |
| _Roll_DEC | 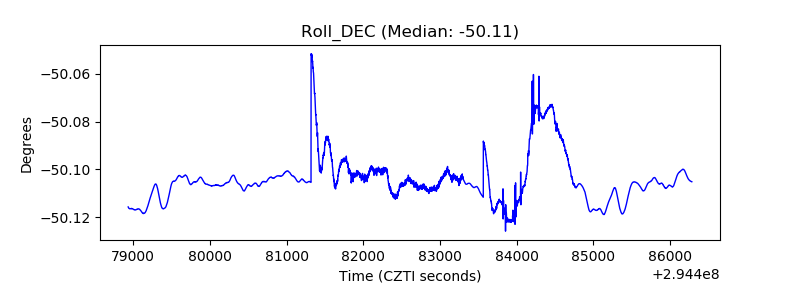 |
| _Roll_RA | 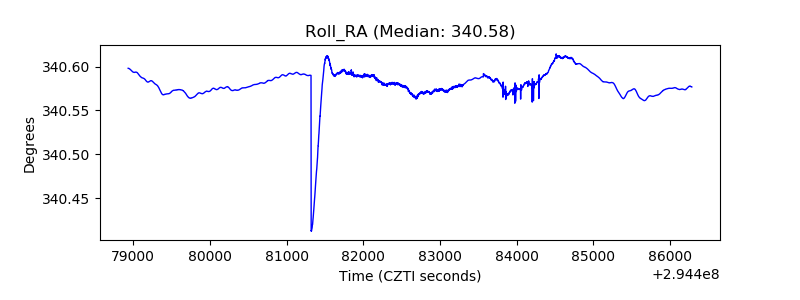 |
| Veto Counter | 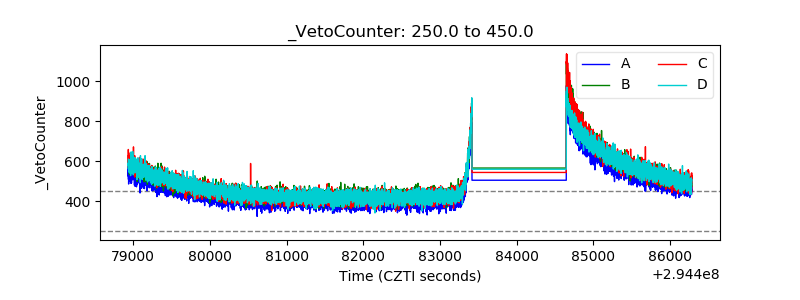 |