| Param | Original file | Final file |
|---|---|---|
| Filename | modeM0/AS1A05_212T09_9000002886_19424cztM0_level2.evt | modeM0/AS1A05_212T09_9000002886_19424cztM0_level2_quad_clean.evt |
| Size (bytes) | 444,787,200 | 96,189,120 |
| Size | 424.2 MB | 91.7 MB |
| Events in quadrant A | 3,246,764 | 640,167 |
| Events in quadrant B | 3,246,276 | 641,495 |
| Events in quadrant C | 3,163,844 | 603,762 |
| Events in quadrant D | 3,401,523 | 603,992 |
| Mode SS | |||
|---|---|---|---|
| Quadrant | BADHDUFLAG | Total packets | Discarded packets |
| A | 0 | 124 | 0 |
| B | 0 | 124 | 0 |
| C | 0 | 124 | 0 |
| D | 0 | 124 | 0 |
| Mode M0 | |||
|---|---|---|---|
| Quadrant | BADHDUFLAG | Total packets | Discarded packets |
| A | 0 | 13243 | 2 |
| B | 0 | 13142 | 1 |
| C | 0 | 12975 | 1 |
| D | 0 | 13790 | 1 |
| Mode M9 | |||
|---|---|---|---|
| Quadrant | BADHDUFLAG | Total packets | Discarded packets |
| A | 0 | 13 | 0 |
| B | 0 | 13 | 0 |
| C | 0 | 13 | 0 |
| D | 0 | 13 | 0 |
| Quadrant | Total seconds | Saturated seconds | Saturation percentage |
|---|---|---|---|
| A | 6064 | 74 | 1.220317% |
| B | 6064 | 80 | 1.319261% |
| C | 6065 | 93 | 1.533388% |
| D | 6065 | 80 | 1.319044% |
Noise dominated data is calculated using 1-second bins in cleaned event files. If a bin has >2000 counts, and if more than 50% of those come from <1% of pixels, then it is considered to be noise-dominated and hence unusable.
| Quadrant | # 1 sec bins | Bins with >0 counts | Bins with >2000 counts | High rate bins dominated by noise | Noise dominated (total time) | Noise dominated (detector-on time) | Marked lightcurve |
|---|---|---|---|---|---|---|---|
| A | 7354 | 6064 | 1 | 1 | 0.01% | 0.02% | 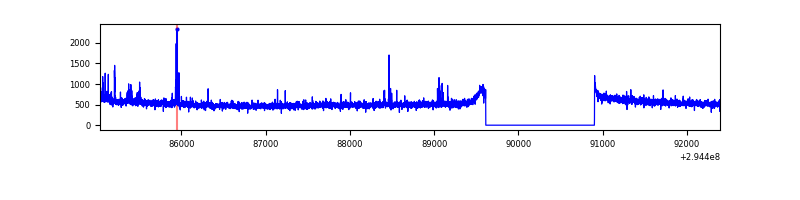 |
| B | 7354 | 6064 | 8 | 8 | 0.11% | 0.13% | 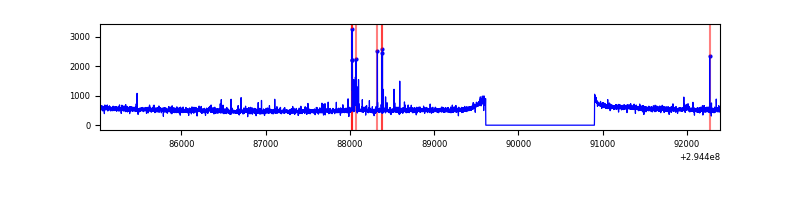 |
| C | 7355 | 6065 | 0 | 0 | 0.00% | 0.00% | 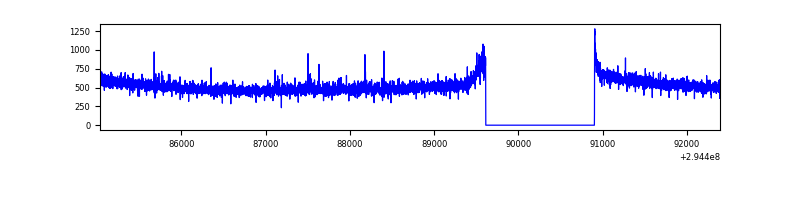 |
| D | 7355 | 6065 | 19 | 19 | 0.26% | 0.31% | 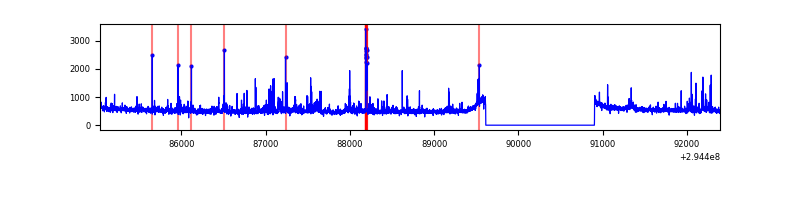 |
Top three noisy pixels from each quadrant. If the there are fewer than three noisy pixels in the level2.evt file, extra rows are filled as -1
| Pixel properties | Quadrant properties | ||||||
|---|---|---|---|---|---|---|---|
| Quadrant | DetID | PixID | Counts | Sigma | Mean | Median | Sigma |
| A | 5 | 16 | 61752 | 369.96 | 824 | 810 | 164.7 |
| A | 12 | 96 | 11619 | 65.62 | 824 | 810 | 164.7 |
| A | 13 | 254 | 8834 | 48.71 | 824 | 810 | 164.7 |
| B | 3 | 64 | 38549 | 248.59 | 805 | 786 | 151.9 |
| B | 0 | 198 | 22134 | 140.53 | 805 | 786 | 151.9 |
| B | 7 | 220 | 17337 | 108.96 | 805 | 786 | 151.9 |
| C | 14 | 238 | 122808 | 682.93 | 770 | 776 | 178.7 |
| C | 3 | 233 | 35223 | 192.78 | 770 | 776 | 178.7 |
| C | 13 | 61 | 5397 | 25.86 | 770 | 776 | 178.7 |
| D | 1 | 52 | 243501 | 1246.96 | 802 | 780 | 194.6 |
| D | 7 | 238 | 54796 | 277.5 | 802 | 780 | 194.6 |
| D | 7 | 96 | 48076 | 242.98 | 802 | 780 | 194.6 |
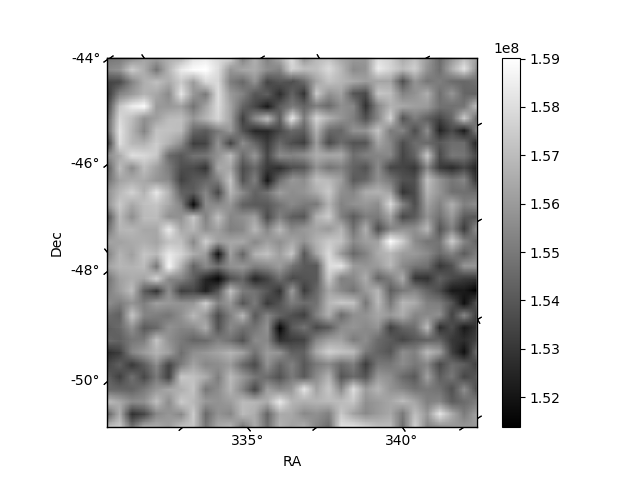
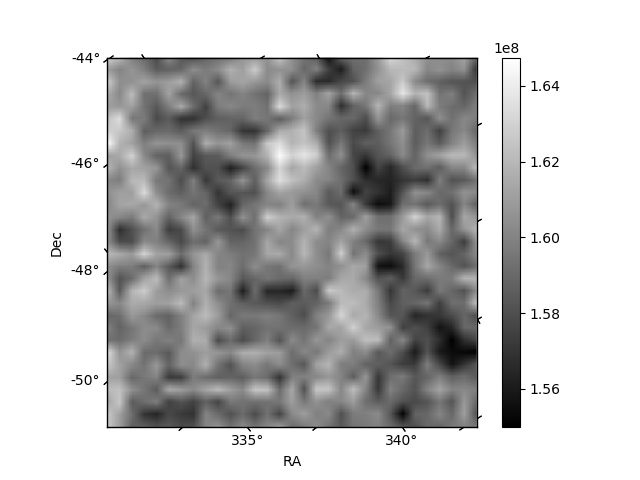
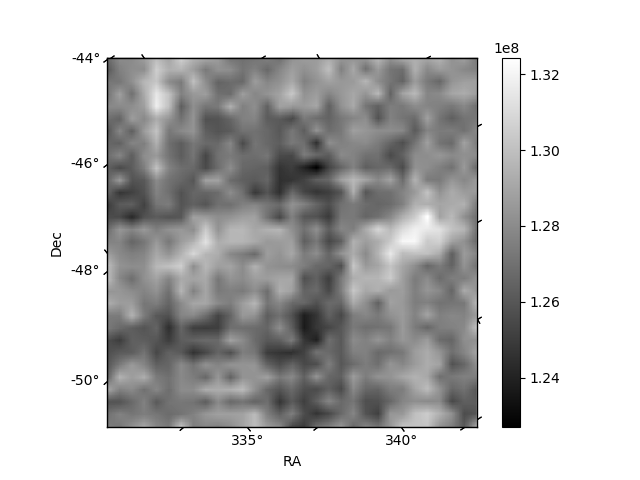
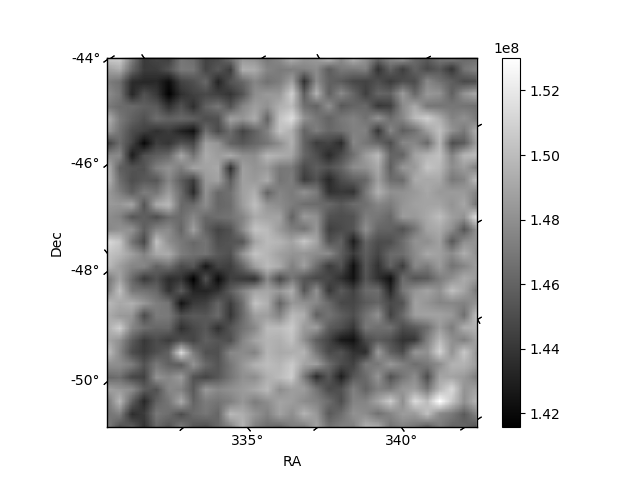
Histogram calculated using DETX and DETY for each event in the final _common_clean file
| Quadrant A | 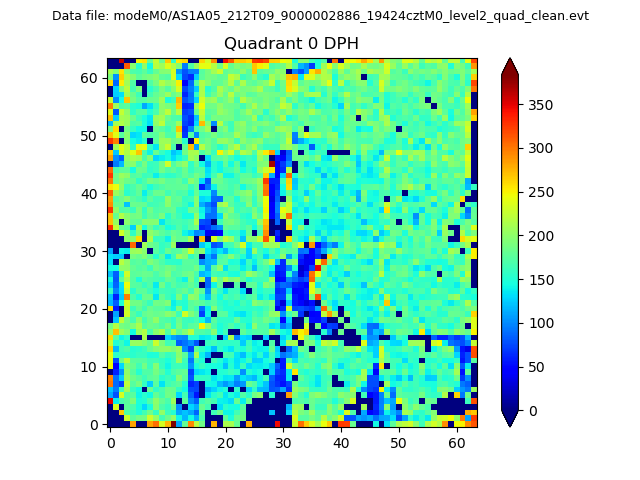 |
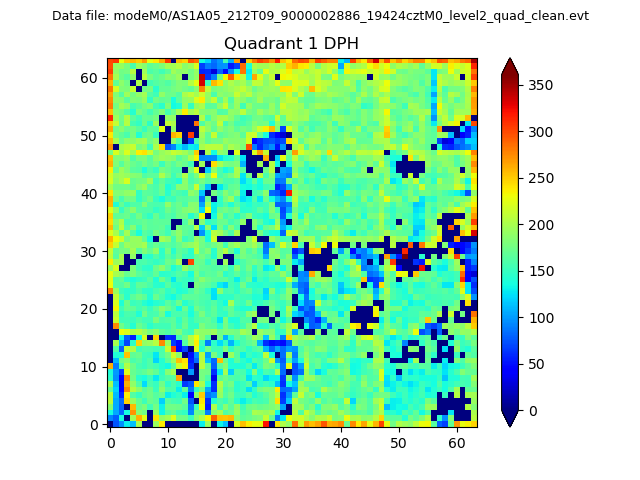 |
Quadrant B |
|---|---|---|---|
| Quadrant D | 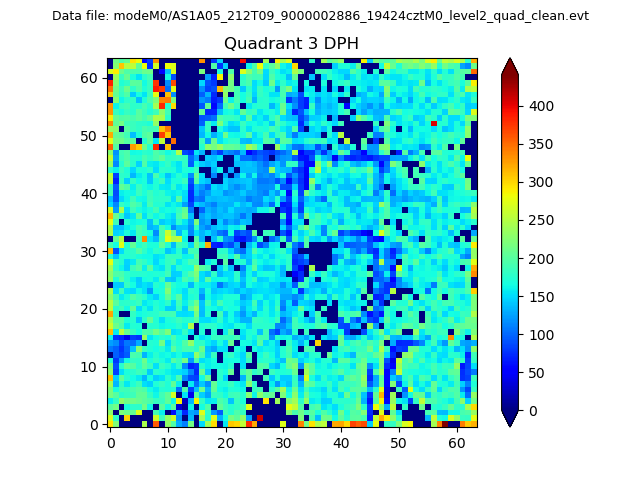 |
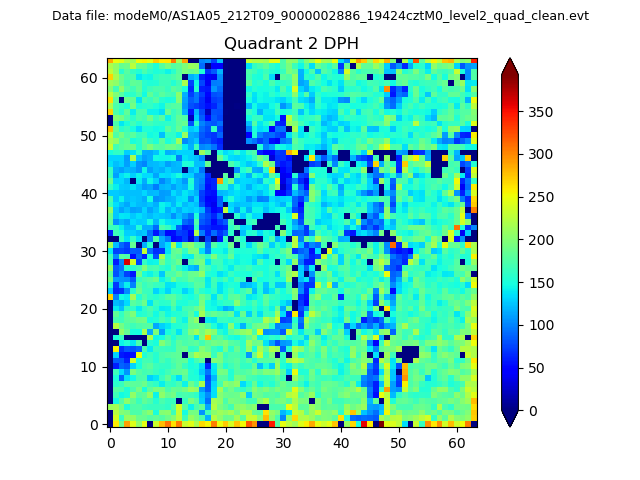 |
Quadrant C |
| Plot type | Count rate plots | Images |
|---|---|---|
| Comparison with Poisson distribution Blue bars denote a histogram of data divided into 1 sec bins. Red curve is a Poisson curve with rate = median count rate of data. |
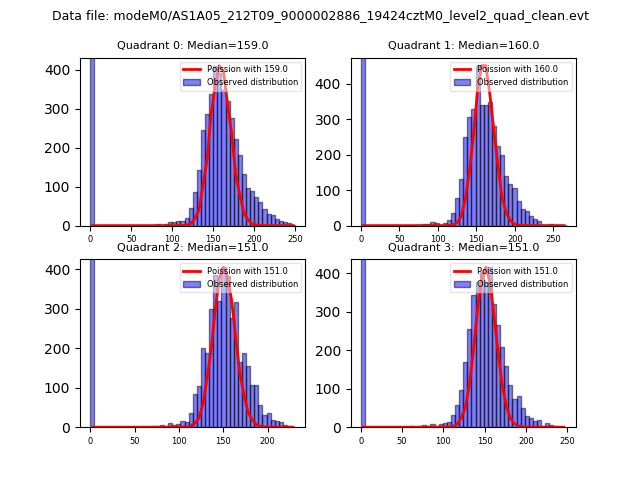 |
 |
| Quadrant-wise count rates Data is divided into 100 sec bins |
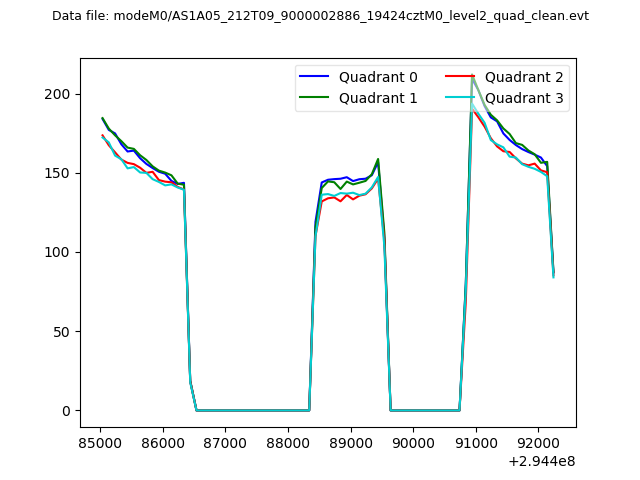 |
|
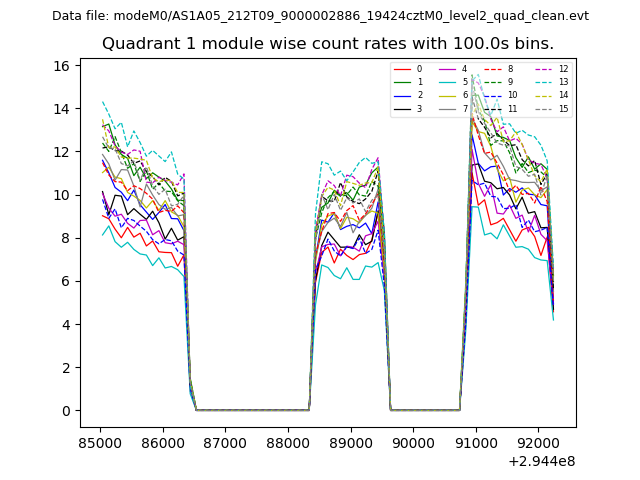
| Module-wise count rates for Quadrant A Data is divided into 100 sec bins |
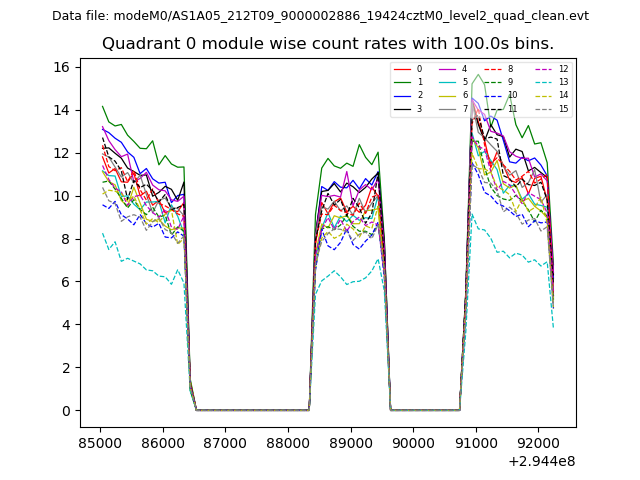 |
 |
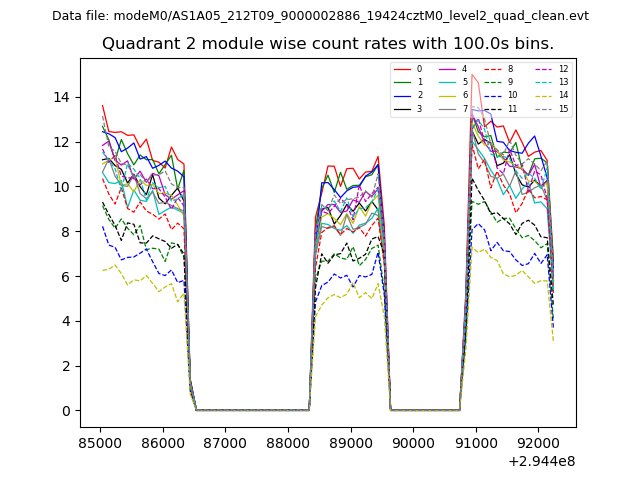
| Module-wise count rates for Quadrant B Data is divided into 100 sec bins |
 |
 |
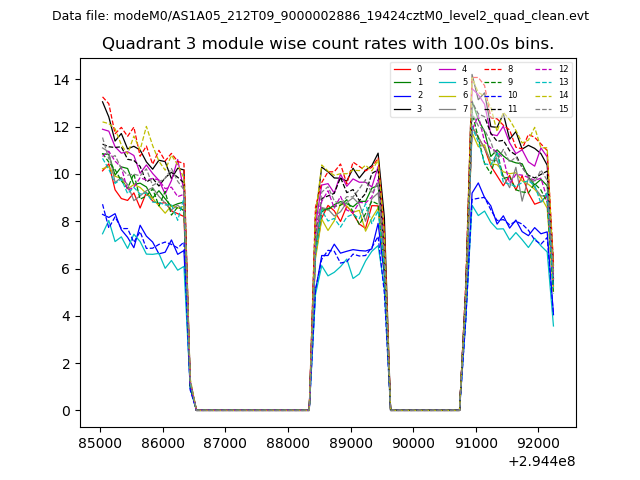
| Module-wise count rates for Quadrant C Data is divided into 100 sec bins |
 |
 |
| Module-wise count rates for Quadrant D Data is divided into 100 sec bins |
 |
 |
| Parameter | Plot |
|---|---|
| CZT HV Monitor | 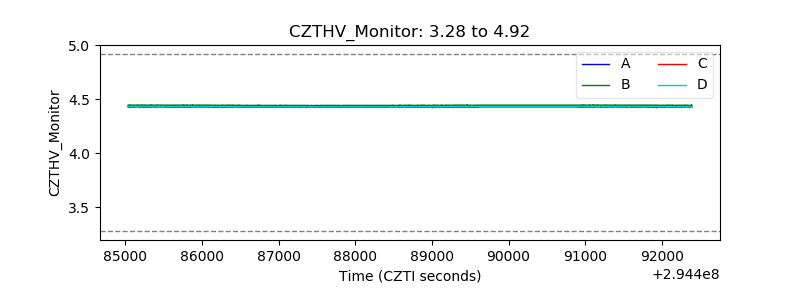 |
| D_VDD | 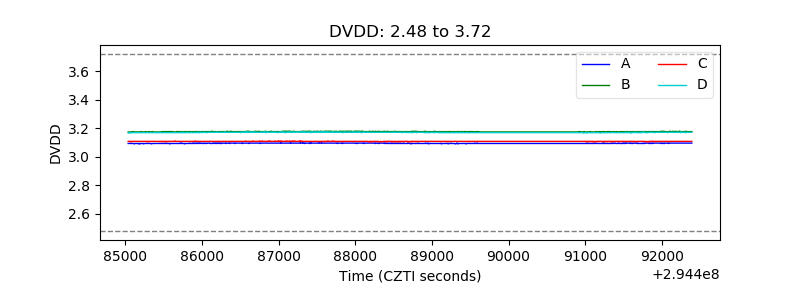 |
| Temperature 1 |  |
| Veto HV Monitor | 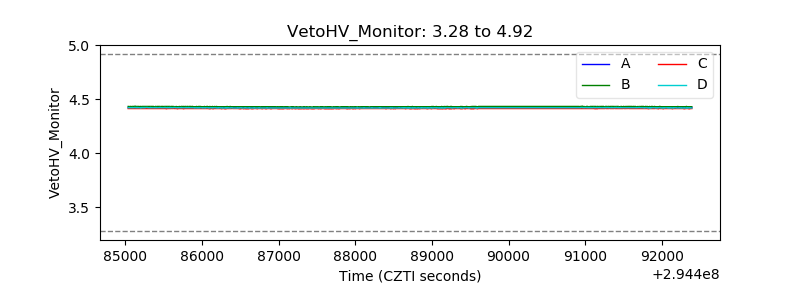 |
| Veto LLD | 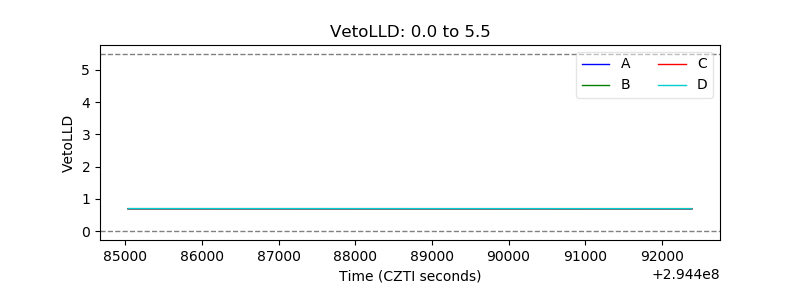 |
| Alpha Counter | 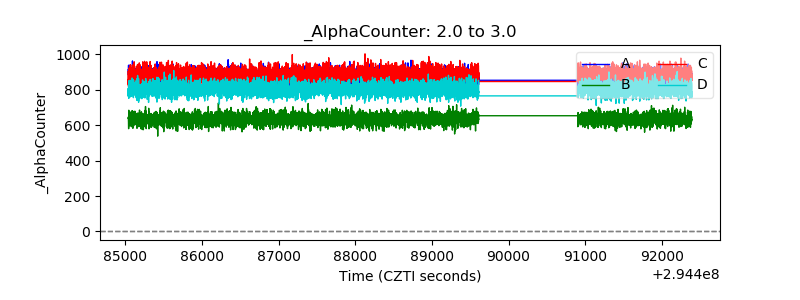 |
| _CPM_Rate | 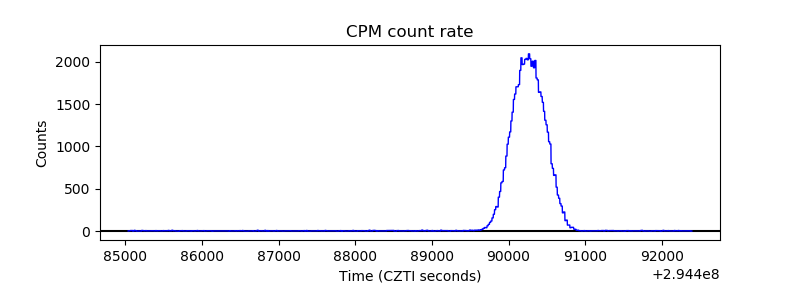 |
| CZT Counter | 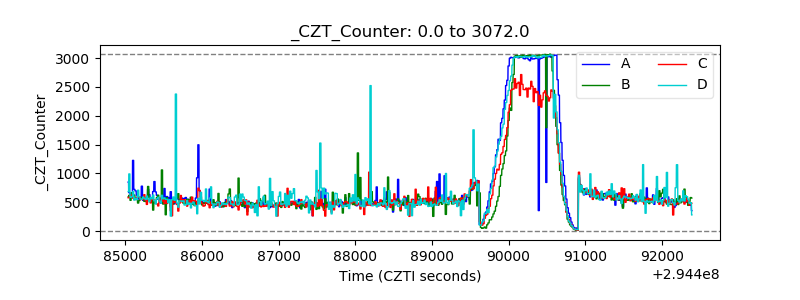 |
| +2.5 Volts monitor |  |
| +5 Volts monitor |  |
| _ROLL_ROT | 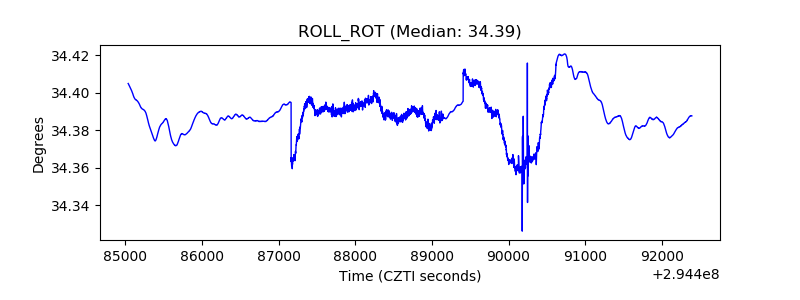 |
| _Roll_DEC | 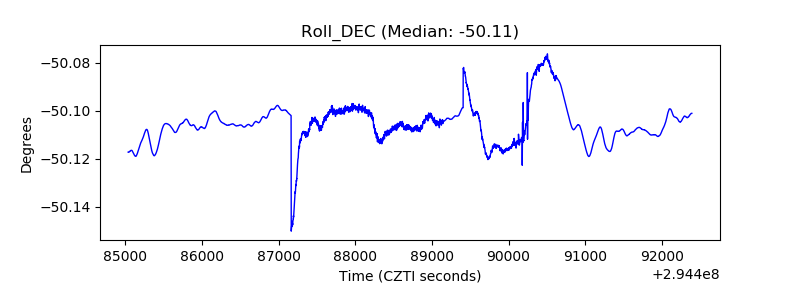 |
| _Roll_RA |  |
| Veto Counter | 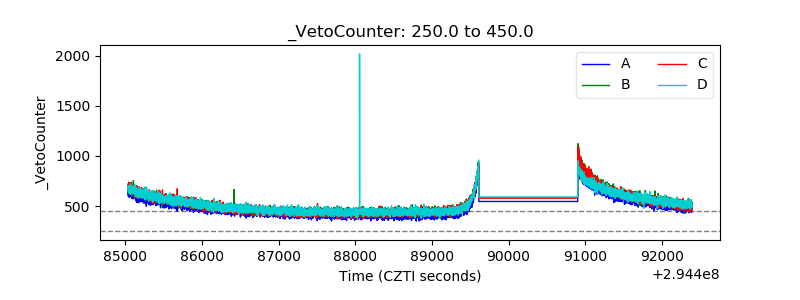 |