| Param | Original file | Final file |
|---|---|---|
| Filename | modeM0/AS1A05_212T09_9000002886_19425cztM0_level2.evt | modeM0/AS1A05_212T09_9000002886_19425cztM0_level2_quad_clean.evt |
| Size (bytes) | 294,062,400 | 48,329,280 |
| Size | 280.4 MB | 46.1 MB |
| Events in quadrant A | 1,993,298 | 306,248 |
| Events in quadrant B | 2,077,480 | 305,478 |
| Events in quadrant C | 1,956,469 | 285,554 |
| Events in quadrant D | 2,607,394 | 285,491 |
| Mode SS | |||
|---|---|---|---|
| Quadrant | BADHDUFLAG | Total packets | Discarded packets |
| A | 0 | 80 | 0 |
| B | 0 | 80 | 0 |
| C | 0 | 80 | 0 |
| D | 0 | 80 | 0 |
| Mode M0 | |||
|---|---|---|---|
| Quadrant | BADHDUFLAG | Total packets | Discarded packets |
| A | 0 | 8148 | 0 |
| B | 0 | 8413 | 0 |
| C | 0 | 8096 | 0 |
| D | 0 | 10178 | 0 |
| Quadrant | Total seconds | Saturated seconds | Saturation percentage |
|---|---|---|---|
| A | 3969 | 1 | 0.025195% |
| B | 3970 | 18 | 0.453401% |
| C | 3970 | 13 | 0.327456% |
| D | 3970 | 132 | 3.324937% |
Noise dominated data is calculated using 1-second bins in cleaned event files. If a bin has >2000 counts, and if more than 50% of those come from <1% of pixels, then it is considered to be noise-dominated and hence unusable.
| Quadrant | # 1 sec bins | Bins with >0 counts | Bins with >2000 counts | High rate bins dominated by noise | Noise dominated (total time) | Noise dominated (detector-on time) | Marked lightcurve |
|---|---|---|---|---|---|---|---|
| A | 3969 | 3969 | 0 | 0 | 0.00% | 0.00% | 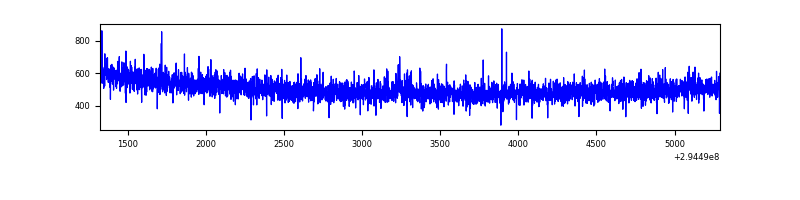 |
| B | 3970 | 3970 | 9 | 9 | 0.23% | 0.23% | 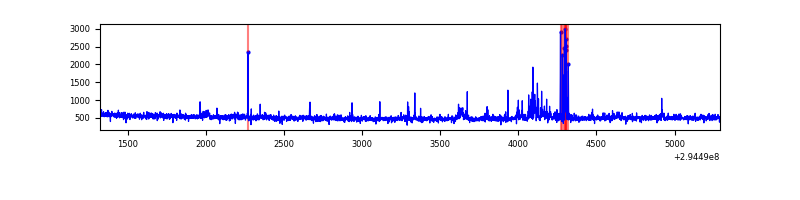 |
| C | 3970 | 3970 | 0 | 0 | 0.00% | 0.00% | 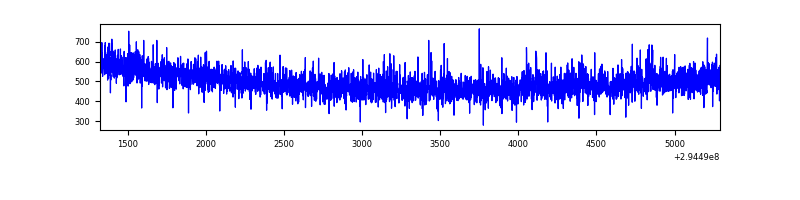 |
| D | 3970 | 3970 | 144 | 144 | 3.63% | 3.63% | 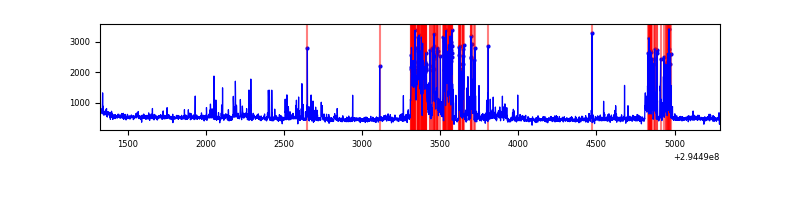 |
Top three noisy pixels from each quadrant. If the there are fewer than three noisy pixels in the level2.evt file, extra rows are filled as -1
| Pixel properties | Quadrant properties | ||||||
|---|---|---|---|---|---|---|---|
| Quadrant | DetID | PixID | Counts | Sigma | Mean | Median | Sigma |
| A | 8 | 205 | 9930 | 91.02 | 513 | 503 | 103.6 |
| A | 13 | 254 | 6296 | 55.93 | 513 | 503 | 103.6 |
| A | 12 | 96 | 6013 | 53.2 | 513 | 503 | 103.6 |
| B | 7 | 220 | 45985 | 480.1 | 502 | 491 | 94.8 |
| B | 0 | 198 | 16490 | 168.84 | 502 | 491 | 94.8 |
| B | 0 | 190 | 16179 | 165.56 | 502 | 491 | 94.8 |
| C | 14 | 238 | 77480 | 695.4 | 476 | 478 | 110.7 |
| C | 3 | 233 | 17267 | 151.62 | 476 | 478 | 110.7 |
| C | 13 | 61 | 3328 | 25.74 | 476 | 478 | 110.7 |
| D | 1 | 52 | 693181 | 5885.77 | 489 | 476 | 117.7 |
| D | 7 | 238 | 35357 | 296.38 | 489 | 476 | 117.7 |
| D | 2 | 234 | 16147 | 133.15 | 489 | 476 | 117.7 |
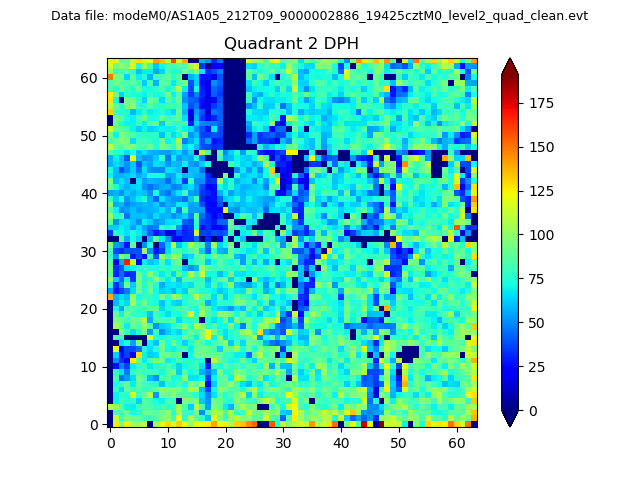
Histogram calculated using DETX and DETY for each event in the final _common_clean file
| Quadrant A | 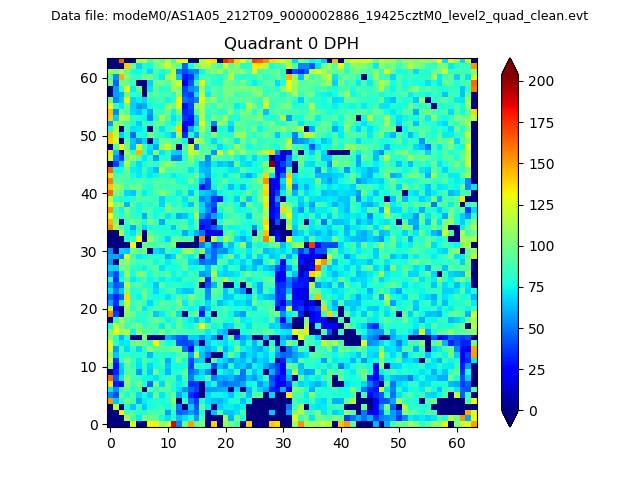 |
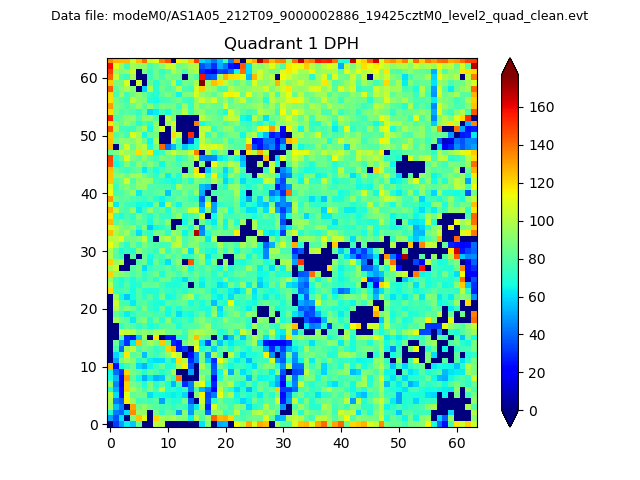 |
Quadrant B |
|---|---|---|---|
| Quadrant D | 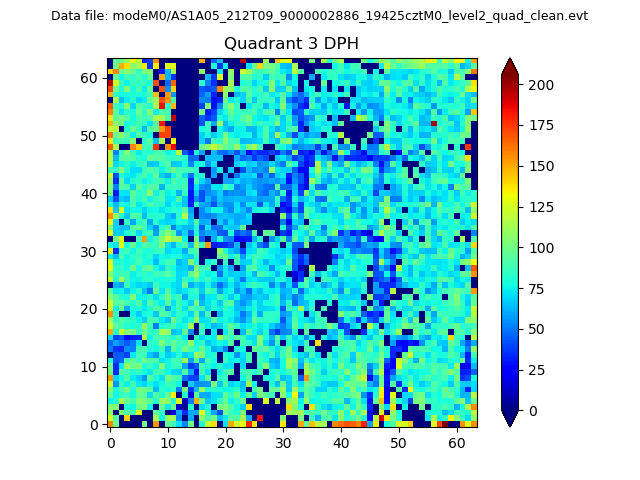 |
 |
Quadrant C |
| Plot type | Count rate plots | Images |
|---|---|---|
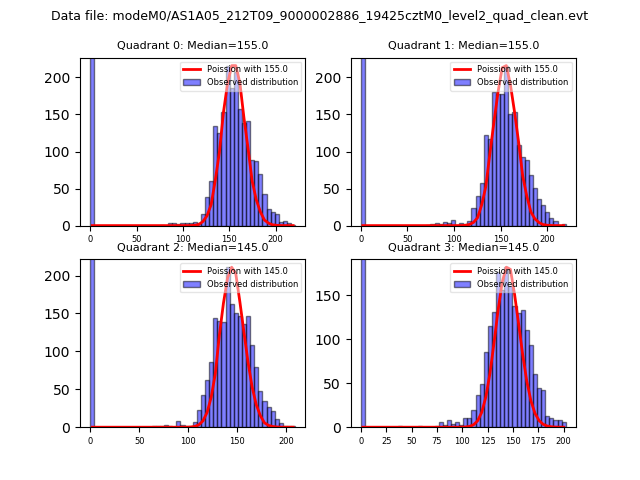
| Comparison with Poisson distribution Blue bars denote a histogram of data divided into 1 sec bins. Red curve is a Poisson curve with rate = median count rate of data. |
 |
 |
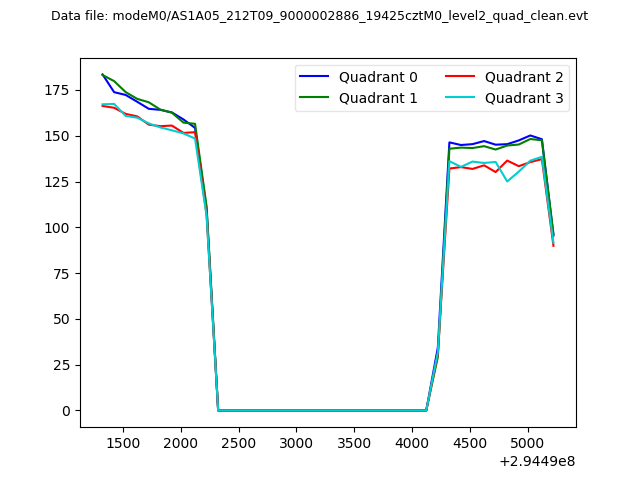
| Quadrant-wise count rates Data is divided into 100 sec bins |
 |
|
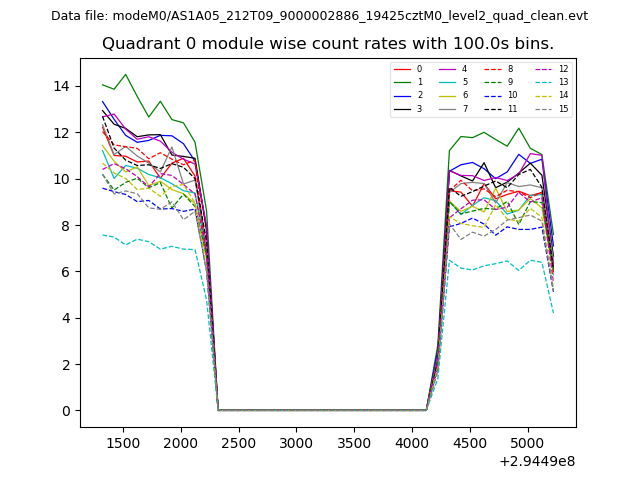
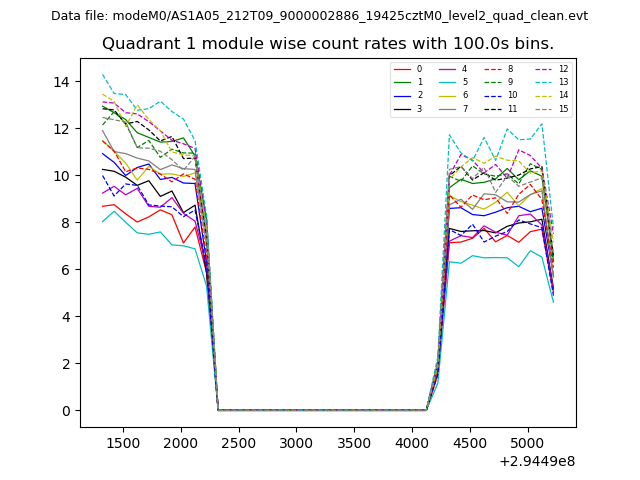
| Module-wise count rates for Quadrant A Data is divided into 100 sec bins |
 |
 |
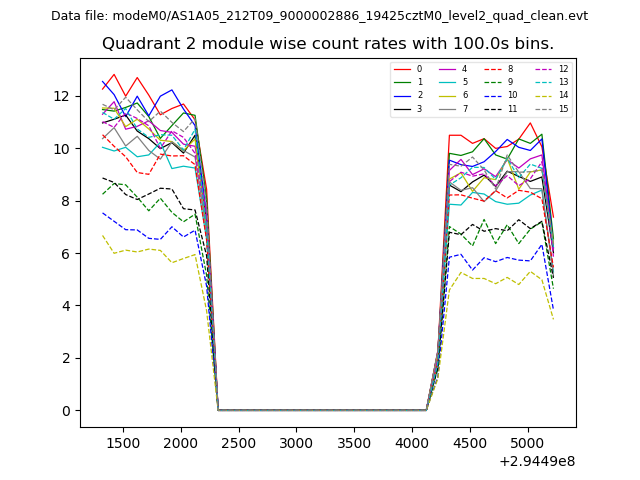
| Module-wise count rates for Quadrant B Data is divided into 100 sec bins |
 |
 |
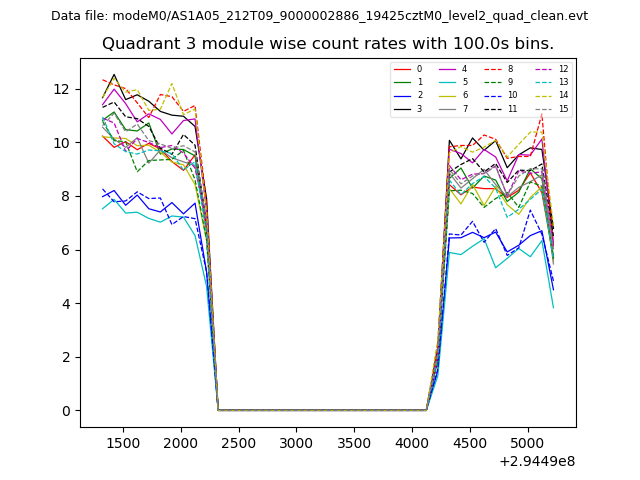
| Module-wise count rates for Quadrant C Data is divided into 100 sec bins |
 |
 |
| Module-wise count rates for Quadrant D Data is divided into 100 sec bins |
 |
 |
| Parameter | Plot |
|---|---|
| CZT HV Monitor | 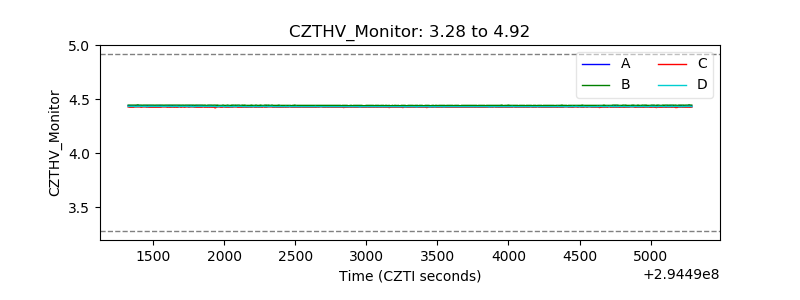 |
| D_VDD | 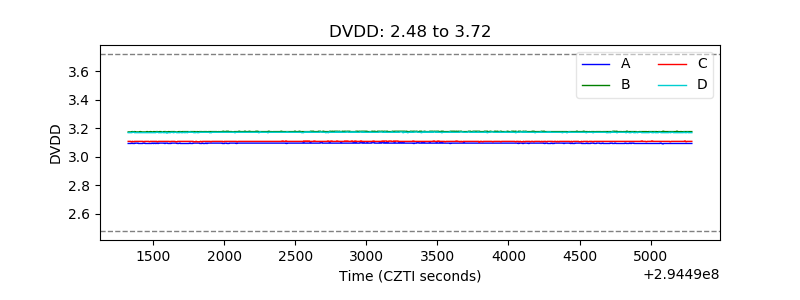 |
| Temperature 1 | 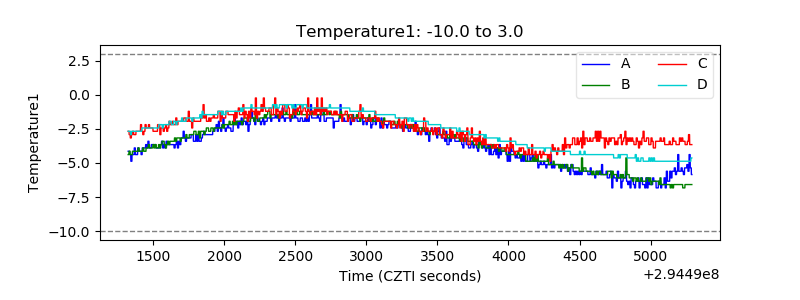 |
| Veto HV Monitor | 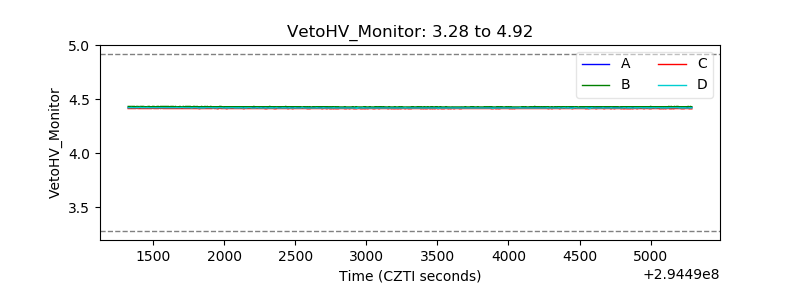 |
| Veto LLD | 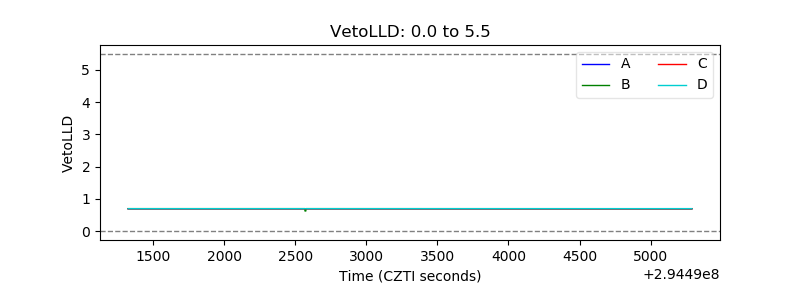 |
| Alpha Counter | 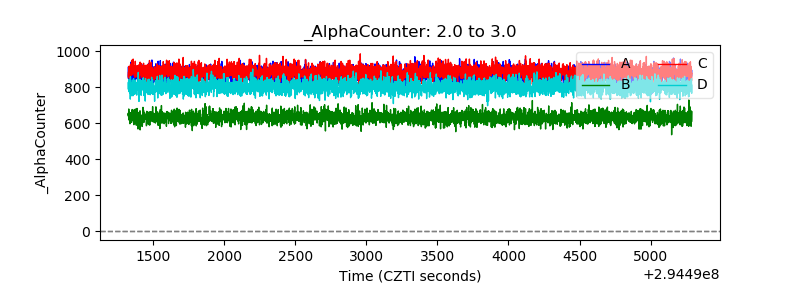 |
| _CPM_Rate | 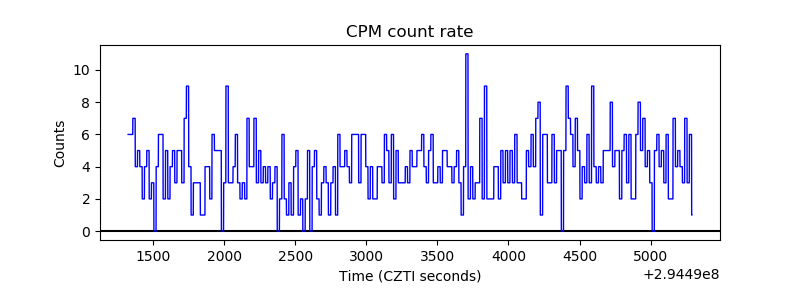 |
| CZT Counter | 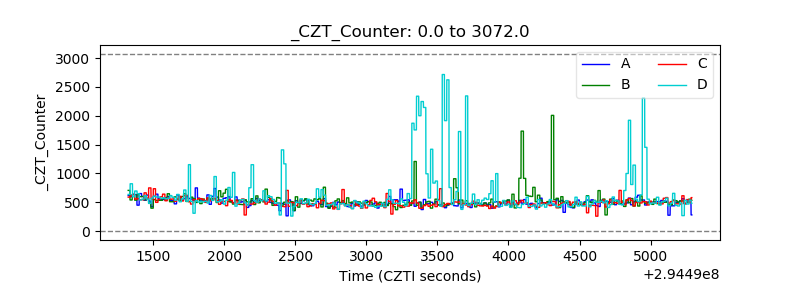 |
| +2.5 Volts monitor |  |
| +5 Volts monitor | 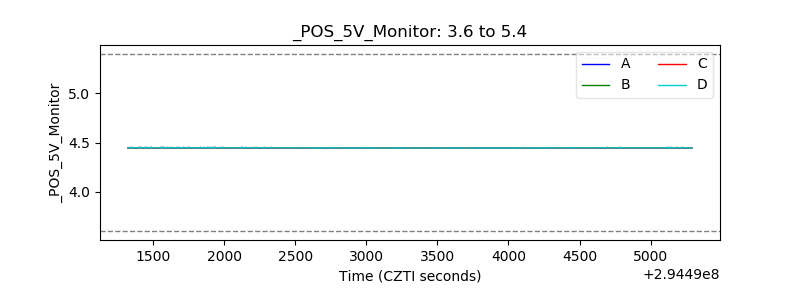 |
| _ROLL_ROT | 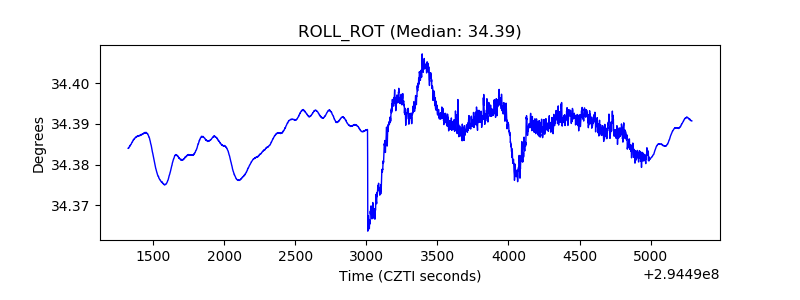 |
| _Roll_DEC | 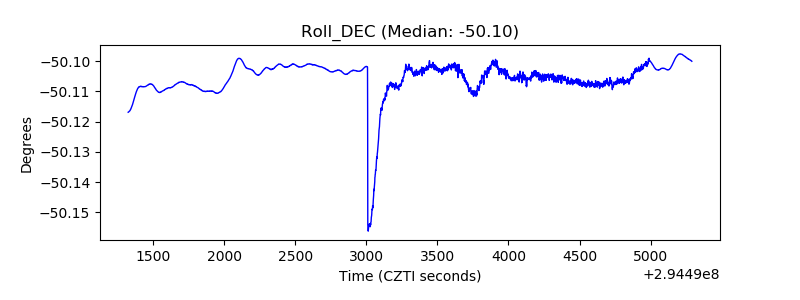 |
| _Roll_RA | 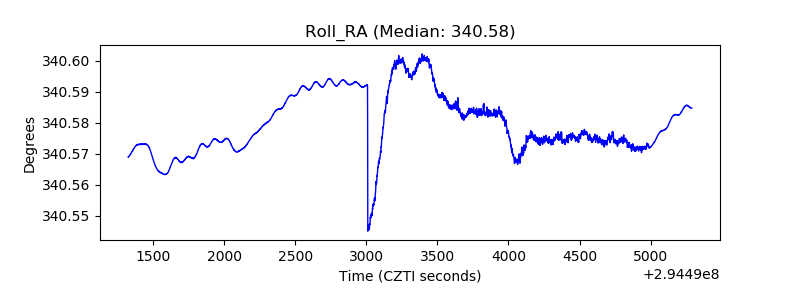 |
| Veto Counter | 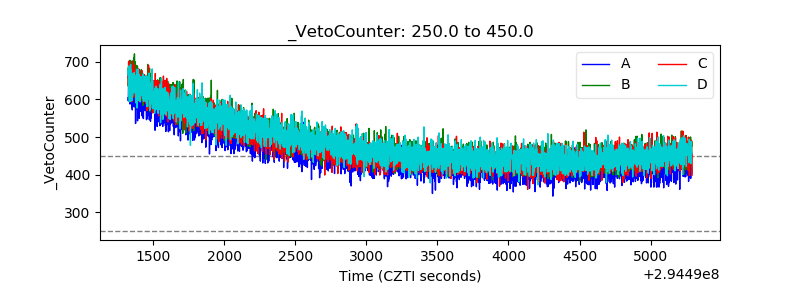 |