| Param | Original file | Final file |
|---|---|---|
| Filename | modeM0/AS1A05_221T01_9000002888cztM0_level2.fits | modeM0/AS1A05_221T01_9000002888cztM0_level2_quad_clean.evt |
| Size (bytes) | 1,428,336,000 | 1,279,768,320 |
| Size | 1.3 GB | 1.2 GB |
| Events in quadrant A | 8,907,720 | 7,589,821 |
| Events in quadrant B | 8,506,728 | 7,594,386 |
| Events in quadrant C | 8,666,258 | 7,301,842 |
| Events in quadrant D | 7,319,322 | 6,418,474 |
| Mode SS | |||
|---|---|---|---|
| Quadrant | BADHDUFLAG | Total packets | Discarded packets |
| A | 0 | 2922 | 0 |
| B | 0 | 2928 | 0 |
| C | 0 | 2924 | 0 |
| D | 0 | 2928 | 0 |
| Mode M9 | |||
|---|---|---|---|
| Quadrant | BADHDUFLAG | Total packets | Discarded packets |
| A | 0 | 234 | 0 |
| B | 0 | 233 | 0 |
| C | 0 | 234 | 0 |
| D | 0 | 234 | 0 |
| Mode M0 | |||
|---|---|---|---|
| Quadrant | BADHDUFLAG | Total packets | Discarded packets |
| A | 0 | 302690 | 0 |
| B | 0 | 309775 | 0 |
| C | 0 | 304834 | 0 |
| D | 0 | 434563 | 0 |
| Quadrant | Total seconds | Saturated seconds | Saturation percentage |
|---|---|---|---|
| A | 143926 | 1388 | 0.964384% |
| B | 143861 | 1986 | 1.380499% |
| C | 143935 | 2175 | 1.511099% |
| D | 143555 | 11522 | 8.026192% |
Noise dominated data is calculated using 1-second bins in cleaned event files. If a bin has >2000 counts, and if more than 50% of those come from <1% of pixels, then it is considered to be noise-dominated and hence unusable.
| Quadrant | # 1 sec bins | Bins with >0 counts | Bins with >2000 counts | High rate bins dominated by noise | Noise dominated (total time) | Noise dominated (detector-on time) | Marked lightcurve |
|---|---|---|---|---|---|---|---|
| A | 166811 | 144274 | 0 | 0 | 0.00% | 0.00% | 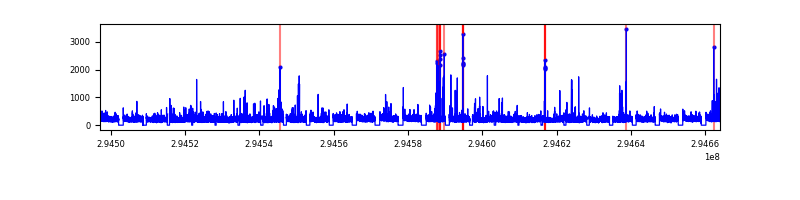 |
| B | 166811 | 144230 | 0 | 0 | 0.00% | 0.00% | 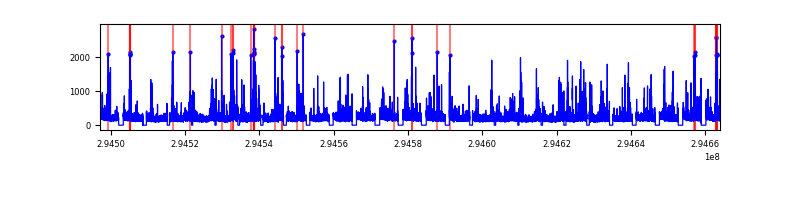 |
| C | 166811 | 144313 | 0 | 0 | 0.00% | 0.00% | 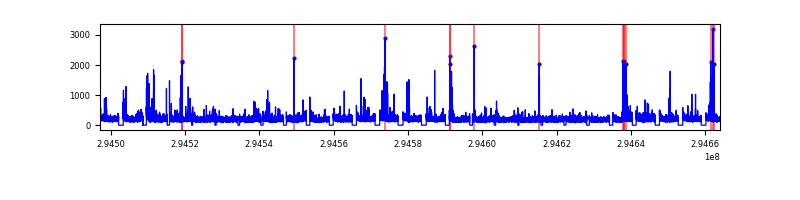 |
| D | 166811 | 143706 | 0 | 0 | 0.00% | 0.00% | 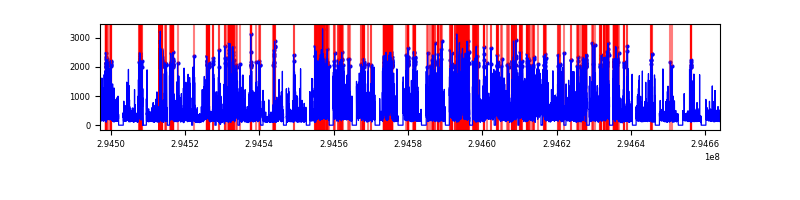 |
Top three noisy pixels from each quadrant. If the there are fewer than three noisy pixels in the level2.evt file, extra rows are filled as -1
| Pixel properties | Quadrant properties | ||||||
|---|---|---|---|---|---|---|---|
| Quadrant | DetID | PixID | Counts | Sigma | Mean | Median | Sigma |
| A | 0 | 29 | 8427 | 11.28 | 2320 | 2180 | 553.8 |
| A | 7 | 110 | 6980 | 8.67 | 2320 | 2180 | 553.8 |
| A | 0 | 30 | 6601 | 7.98 | 2320 | 2180 | 553.8 |
| B | 2 | 9 | 6843 | 10.88 | 2245 | 2144 | 431.9 |
| B | 2 | 8 | 5816 | 8.5 | 2245 | 2144 | 431.9 |
| B | 5 | 225 | 5620 | 8.05 | 2245 | 2144 | 431.9 |
| C | 1 | 81 | 6595 | 7.62 | 2284 | 2139 | 585.0 |
| C | 1 | 80 | 6510 | 7.47 | 2284 | 2139 | 585.0 |
| C | 3 | 126 | 5947 | 6.51 | 2284 | 2139 | 585.0 |
| D | 3 | 14 | 5308 | 6.2 | 2090 | 1907 | 548.8 |
| D | 10 | 189 | 5159 | 5.93 | 2090 | 1907 | 548.8 |
| D | 7 | 3 | 5054 | 5.73 | 2090 | 1907 | 548.8 |
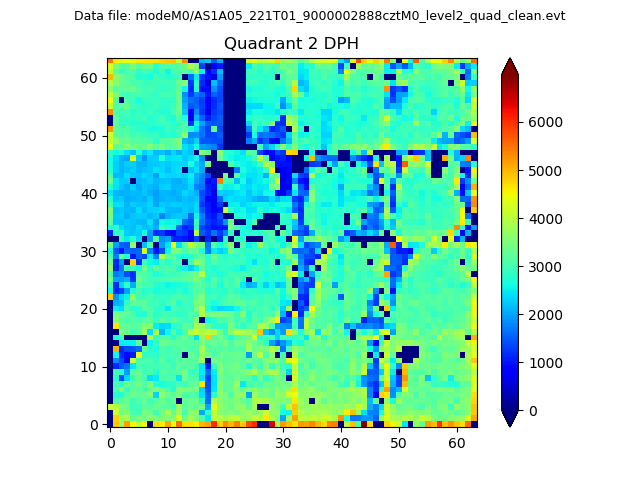
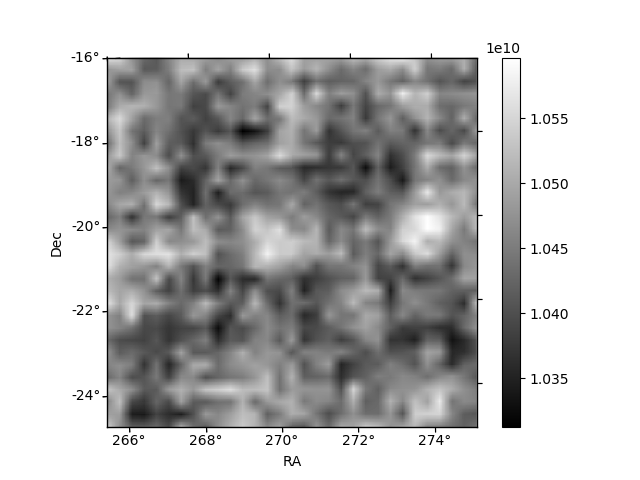
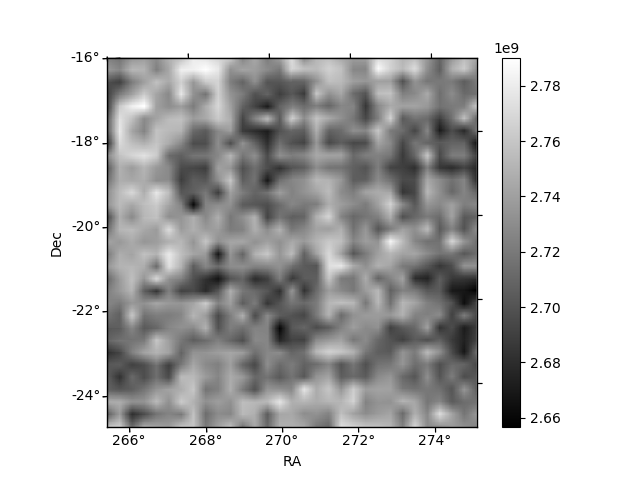
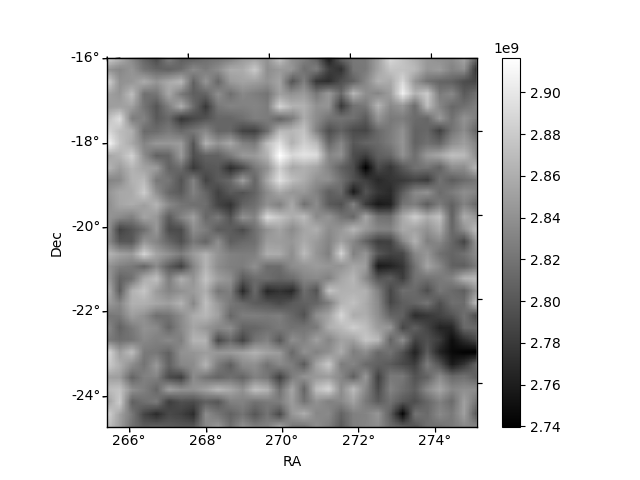
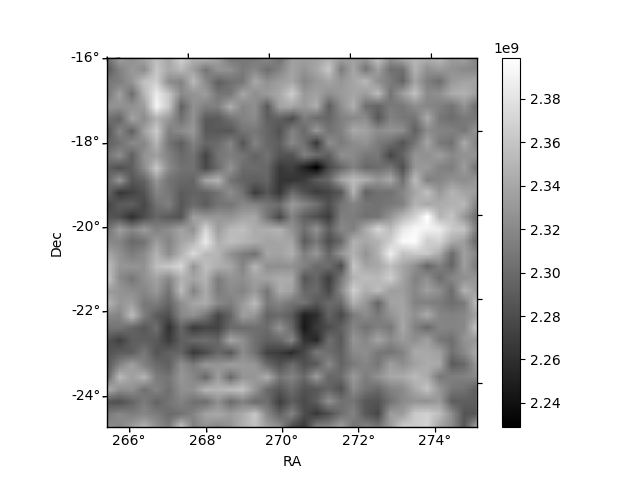
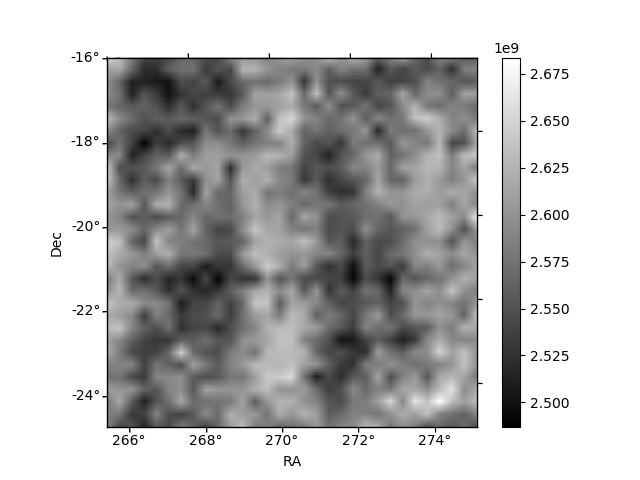
Histogram calculated using DETX and DETY for each event in the final _common_clean file
| Quadrant A | 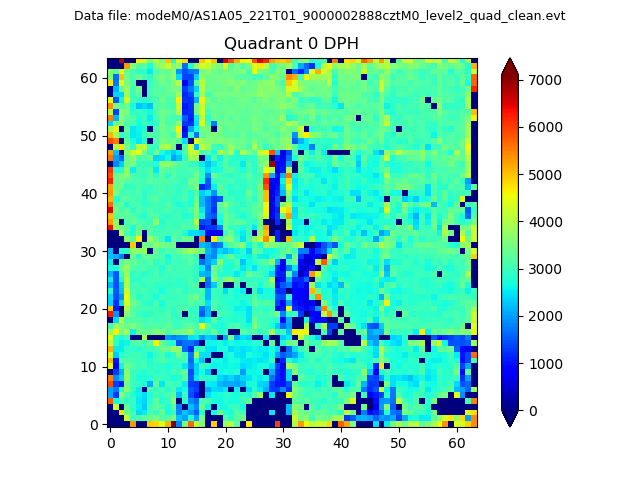 |
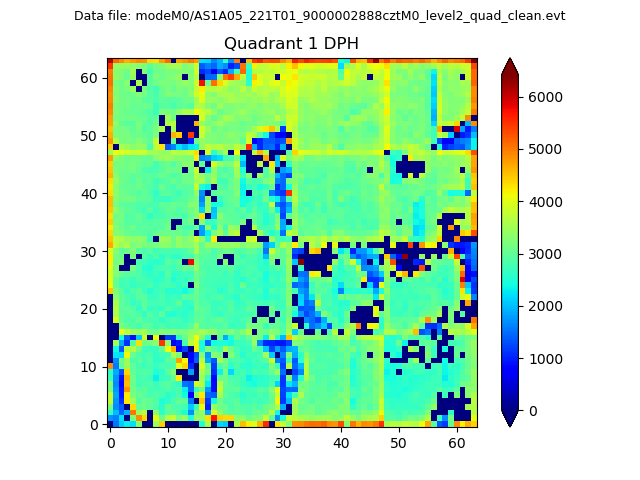 |
Quadrant B |
|---|---|---|---|
| Quadrant D | 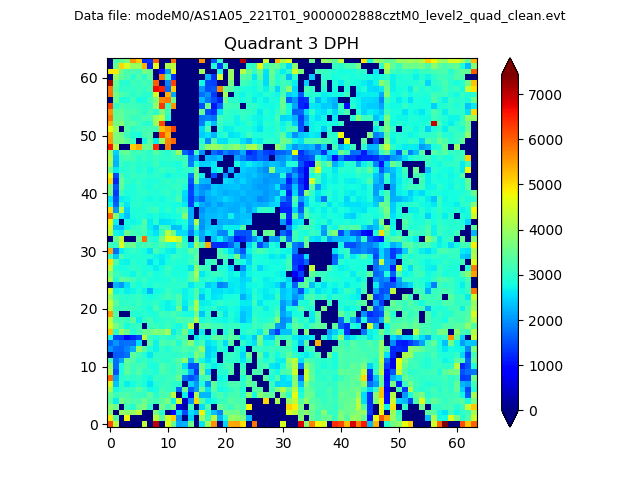 |
 |
Quadrant C |
| Plot type | Count rate plots | Images |
|---|---|---|
| Comparison with Poisson distribution Blue bars denote a histogram of data divided into 1 sec bins. Red curve is a Poisson curve with rate = median count rate of data. |
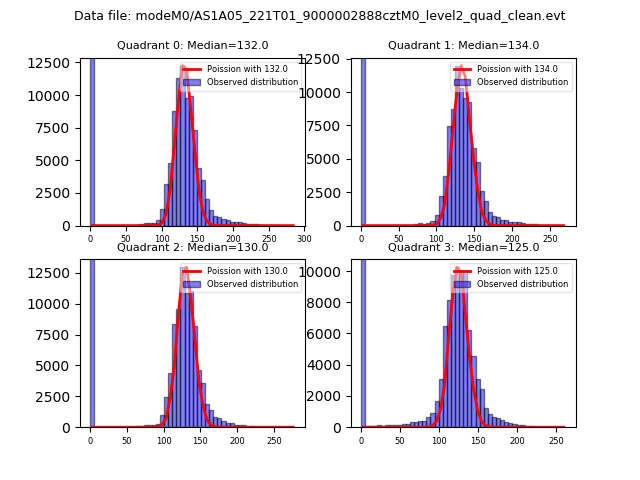 |
 |
| Quadrant-wise count rates Data is divided into 100 sec bins |
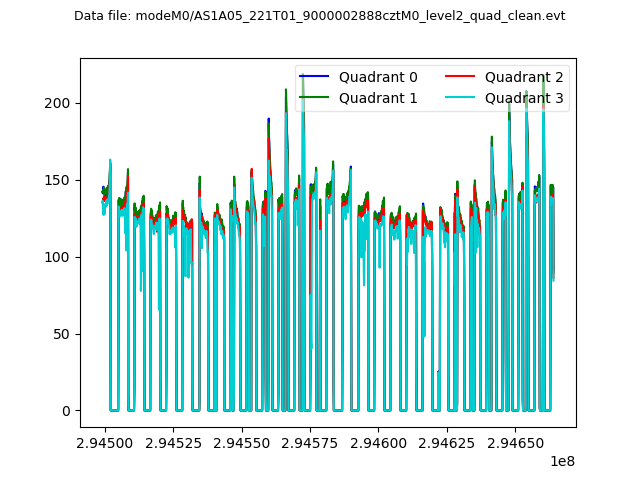 |
|
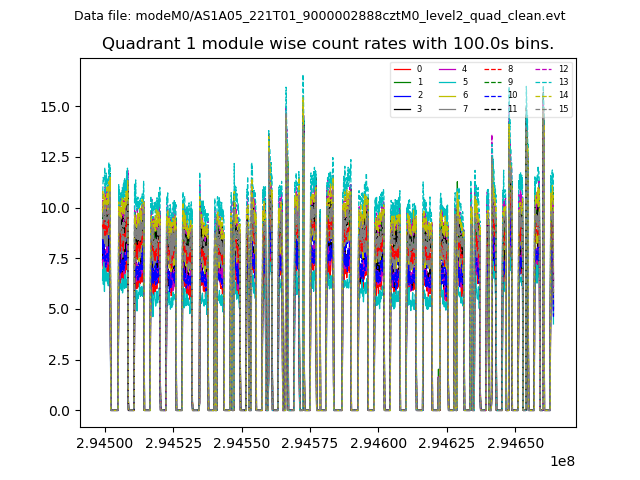
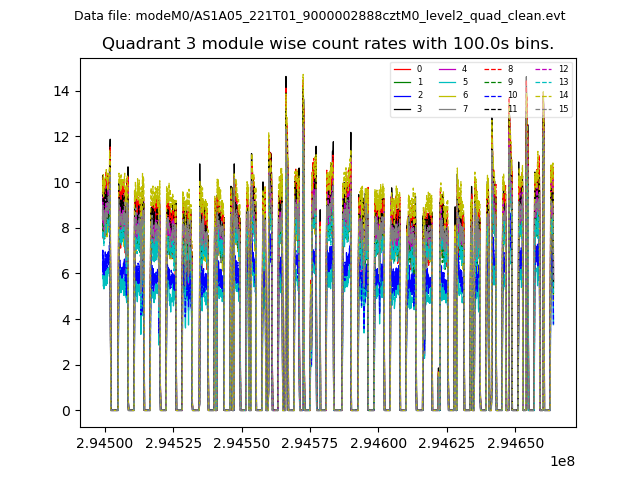
| Module-wise count rates for Quadrant A Data is divided into 100 sec bins |
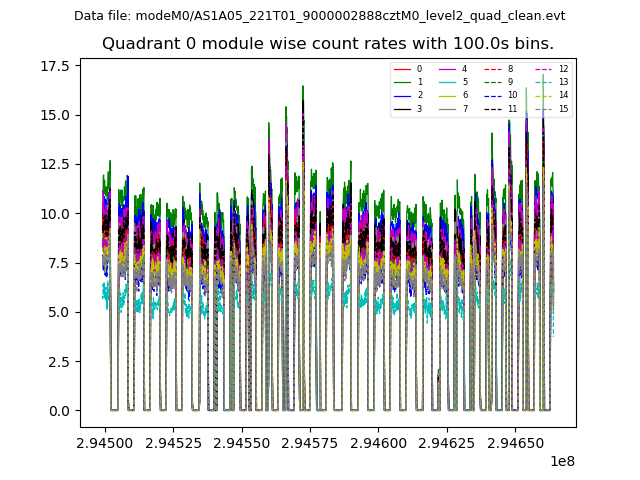 |
 |
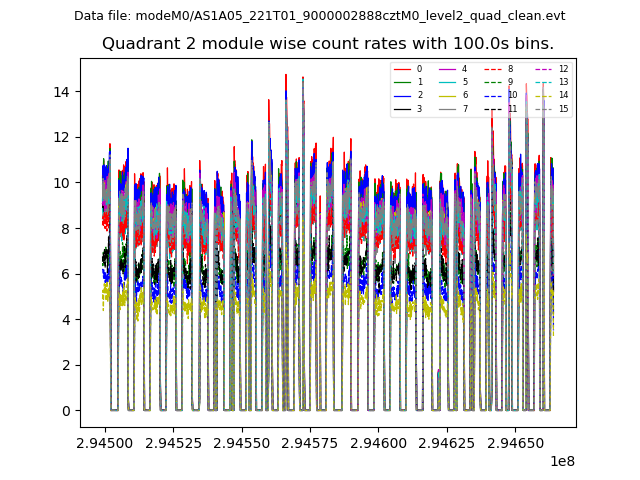
| Module-wise count rates for Quadrant B Data is divided into 100 sec bins |
 |
 |
| Module-wise count rates for Quadrant C Data is divided into 100 sec bins |
 |
 |
| Module-wise count rates for Quadrant D Data is divided into 100 sec bins |
 |
 |
| Parameter | Plot |
|---|---|
| CZT HV Monitor | 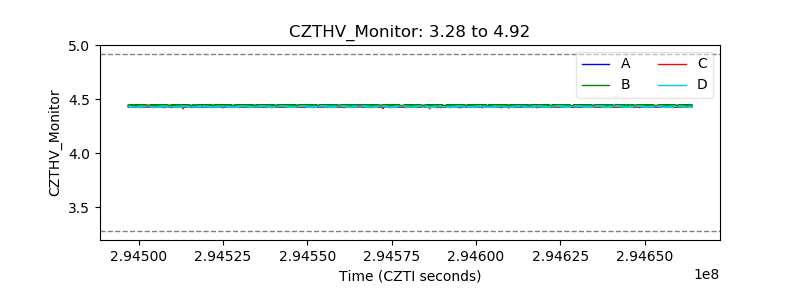 |
| D_VDD | 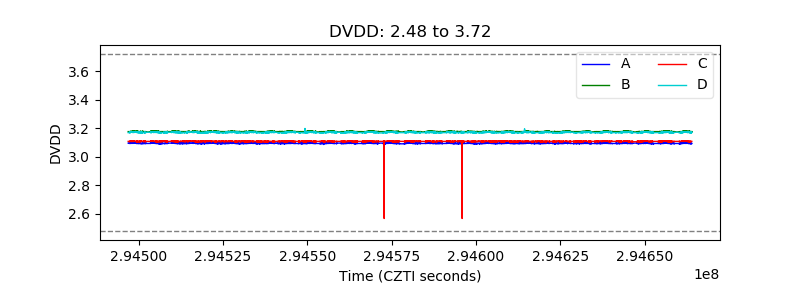 |
| Temperature 1 | 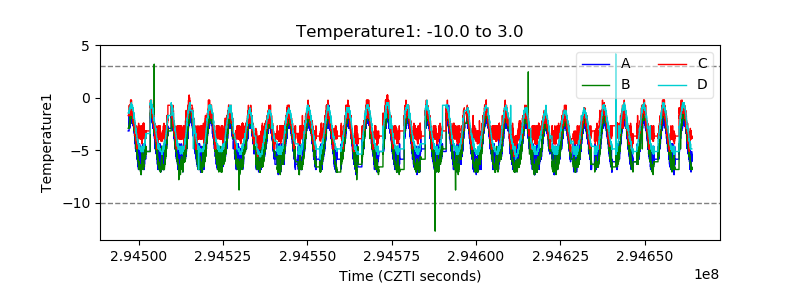 |
| Veto HV Monitor |  |
| Veto LLD | 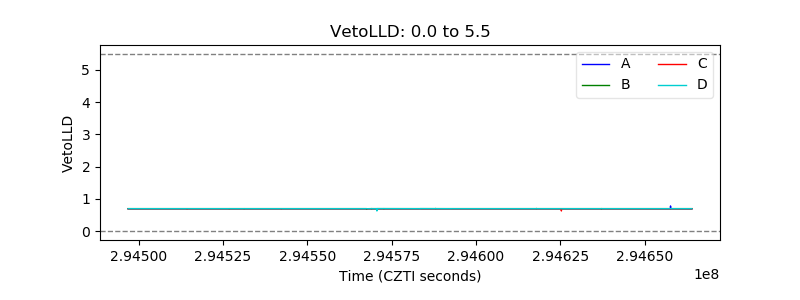 |
| Alpha Counter | 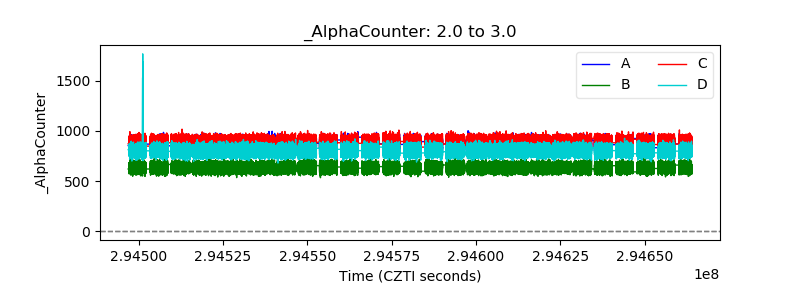 |
| _CPM_Rate | 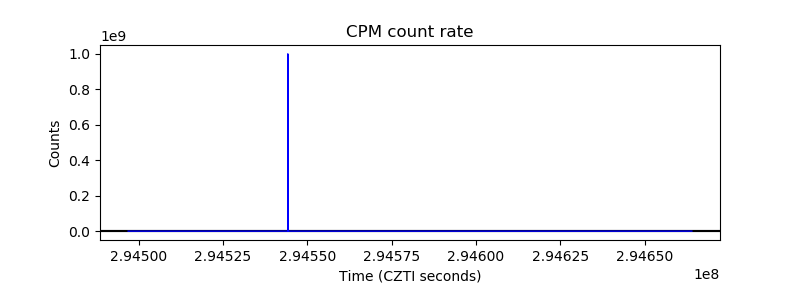 |
| CZT Counter | 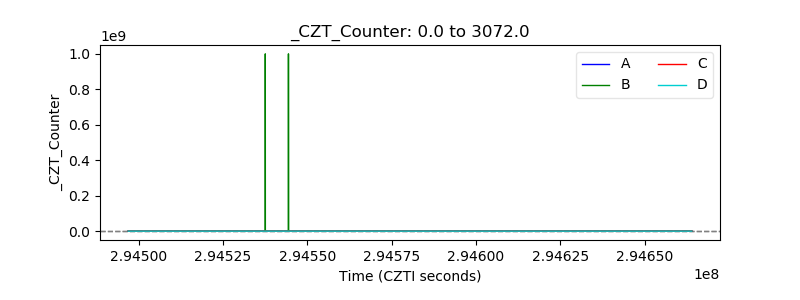 |
| +2.5 Volts monitor | 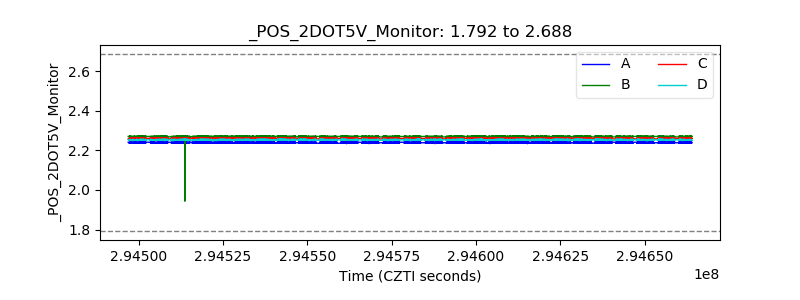 |
| +5 Volts monitor | 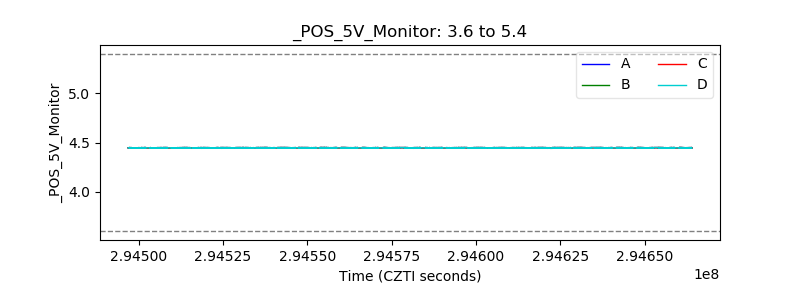 |
| _ROLL_ROT | 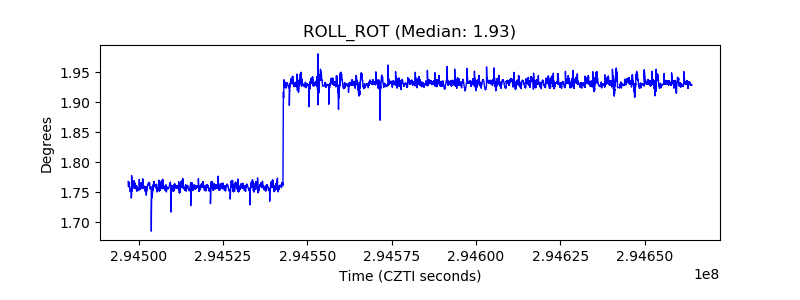 |
| _Roll_DEC | 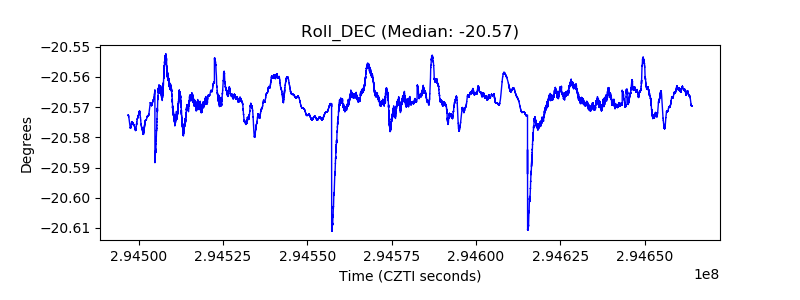 |
| _Roll_RA | 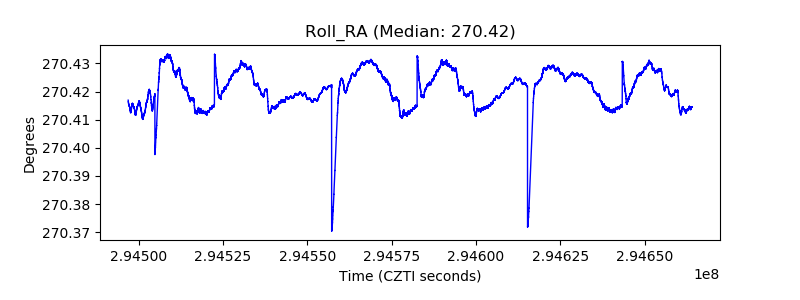 |
| Veto Counter | 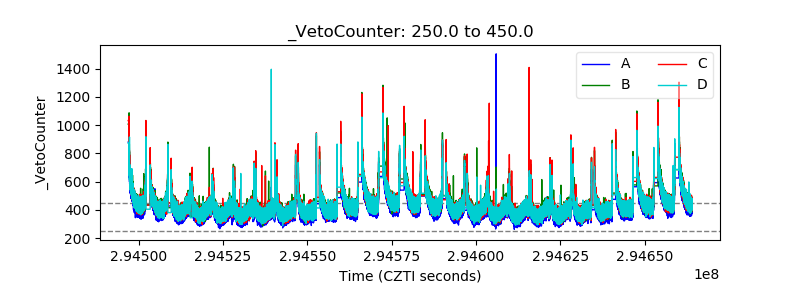 |